. 2022 Nov 8;23(22):13664.
doi: 10.3390/ijms232213664.

Episignature Mapping of TRIP12 Provides Functional Insight into Clark-Baraitser Syndrome

Affiliations

Episignature Mapping of TRIP12 Provides Functional Insight into Clark-Baraitser Syndrome

Liselot van der Laan et al. Int J Mol Sci. .

Abstract

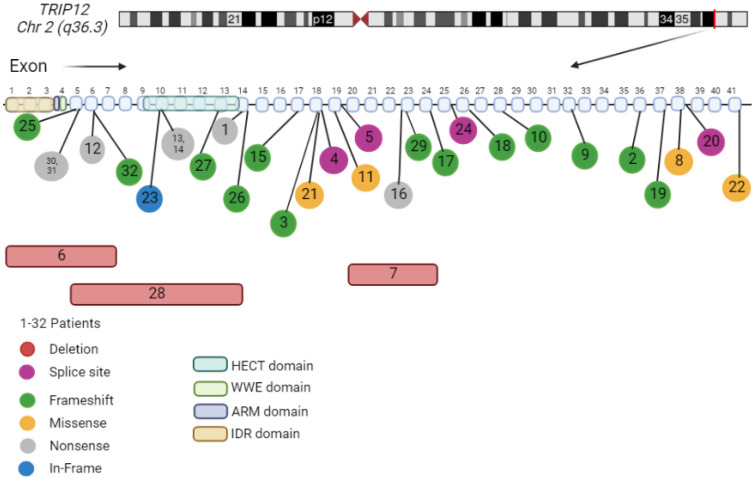
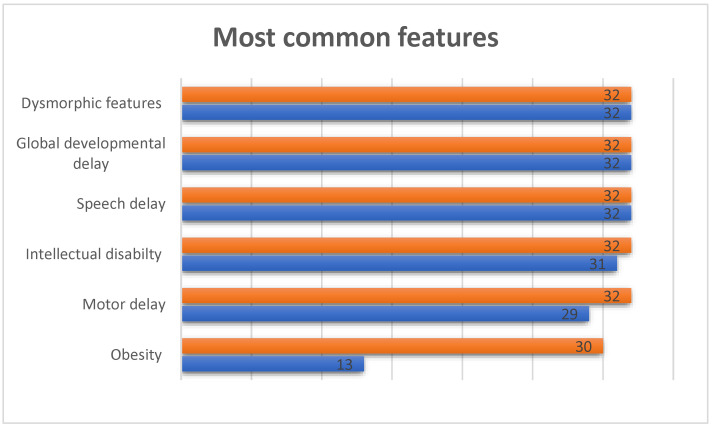
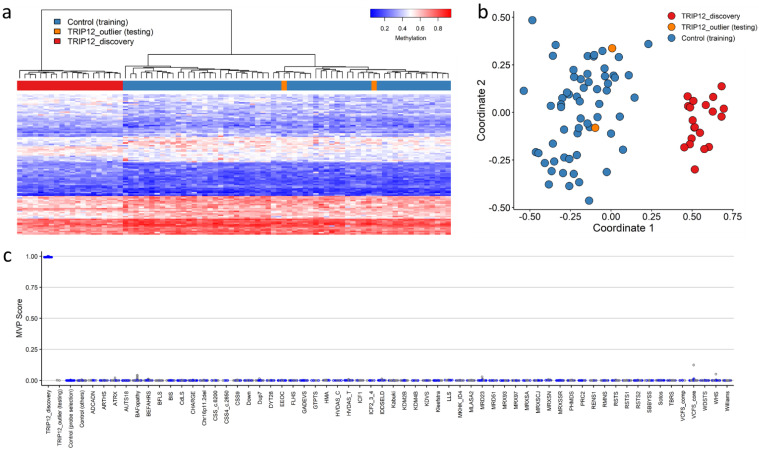
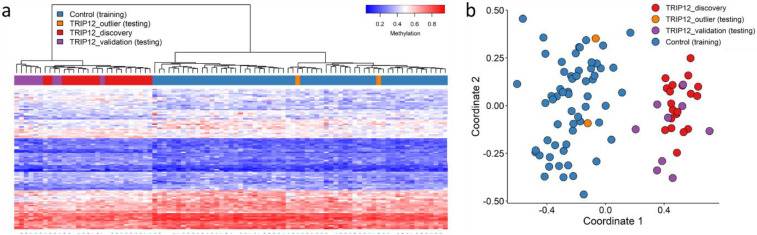
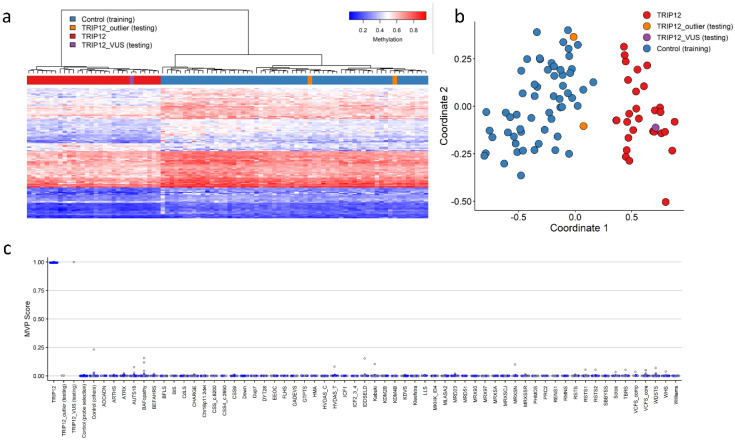
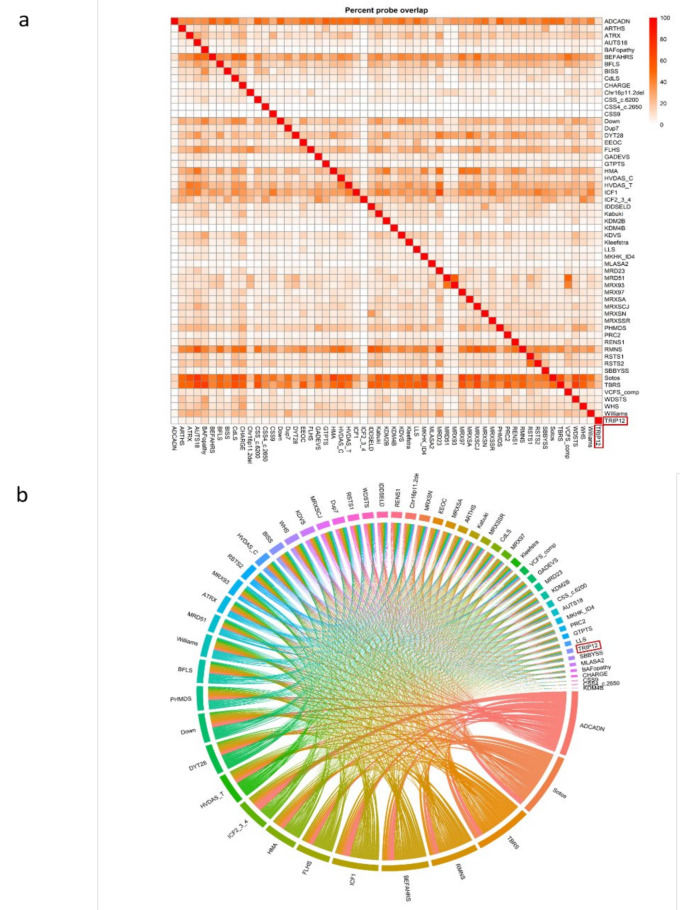
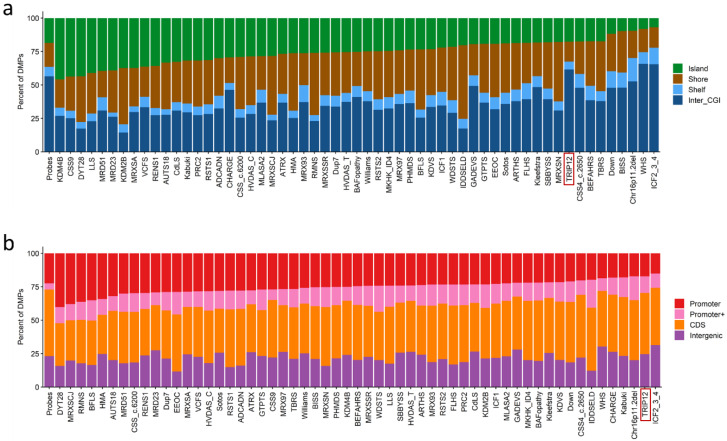
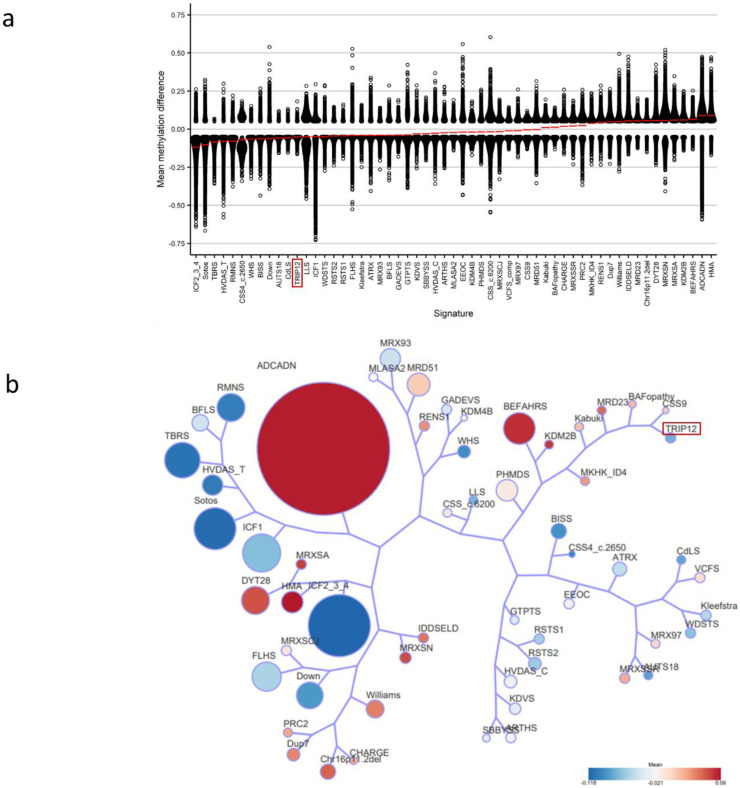
Clark-Baraitser syndrome is a rare autosomal dominant intellectual disability syndrome caused by pathogenic variants in the TRIP12 (Thyroid Hormone Receptor Interactor 12) gene. TRIP12 encodes an E3 ligase in the ubiquitin pathway. The ubiquitin pathway includes activating E1, conjugating E2 and ligating E3 enzymes which regulate the breakdown and sorting of proteins. This enzymatic pathway is crucial for physiological processes. A significant proportion of TRIP12 variants are currently classified as variants of unknown significance (VUS). Episignatures have been shown to represent a powerful diagnostic tool to resolve inconclusive genetic findings for Mendelian disorders and to re-classify VUSs. Here, we show the results of DNA methylation episignature analysis in 32 individuals with pathogenic, likely pathogenic and VUS variants in TRIP12. We identified a specific and sensitive DNA methylation (DNAm) episignature associated with pathogenic TRIP12 variants, establishing its utility as a clinical biomarker for Clark-Baraitser syndrome. In addition, we performed analysis of differentially methylated regions as well as functional correlation of the TRIP12 genome-wide methylation profile with the profiles of 56 additional neurodevelopmental disorders.

Keywords: Clark–Baraitser syndrome; DNA methylation; TRIP12; episignature; intellectual disability.


Conflict of interest statement

The authors declare no conflict of interest.

Figures

Figure 1
Figure 1
Individuals’ genetic information. For corresponding variant information, see Table 1. Cases with deletions (red square), splice site (purple circle), frameshift (green round), missense (yellow circle) and nonsense (grew circle) variants. Alamut Visual version 1.6.1 NM_004238.3 TRIP12. Created with Biorender.com (accessed on 3 March 2022) [5,24].
Figure 2
Figure 2
Most common features in individuals with TRIP12 variants. The orange bar shows the number of individuals in our cohort for whom phenotypic information was available and the blue bar shows how many individuals in our cohort scored positive on this particular clinical feature.
Figure 3
Figure 3
Clark–Baraitser syndrome (TRIP12) episignature—discovery cohort: (a) Euclidean hierarchical clustering (heatmap): each column represents a single TRIP12 discovery case or control; each row represents 1 of the 105 CpG probes selected for the episignature. This heatmap shows clear separation between 20 TRIP12 cases (red) from controls (blue). Two outlier cases (orange) are shown to segregate with controls; (b) Multidimensional scaling (MDS) plot shows segregation of TRIP12 cases from both controls and outlier cases; (c) Support Vector Machine (SVM) classifier model. The model was trained using the 105 selected TRIP12 episignature probes, 75% of controls and 75% of other neurodevelopmental disorder samples (blue). The remaining 25% controls and 25% of other disorder samples were used for testing (grey). Plot shows the TRIP12 discovery cases with a methylation variant pathogenicity (MVP) score close to 1 compared with all other samples, showing the specificity of the classifier and episignature.
Figure 4
Figure 4
Validation of the Clark–Baraitser syndrome (TRIP12) episignature—validation cohort: (a) Euclidean hierarchical clustering (heatmap): each column represents a single TRIP12 case or control; each row represents 1 of the 105 CpG probes selected for the episignature. This heatmap shows segregation of the 9 TRIP12 validation cases (purple) with the 20 TRIP12 training (discovery) cases (red) from controls (blue). The 2 outlier cases (orange) remain segregated with controls; (b) Multidimensional scaling (MDS) plot shows segregation of TRIP12 cases (validation and discovery) from controls.
Figure 5
Figure 5
Assessment of TRIP12 variant of uncertain significance (VUS) using the Clark–Baraitser syndrome (TRIP12) episignature: (a) Euclidean hierarchical clustering (heatmap): each column represents a TRIP12 case or control; each row represents 1 of the 118 CpG probes selected for the episignature. This heatmap shows clear separation between 29 TRIP12 cases (red) used for training from controls (blue). The VUS case (purple) is shown to segregate with training cases. Two outlier cases (orange) are shown to segregate with controls; (b) Multidimensional scaling (MDS) plot shows the segregation of the TRIP12 VUS case with training and away from both controls and outlier cases; (c) Support Vector Machine (SVM) classifier model. Model was trained using the 118 selected TRIP12 episignature probes, 75% of controls and 75% of other neurodevelopmental disorder samples (blue). The remaining 25% controls and 25% of other disorder samples were used for testing (grey). Plot shows the TRIP12 VUS case with a methylation variant pathogenicity (MVP) score close to 1, similar to the TRIP12 training cases, showing the specificity of the classifier and episignature.
Figure 6
Figure 6
Differentially methylated probes (DMPs) shared between the TRIP12 cohort and 56 other EpiSign™ disorders with known episignatures: (a) heatmap showing the percentage of probes shared between each paired cohort. Colors indicate the percentage of the y-axis cohort’s probes that are also found in the x-axis cohort’s probes. (b) Circos plot representing the probes shared between each pair of cohorts. The thickness of the connecting lines indicates the number of probes shared between the two cohorts. Abbreviations are listed in Supplementary Table S3.
Figure 7
Figure 7
Differentially methylated probes (DMPs) annotated in the context of CpG islands and genes: (a) DMPs annotated in the context of CpG islands. Island, CpG islands; Shore, within 0–2 kb of a CpG island boundary; Shelf, within 2–4 kb of a CpG island boundary; Inter_CGI, all other regions in the genome. (b) DMPs annotated in the context of genes. Promoter, 0–1 kb upstream of the transcription start site (TSS); Promoter+, 1–5 kb upstream of the TSS; CDS, coding sequence; Intergenic, all other regions of the genome. The Probes column in both (a,b) represents the background distribution determined in the Levy et al. study [25] of all array probes after initial filtering and used as input for DMP analysis. Abbreviations of all array probes after initial filtering and used as input for DMP analysis are listed in Supplementary Table S3 [25].
Figure 8
Figure 8
Relationships between the TRIP12 cohort and 56 other EpiSign™ disorders: (a) Methylation differences of all differentially methylated probes (DMPs) for each cohort, sorted by mean methylation. Each circle represents one probe. Red lines indicate mean methylation; (b) Tree and leaf visualization of Euclidean clustering of all 57 cohorts using the top n DMPs for each group, where n = min (# of DMPs, 500). Cohort samples were aggregated using the median value of each probe within a group. A leaf node represents a cohort, with node sizes illustrating relative scales of the number of selected DMPs for the corresponding cohort, and node colors are indicative of the global mean methylation difference. Abbreviations are listed in Supplementary Table S3.

References

    1. Louie R.J., Friez M.J., Skinner C., Baraitser M., Clark R.D., Schwartz C.E., Stevenson R.E. Clark-Baraitser syndrome is associated with a nonsense alteration in the autosomal gene TRIP12. Am. J. Med. Genet. Part A. 2020;182:595–596. doi: 10.1002/ajmg.a.61443. - DOI - PubMed
    1. Bramswig N.C., Lüdecke H.-J., Pettersson M., Albrecht B., Bernier R.A., Cremer K., Eichler E.E., Falkenstein D., Gerdts J., Jansen S., et al. Identification of new TRIP12 variants and detailed clinical evaluation of individuals with non-syndromic intellectual disability with or without autism. Hum. Genet. 2017;136:179–192. doi: 10.1007/s00439-016-1743-x. - DOI - PMC - PubMed
    1. Lelieveld S.H., Reijnders M.R.F., Pfundt R., Yntema H.G., Kamsteeg E.-J., de Vries P., A de Vries B.B., Willemsen M.H., Kleefstra T., Löhner K., et al. Meta-analysis of 2104 trios provides support for 10 new genes for intellectual disability. Nat. Neurosci. 2016;19:1194–1196. doi: 10.1038/nn.4352. - DOI - PubMed
    1. Ilyas M., Mir A., Efthymiou S., Houlden H. The genetics of intellectual disability: Advancing technology and gene editing. F1000Research. 2020;9:F1000. doi: 10.12688/f1000research.16315.1. - DOI - PMC - PubMed
    1. Brunet M., Vargas C., Larrieu D., Torrisani J., Dufresne M. E3 Ubiquitin Ligase TRIP12: Regulation, Structure, and Physiopathological Functions. Int. J. Mol. Sci. 2020;21:8515. doi: 10.3390/ijms21228515. - DOI - PMC - PubMed

Supplementary concepts

LinkOut - more resources