. 2022 Nov 16;23(22):14179.
doi: 10.3390/ijms232214179.

Effect of the First Feeding on Enterocytes of Newborn Rats

Affiliations

Effect of the First Feeding on Enterocytes of Newborn Rats

Maria A Nikonova et al. Int J Mol Sci. .

Abstract

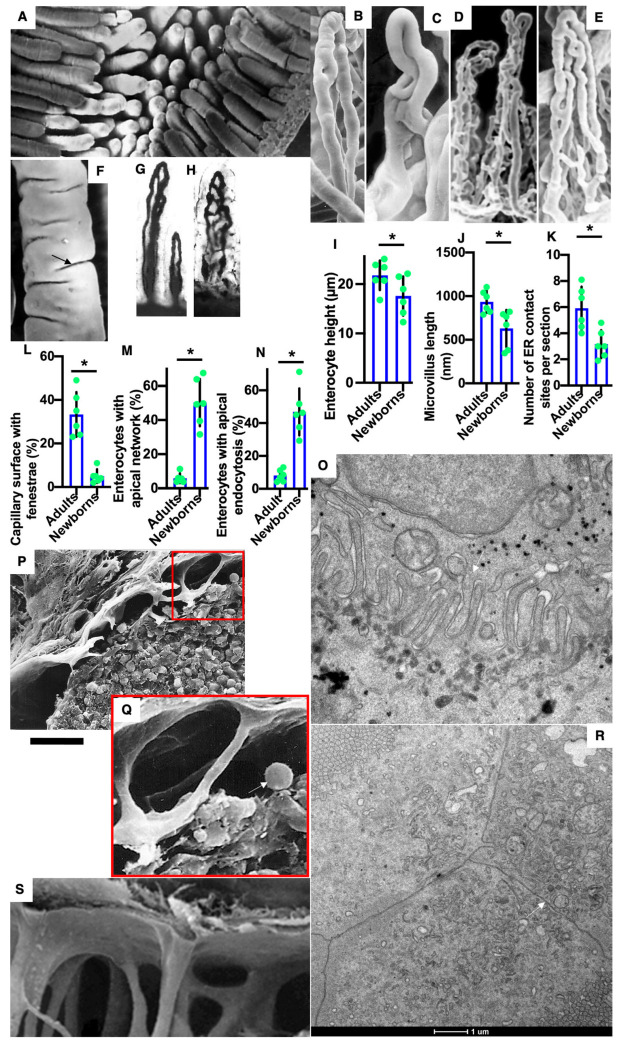
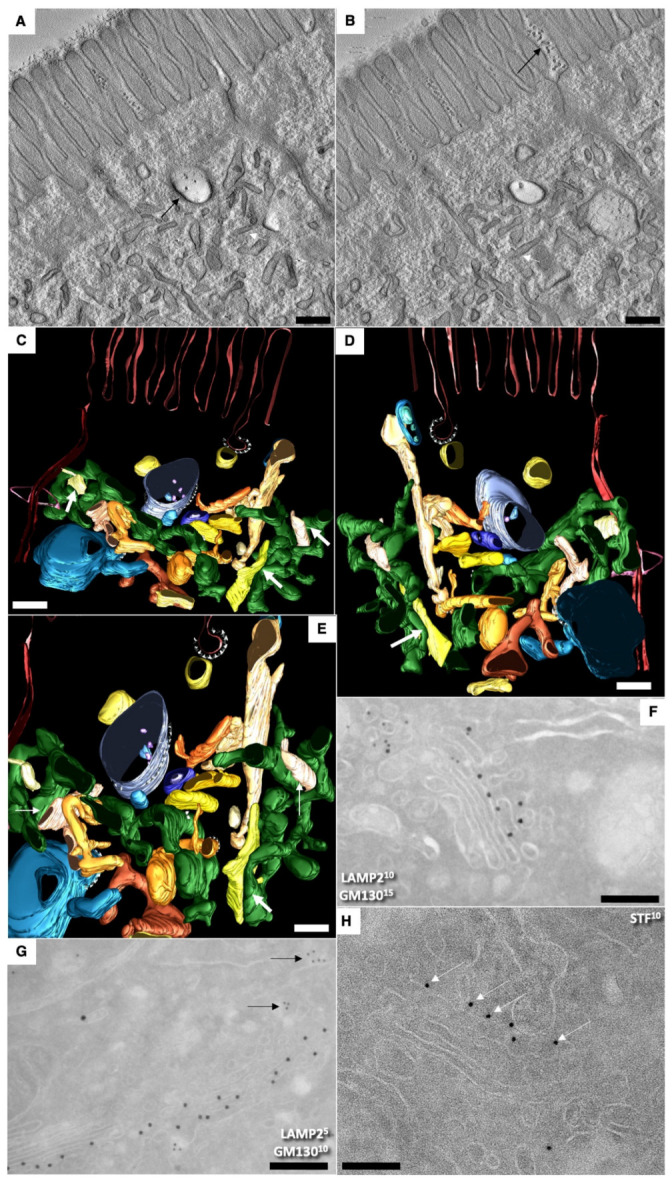
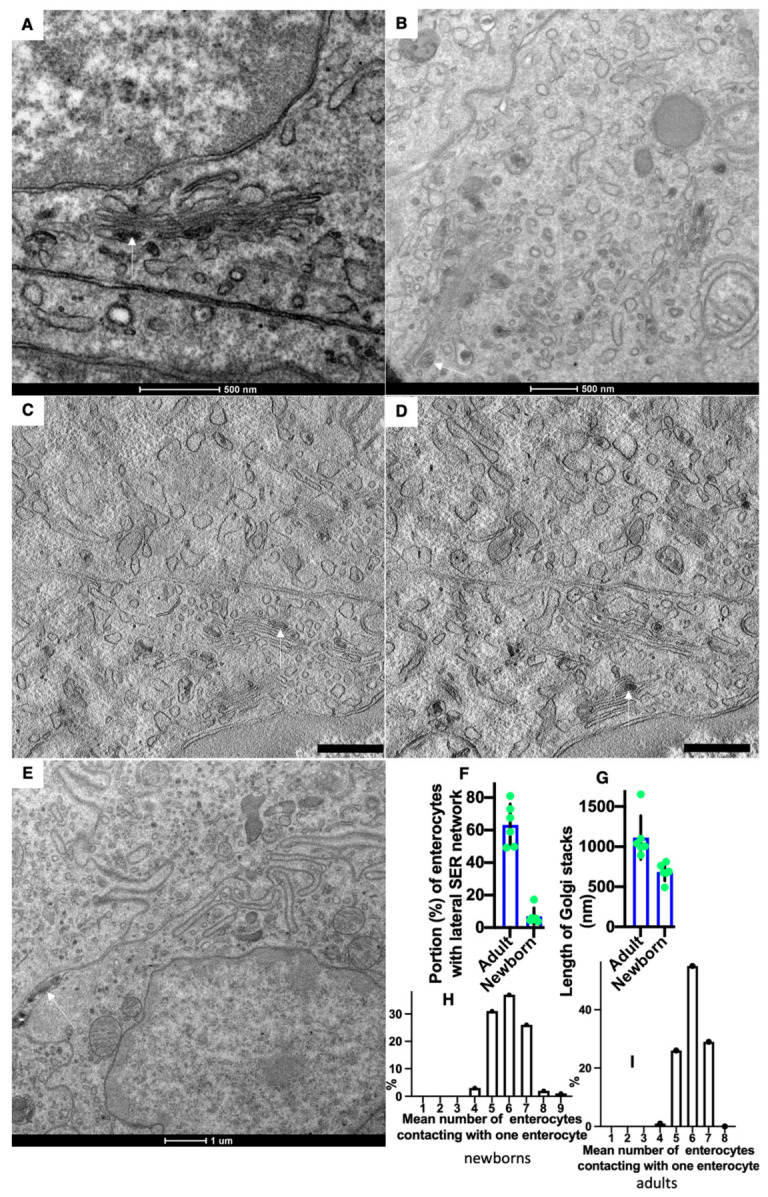
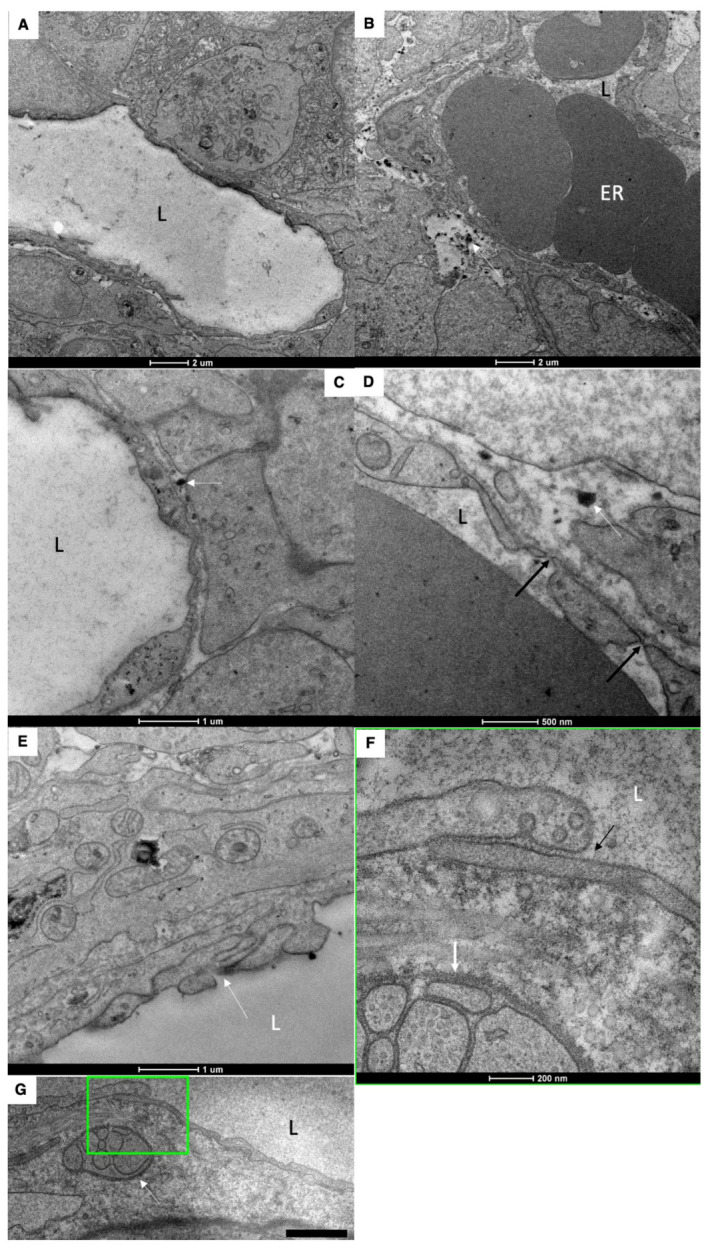
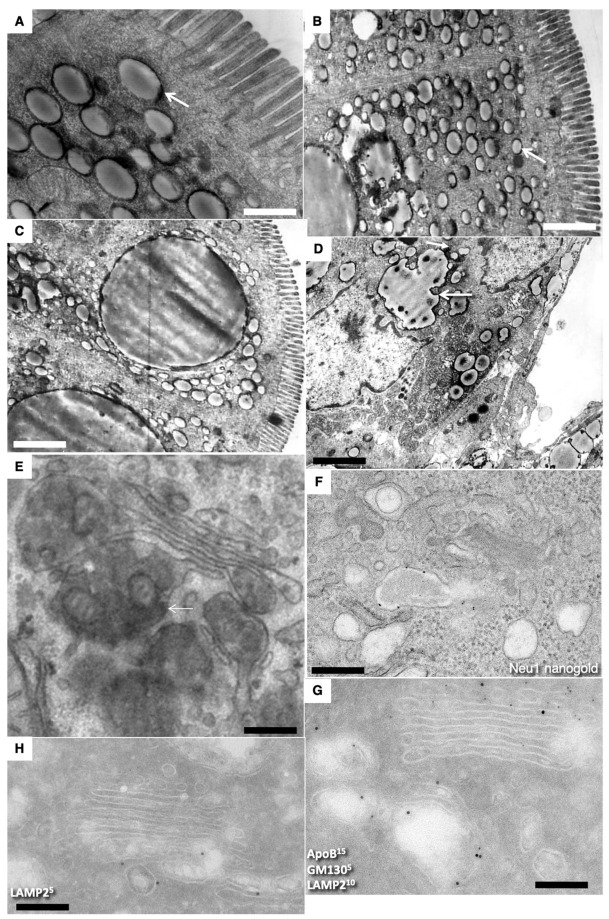
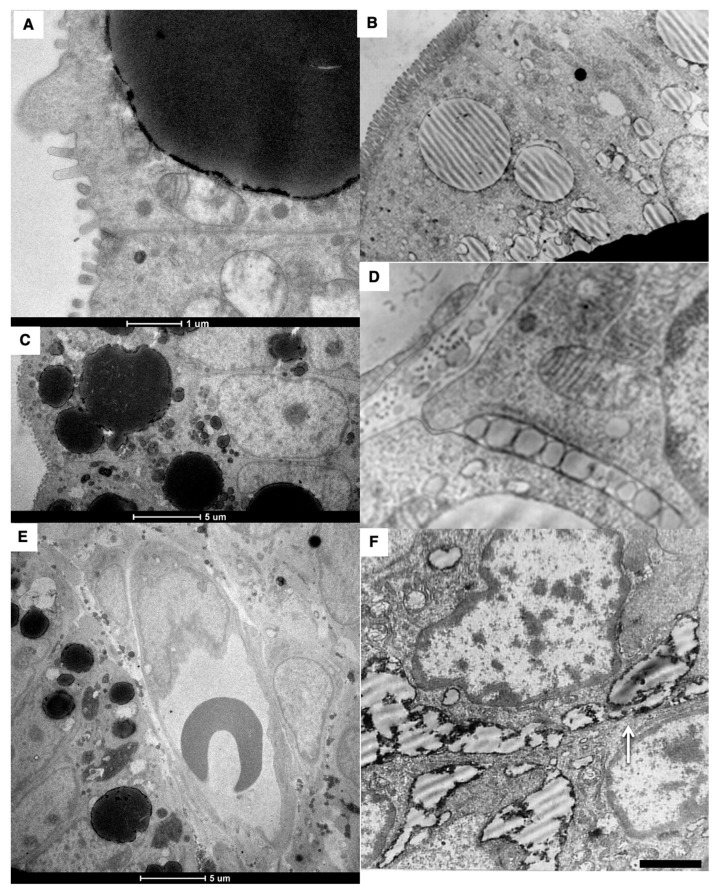
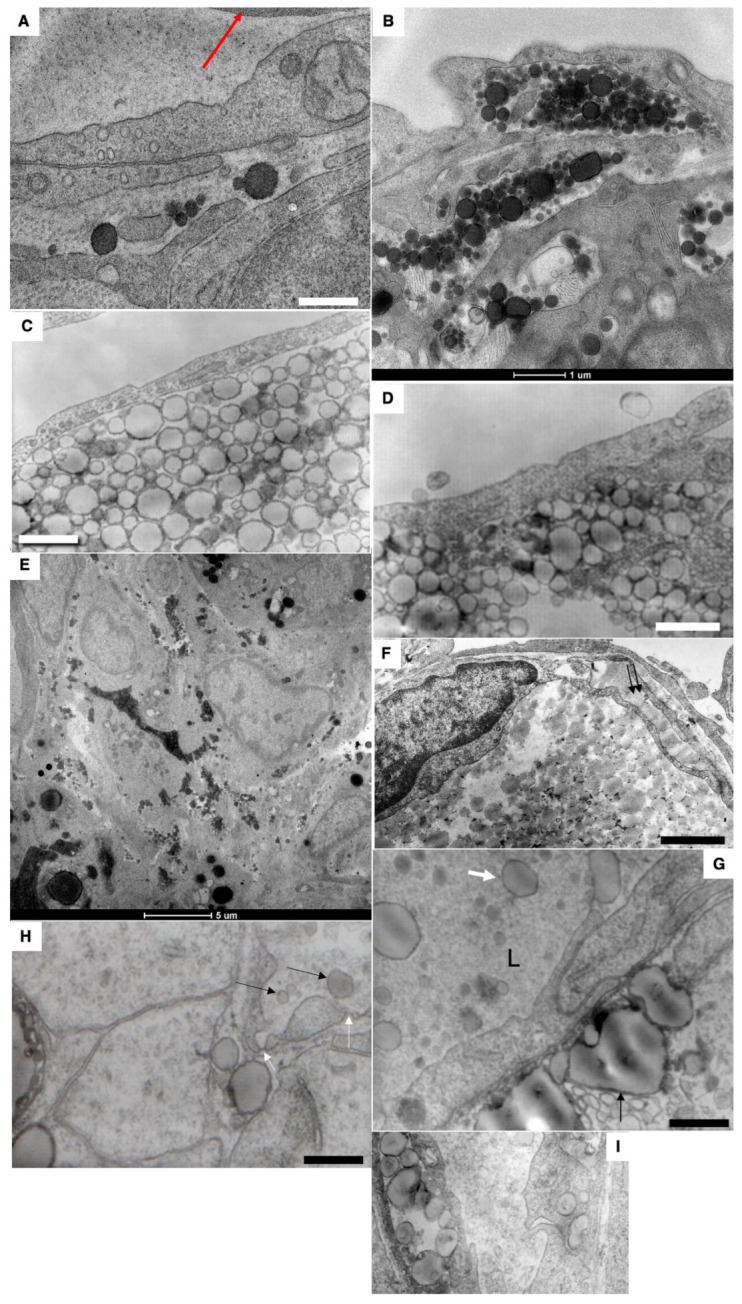
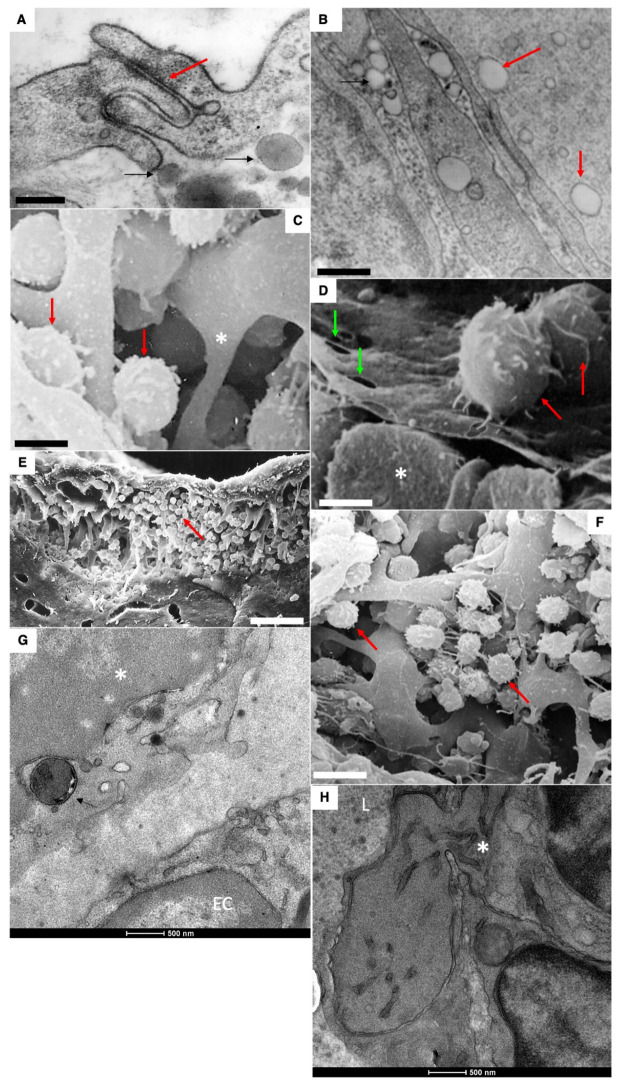
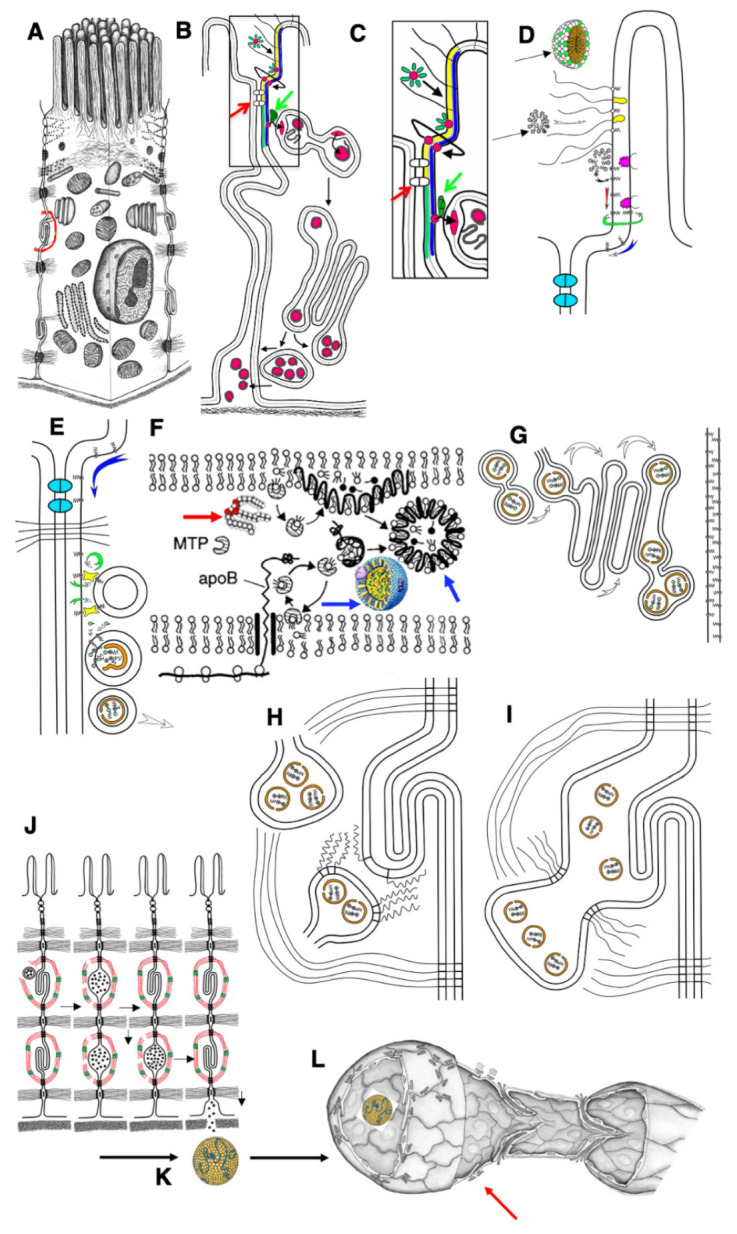
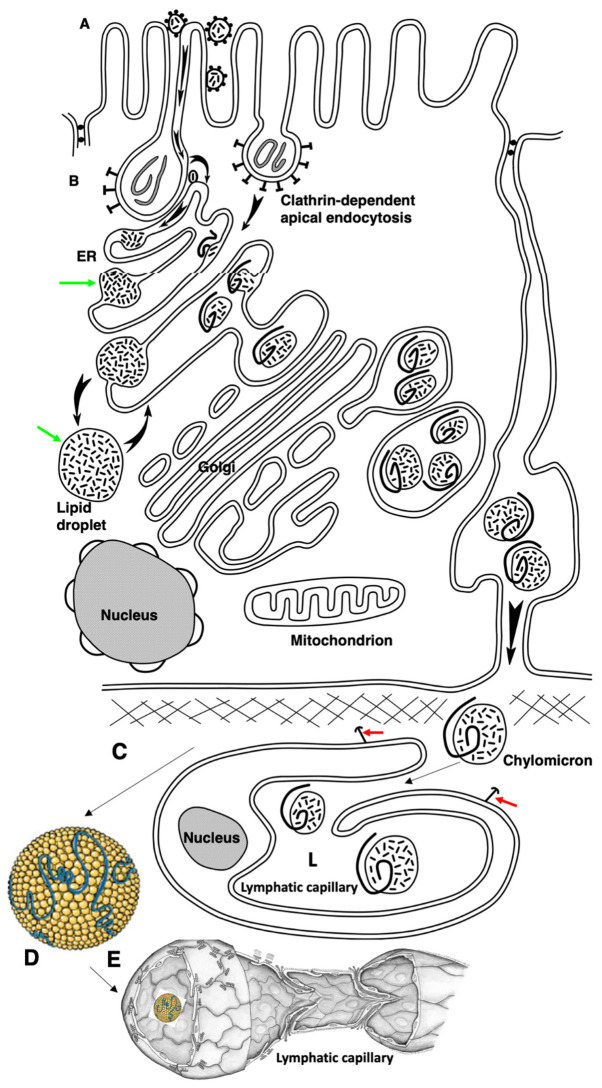
The transcytosis of lipids through enterocytes occurs through the delivery of lipid micelles to the microvilli of enterocytes, consumption of lipid derivates by the apical plasma membrane (PM) and then their delivery to the membrane of the smooth ER attached to the basolateral PM. The SER forms immature chylomicrons (iChMs) in the ER lumen. iChMs are delivered at the Golgi complex (GC) where they are subjected to additional glycosylation resulting in maturation of iChMs. ChMs are secreted into the intercellular space and delivered into the lumen of lymphatic capillaries (LCs). The overloading of enterocytes with lipids induces the formation of lipid droplets inside the lipid bilayer of the ER membranes and transcytosis becomes slower. Here, we examined components of the enterocyte-to-lymphatic barriers in newly born rats before the first feeding and after it. In contrast to adult animals, enterocytes of newborns rats exhibited apical endocytosis and a well-developed subapical endosomal tubular network. These enterocytes uptake membranes from amniotic fluid. Then these membranes are transported across the polarized GC and secreted into the intercellular space. The enterocytes did not contain COPII-coated buds on the granular ER. The endothelium of blood capillaries situated near the enterocytes contained only a few fenestrae. The LCs were similar to those in adult animals. The first feeding induced specific alterations of enterocytes, which were similar to those observed after the lipid overloading of enterocytes in adult rats. Enlarged chylomicrons were stopped at the level of the LAMP2 and Neu1 positive post-Golgi structures, secreted, fused, delivered to the interstitial space, captured by the LCs and transported to the lymph node, inducing the movement of macrophages from lymphatic follicles into its sinuses. The macrophages captured the ChMs, preventing their delivery into the blood.

Keywords: Golgi complex; enterocytes; lipid overloading; lymphatic capillaries; newborn; transcytosis.


Conflict of interest statement

The authors declare no conflict of interest. The funders had no role in the design of the study; in the collection, analyses or interpretation of data; in the writing of the manuscript, or in the decision to publish the results.

Figures

Figure 1
Figure 1
Structure of enterocytes, vascular beds and lymph nodes in newborn rats before their feeding. (A,F) Scanning electron microscopy of the luminal surface of intestinal villi. (BH) The structure of the vascular bed of the intestinal villi of newborn rats before their feeding. (BE) Corrosion casts of blood microvessels in intestinal villus of newborn rats. (G,H) Total preparations of intestinal villi after staining for horseradish peroxidase. Blood capillaries contain black precipitate of DAB-HRP reaction in their lumen. (IN) Graphs describing quantitative data of enterocytes. The percentage of enterocytes with a pronounced subapical network is higher in newborn rats. (O) Large interdigital contact (arrow) between two enterocytes in newborn rat before its feeding. (P,Q,S) Scanning EM of the subcapsular sinus of lymph node shows that before the first feeding of newborn rats, this sinus is almost empty and contained lower number of macrophages (arrow). This marker (gold dots) is visible at the trans side of Golgi stacks. (R) Simple contacts (arrow) between enterocytes without IDCs. *with the horizontal line below indicates that these two bars are different (p<0.05). Scale bars: 200 µm (A); 80 µm (BE); 25 µm (F); 103 µm (G,H); 15 µm (P); 270 nm (O); 5 µm (Q). In (R), the scale bar is equal to 1 µm (indicated below it).
Figure 2
Figure 2
Structure of enterocytes in newborn rats before their first feeding. (AF) Subapical membranous tubular network (white arrows). Black arrows indicate membrane remnants between microvilli and inside endosome (A). (A,B) Serial tomographic images. (CF) A three-dimensional model obtained on the basis of EM tomography. View from different angles (F). The enlarged area of the image enclosed inside the red box in (D). ER is colored green. Rough ER is large vacuoles and cisterns. Smooth ER is tubes. Endosomal structures are yellow. The purple color indicates APM. The BLPM is indicated in red. Multivesicular corpuscles and late endosomes are indicated in blue. Endosomal–ER contact sites are shown with white arrows. Clathrin—purple triangles. The Golgi stacks were already polarized. The immune EM marking for GM130 is present on the side of the Golgi complex (see movie 1). (G,F) Labeling for LAMP2 and GM130 (G) in (G) and LAMP2 (10 nm ) and Golgin-97 (15 nm) on (F). (H) Immune EM labeling for sialyltransferase (STF) of the enterocytes Golgi stack. Scale bars: 270 nm (G); 210 nm (F); 230 nm (H). In (AE), scale bars are equal to 250 nm. In (E), the scale bar is equal to 70 nm.
Figure 3
Figure 3
Structure of Golgi complex (GC) and vascular walls in newborn rats before their first feeding. (A,B) Routine Epon sections. (C,D) Serial tomographic slices. Multilamellar structures (arrows) are visible in the cisternal distension of the GCs. (E) Membrane remnants (white arrow) are visible inside the contact space between enterocytes. (F) The graph shows that in newborn rats, lower (p < 0.05) number of enterocytes exhibited lateral SER network. (G) The graph shows that in newborn rats, the length of Golgi stacks was lower (p < 0.05). (H,I) Graphs show the distribution of the mean number of neighbors of one enterocyte in newborn (H) and adult (I) rats. In the newborn rats, the shift of these distributions towards the low number is significant (p < 0.05). Scale bars: 465 nm (C,D). In (A,B,E), scale bars are indicated below each image.
Figure 4
Figure 4
Structure of blood and lymph capillaries in newborn rats before their first feeding. (AC) Blood capillary. Low number of fenestrae in capillary wall. (D) Low density of fenestrae (black arrows). White arrows in (BD) show membrane remnants in the interstitial space. (EG) EM images of the LC wall. White arrow in (E) shows complex inter-endothelial contact. White arrows in (F,G) indicate nervous terminal. The square box with green border it enlarged in (F). (F) Enlarged area inside the square box with green borders in (G). Black arrows indicate the simple tile-like contact between endothelial cells of LC. Low number of caveolae. L, lumen of blood and lymph capillaries. ER, erythrocytes. Scale bars: 990 nm (G). In (AF), scale bars are indicated below images.
Figure 5
Figure 5
Structure of enterocytes in newborn rats after their first feeding. (AC) Formation of large lipid droplets (white arrows) in the cytoplasm. (D) Formation of “lipid lakes” (black arrows) between enterocytes after the first feeding of a newborn rat. (E) Overloading of the GC. (F) Large ChMs in post-Golgi compartment positive for Nau1. (G,H) Labeling for LAMP2, GM130 and ApoB of post-Golgi carriers containing large ChMs. Scale bars: 510 nm (A); 1020 nm (B); 1.3 µm (C); 1025 nm (D); 240 nm (E); 340 nm (F).
Figure 6
Figure 6
Structure of small intestine enterocytes in newborn rats after their first feeding. (AC) Formation of huge droplets and “lipid lakes” in enterocytes of newborn rats after the first feeding. (A,C) Thick (200 nm) sections. (D) Large ChMs between enterocytes. (E) The lumen of the blood capillary with the erythrocytes inside its lumen does not contain chylomicrons. (F) “Lipid lakes” between enterocytes. Scale bars: 1050 nm (B); 290 nm (D); 610 nm (F). In (A,C,E), scale bars are indicated below each image.
Figure 7
Figure 7
Passage (presumably) of large chylomicrons through intercellular spaces. (A) Large chylomicrons are not captured by blood capillaries (the red arrow shows erythrocyte). (BD) Accumulation of chylomicrons in the interstitial space. (E). Accumulation of chylomicrons between enterocytes. (F,G) Uptake of chylomicrons into the lymphatic capillary. Double arrows in (F) show large chylomicron in the inter-endothelial contact. (G) Large ChMs in the lumen of the lymphatic capillary. (H) Rarely, ChMs (shown by black arrows) were seen in the blood capillary, in the wall of which single fenestrae are visible (shown by white arrows). (I) Chylomicrons (to the right) inside the vacuoles within cytoplasm of endothelial cells of lymphatic capillary. Scale bars: 595 nm (A,H); 610 nm (C): 460 nm (D,I); 900 nm (F); 570 nm (G). In (B,E), scale bars are indicated below images.
Figure 8
Figure 8
Mechanisms of resorption of large ChMs from the interstitial space into LCs of a newborn rat after feeding. (A,B) The lumen of LC is filled with ChMs (shown by the arrow). Large lipid droplets are visible in the interstitial (shown by the black arrows). (B) Interdigital contact between endothelial cells in LCs does not allow ChMs (arrows) to pass through it. (CH) Migration of macrophages into subcapsular sinus of lymph node after the first feeding. Uptake of large chylomicrons by macrophages (G). Red arrows in all images indicate leucocytes. White asterisks demonstrate monocytes. Green arrows show pores in endothelial cells surrounding the sinus from the follicular side. Scale bars: 420 nm (A); 560 nm (B); 5.4 µm (C); 4 µm (D); 30 µm (E); 10.8 µm (F). In images (G,H), scale bars are below images and are equal to 500 nm.
Figure 9
Figure 9
Schemes of the mechanisms of lipid transcytosis across enterocytes and their uptake by lymphatic capillary in adult rats (adapted from [4]). (A) Enterocyte. (B) The gut micelle (red ring surrounded with green ovals) is composed of free fatty acids (FFAs), cholesterol and bile acids (green ovals). The micelle passes through glycocalyx (black lines) and contacts with the external leaflet of the apical plasma membrane (APM; yellow layer). Then, FFAs and cholesterol are subjected to flip-flop (the bent line shows this path of red ring) and appear in the cytosolic leaflet of the APM (blue layer). (C,D) Higher magnification of the pathways shown in (B). (D) The micelles (black arrows) pass through glycocalyx (white arrow). Membrane proteins containing long polysaccharide chains of glycocalyx are yellow. Caveolin is magenta. FFAs (dots, black center) are inserted into the lipid bilayer of the APM, and then diffuse along the external leaflet (red arrow) or flip-flop (green arrow) and then diffuse along the cytosolic leaflet (blue arrow). This pathway allows FFAs to reach the basolateral plasma membrane because the FFA diffusion along the external leaflet is restricted by proteins of tight junctions (indicated with red arrows in (B) and (C) or colored in light blue in (D). (C) FFAs bypass tight junctions (white dots situated between APM are indicated with red arrow) and reach the sites where cisternae of the smooth endoplasmic reticulum are attached to the basolateral PM along with lipid transfer proteins (green dot indicated with green arrows). (E) These proteins (green arrows in (B) and (C)) constantly (circular green arrow) transfer FFAs and cholesterol through cytosol into the cytosolic leaflet of the smooth endoplasmic reticulum membrane (the arc-like green arrow). (F) Then, FFAs are transformed into triacylglycerols and cholesterol ethers (double-headed structures, one green dot in (E)). Finally, these are extracted from smooth endoplasmic reticulum membranes and ApoB (orange) forms pre-chylomicrons. (D) Diffusion of FFAs along PM. (E) Delivery of lipids into membrane of smooth ER attached to the BLPM of enterocyte. (F) ApoB protein (black line) is synthesized by ribosome (white double rings below lipid bilayer of the ER). Then triacylglycerols (thick red arrow) and cholesterol ethers are captured by ApoB and MTP protein and the chylomicrons (blue arrows) are formed. (G) Pre-chylomicrons are transported from the ER at the Golgi complex, where mature chylomicrons are formed and concentrated in distensions and at the trans side (white arrows). (H) Post-Golgi carriers are formed, connected with the Golgi complex, and then fuse with the basolateral plasma membrane of the interdigitating contacts with the help of SNAREs (zip-like lines). (I) Chylomicrons are in the extracellular space within interdigitating contacts. (J) Contraction of actin–myosin cuff (red–green) induces movement of chylomicrons towards basolateral membrane and their passage through the BM pores. (K) Chylomicrons (yellow) are delivered to the interstitial space. (L) Chylomicrons are captured by lymphatic capillary (red arrow) and delivered into its lumen through the inter-endothelial contacts of endothelial cells.
Figure 10
Figure 10
The hypothetical scheme of the lipid transcytosis in enterocyte of the newborn rats. (A) Micelles containing lipids and surrounded with bile acid molecules (black dots) passed through glycocalyx and contact with the apical plasma membrane of microvilli. Then FFAs and cholesterol are subjected to flip-flop. During apical endocytosis, the membrane remnants (grey lines inside endosomes) could be captured from gut. Next, FFAs and cholesterol diffuse along the cytosolic leaflet to the contact sites between membranes of endosome and the ER. (B) In endosomes, FFAs and cholesterol are captured by the yet-unknown lipid transfer protein(s) (oval dots with a line inside) and appear in the membrane of the ER. Green arrows show the ER-derived lipid droplets. Then, their pathway is identical to that in adult rats (see Figure 10). The chylomicrons are formed with the help of ApoB. Alternatively, triacylglycerols and cholesterol ethers are accumulated inside the membrane of the ER and the lipid droplets (black arrows) are formed. Chylomicrons in newborn rats are larger than those in adult rats when their enterocytes obtained normal amounts of lipid (see Figure 9). These chylomicrons passed across the Golgi complex and were secreted into interstitial space where they could fuse with each other. (C) Finally, large chylomicrons are captured by lymphatic capillaries and appear in their lumen (L). Red arrows indicate the anchor filaments. (D) Large chylomicron. (E) 3D model of lymphatic capillary.

Similar articles

Cited by

References

    1. Karupaiah T., Sundram K. Effects of stereospecific positioning of fatty acids in triacylglycerol structures in native and randomized fats: A review of their nutritional implications. Nutr. Metab. 2007;4:16. doi: 10.1186/1743-7075-4-16. - DOI - PMC - PubMed
    1. Dash S., Xiao C., Morgantini C., Lewis G.F. New insights into the regulation of chylomicron production. Annu. Rev. Nutr. 2015;35:265–294. doi: 10.1146/annurev-nutr-071714-034338. - DOI - PubMed
    1. Sesorova I.S., Karelina N.R., Kazakova T.E., Parashuraman S., Zdorikova M.A., Dimov I.D., Seliverstova E.V., Beznoussenko G.V., Mironov A.A. Structure of the enterocyte transcytosis compartments during lipid absorption. Histochem. Cell Biol. 2020;153:413–429. doi: 10.1007/s00418-020-01851-3. - DOI - PubMed
    1. Sesorova I.S., Dimov I.D., Kashin A.D., Sesorov V.V., Karelina N.R., Zdorikova M.A., Beznoussenko G.V., Mironov A.A. Cellular and sub-cellular mechanisms of lipid transport from gut to lymph. Tissue Cell. 2021;72:101529. doi: 10.1016/j.tice.2021.101529. - DOI - PubMed
    1. Mironov A.A., Beznoussenko G.V. Opinion: On the Way towards the New Paradigm of Atherosclerosis. Int. J. Mol. Sci. 2022;23:2152. doi: 10.3390/ijms23042152. - DOI - PMC - PubMed

Grants and funding

LinkOut - more resources