

Scalable Generation of Nanovesicles from Human-Induced Pluripotent Stem Cells for Cardiac Repair
- PMID: 36430812
- PMCID: PMC9696585
- DOI: 10.3390/ijms232214334
Scalable Generation of Nanovesicles from Human-Induced Pluripotent Stem Cells for Cardiac Repair
Abstract
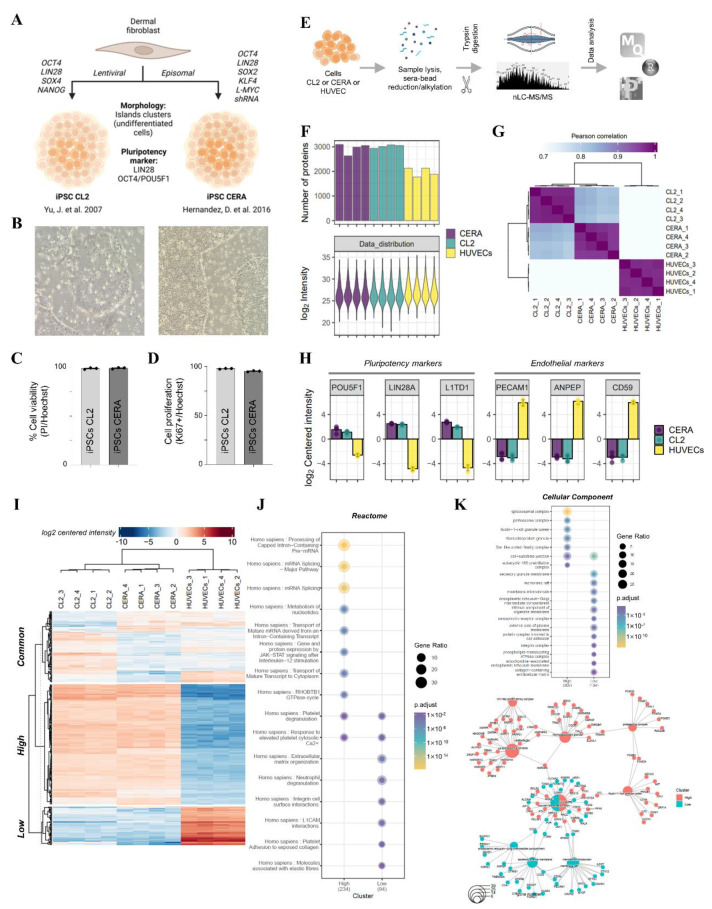
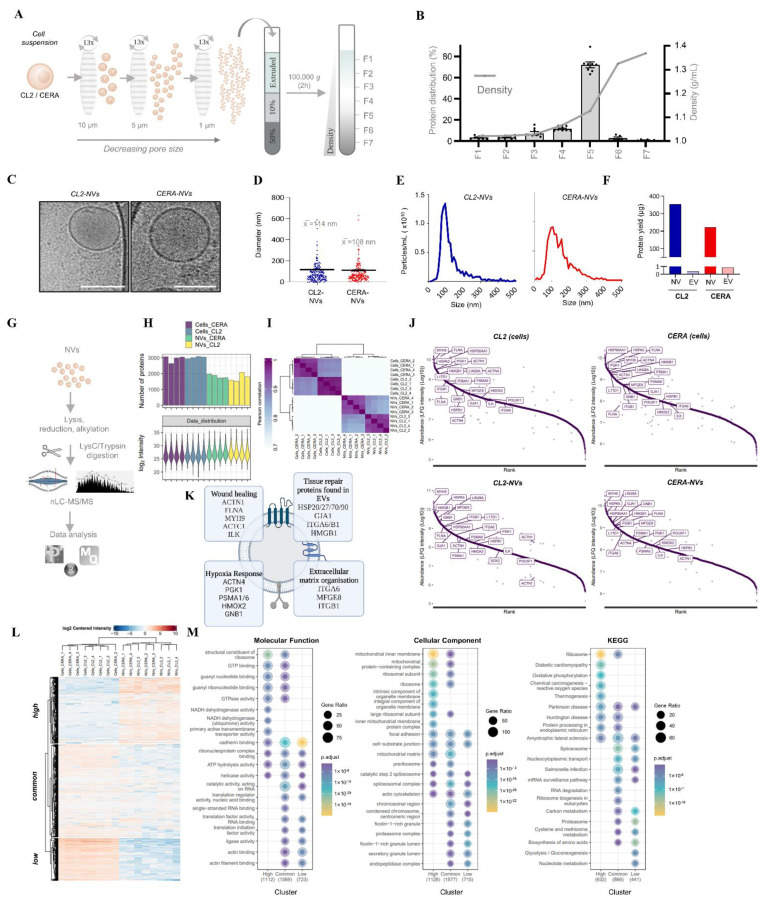
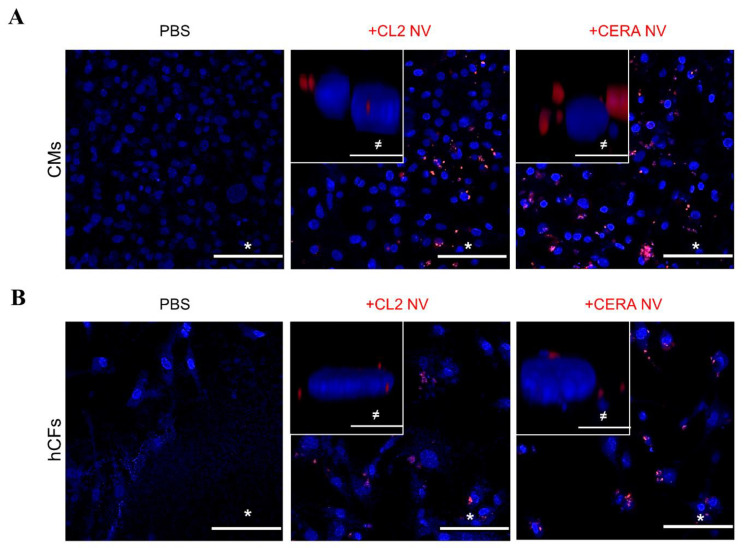
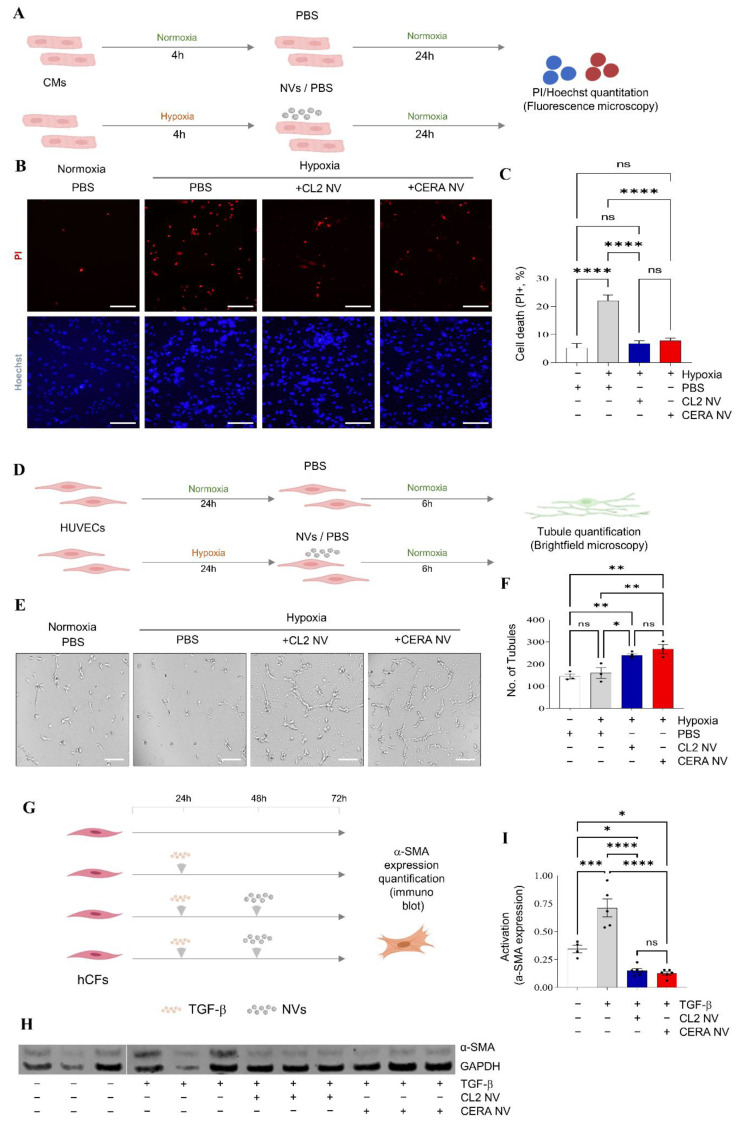
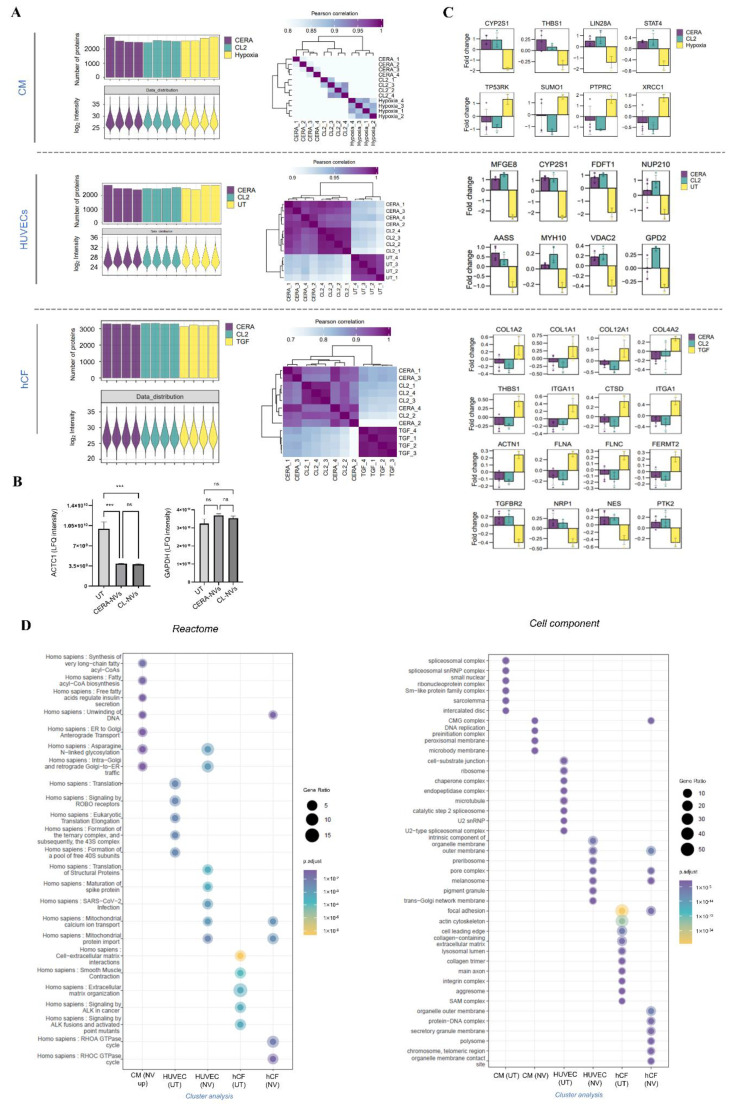
Extracellular vesicles (EVs) from stem cells have shown significant therapeutic potential to repair injured cardiac tissues and regulate pathological fibrosis. However, scalable generation of stem cells and derived EVs for clinical utility remains a huge technical challenge. Here, we report a rapid size-based extrusion strategy to generate EV-like membranous nanovesicles (NVs) from easily sourced human iPSCs in large quantities (yield 900× natural EVs). NVs isolated using density-gradient separation (buoyant density 1.13 g/mL) are spherical in shape and morphologically intact and readily internalised by human cardiomyocytes, primary cardiac fibroblasts, and endothelial cells. NVs captured the dynamic proteome of parental cells and include pluripotency markers (LIN28A, OCT4) and regulators of cardiac repair processes, including tissue repair (GJA1, HSP20/27/70, HMGB1), wound healing (FLNA, MYH9, ACTC1, ILK), stress response/translation initiation (eIF2S1/S2/S3/B4), hypoxia response (HMOX2, HSP90, GNB1), and extracellular matrix organization (ITGA6, MFGE8, ITGB1). Functionally, NVs significantly promoted tubule formation of endothelial cells (angiogenesis) (p < 0.05) and survival of cardiomyocytes exposed to low oxygen conditions (hypoxia) (p < 0.0001), as well as attenuated TGF-β mediated activation of cardiac fibroblasts (p < 0.0001). Quantitative proteome profiling of target cell proteome following NV treatments revealed upregulation of angiogenic proteins (MFGE8, MYH10, VDAC2) in endothelial cells and pro-survival proteins (CNN2, THBS1, IGF2R) in cardiomyocytes. In contrast, NVs attenuated TGF-β-driven extracellular matrix remodelling capacity in cardiac fibroblasts (ACTN1, COL1A1/2/4A2/12A1, ITGA1/11, THBS1). This study presents a scalable approach to generating functional NVs for cardiac repair.
Keywords: extracellular vesicles; human iPSCs; nanovesicles; proteomics; tissue repair.
Conflict of interest statement
The authors declare no conflict of interest.
Figures
Similar articles
-
Extruded Mesenchymal Stem Cell Nanovesicles Are Equally Potent to Natural Extracellular Vesicles in Cardiac Repair.ACS Appl Mater Interfaces. 2021 Dec 1;13(47):55767-55779. doi: 10.1021/acsami.1c08044. Epub 2021 Nov 18. ACS Appl Mater Interfaces. 2021. PMID: 34793116
-
Rapid generation of functional nanovesicles from human trophectodermal cells for embryo attachment and outgrowth.Proteomics. 2024 Jun;24(11):e2300056. doi: 10.1002/pmic.202300056. Epub 2023 Sep 12. Proteomics. 2024. PMID: 37698557
-
Biofabrication of Cell-Derived Nanovesicles: A Potential Alternative to Extracellular Vesicles for Regenerative Medicine.Cells. 2019 Nov 25;8(12):1509. doi: 10.3390/cells8121509. Cells. 2019. PMID: 31775322 Free PMC article.
-
Cell membrane-derived nanovesicles as extracellular vesicle-mimetics in wound healing.Mater Today Bio. 2025 Feb 18;31:101595. doi: 10.1016/j.mtbio.2025.101595. eCollection 2025 Apr. Mater Today Bio. 2025. PMID: 40104636 Free PMC article. Review.
-
Artificial Nanovesicles Derived from Cells: A Promising Alternative to Extracellular Vesicles.ACS Appl Mater Interfaces. 2025 Jan 8;17(1):22-41. doi: 10.1021/acsami.4c12567. Epub 2024 Dec 18. ACS Appl Mater Interfaces. 2025. PMID: 39692623 Review.
Cited by
-
Evaluating the Reparative Potential of Secretome from Patient-Derived Induced Pluripotent Stem Cells during Ischemia-Reperfusion Injury in Human Cardiomyocytes.Int J Mol Sci. 2024 Sep 24;25(19):10279. doi: 10.3390/ijms251910279. Int J Mol Sci. 2024. PMID: 39408608 Free PMC article.
-
TUBB4A relieves high glucose-induced cardiomyocyte hypertrophy and apoptosis through the regulation of ubiquitination and activation of the NOTCH signaling pathway.Cytotechnology. 2025 Jun;77(3):100. doi: 10.1007/s10616-025-00763-1. Epub 2025 May 14. Cytotechnology. 2025. PMID: 40384847
-
Small Extracellular Vesicles Derived from Induced Pluripotent Stem Cells in the Treatment of Myocardial Injury.Int J Mol Sci. 2023 Feb 26;24(5):4577. doi: 10.3390/ijms24054577. Int J Mol Sci. 2023. PMID: 36902008 Free PMC article. Review.
-
Cardiomyocyte intercellular signalling increases oxidative stress and reprograms the global- and phospho-proteome of cardiac fibroblasts.J Extracell Biol. 2023 Nov 30;2(12):e125. doi: 10.1002/jex2.125. eCollection 2023 Dec. J Extracell Biol. 2023. PMID: 38938901 Free PMC article.
-
Role of Extracellular Vesicles Produced by Stem Cells in Tissue Repair.Int J Mol Sci. 2023 Mar 2;24(5):4798. doi: 10.3390/ijms24054798. Int J Mol Sci. 2023. PMID: 36902229 Free PMC article.
References
-
- Saha B., Momen-Heravi F., Furi I., Kodys K., Catalano D., Gangopadhyay A., Haraszti R., Satishchandran A., Iracheta-Vellve A., Adejumo A., et al. Extracellular vesicles from mice with alcoholic liver disease carry a distinct protein cargo and induce macrophage activation through heat shock protein 90. Hepatology. 2018;67:1986–2000. doi: 10.1002/hep.29732. - DOI - PMC - PubMed
-
- Yue Y., Wang C., Benedict C., Huang G., Truongcao M., Roy R., Cimini M., Garikipati V.N.S., Cheng Z., Koch W.J., et al. Interleukin-10 Deficiency Alters Endothelial Progenitor Cell-Derived Exosome Reparative Effect on Myocardial Repair via Integrin-Linked Kinase Enrichment. Circ. Res. 2020;126:315–329. doi: 10.1161/CIRCRESAHA.119.315829. - DOI - PMC - PubMed
-
- Zhou M., Wen Z., Cheng F., Ma J., Li W., Ren H., Sheng Y., Dong H., Lu L., Hu H.M., et al. Tumor-released autophagosomes induce IL-10-producing B cells with suppressive activity on T lymphocytes via TLR2-MyD88-NF-kappaB signal pathway. Oncoimmunology. 2016;5:e1180485. doi: 10.1080/2162402X.2016.1180485. - DOI - PMC - PubMed
MeSH terms
Substances
Grants and funding
LinkOut - more resources
Full Text Sources
Other Literature Sources
Research Materials
Miscellaneous
