. 2022 Nov 18;12(11):1926.
doi: 10.3390/life12111926.

Application of Machine Learning to Ranking Predictors of Anti-VEGF Response

Affiliations

Application of Machine Learning to Ranking Predictors of Anti-VEGF Response

Janan Arslan et al. Life (Basel). .

Abstract

Age-related macular degeneration (AMD) is a heterogeneous disease affecting the macula of individuals and is a cause of irreversible vision loss. Patients with neovascular AMD (nAMD) are candidates for the anti-vascular endothelial growth factor (anti-VEGF) treatment, designed to regress the growth of abnormal blood vessels in the eye. Some patients fail to maintain vision despite treatment. This study aimed to develop a prediction model based on features weighted in order of importance with respect to their impact on visual acuity (VA). Evaluations included an assessment of clinical, lifestyle, and demographic factors from patients that were treated over a period of two years. The methods included mixed-effects and relative importance modelling, and models were tested against model selection criteria, diagnostic and assumption checks, and forecasting errors. The most important predictors of an anti-VEGF response were the baseline VA of the treated eye, the time (in weeks), treatment quantity, and the treated eye. The model also ranked the impact of other variables, such as intra-retinal fluid, haemorrhage, pigment epithelium detachment, treatment drug, baseline VA of the untreated eye, and various lifestyle and demographic factors. The results identified variables that could be targeted for further investigation in support of personalised treatments based on patient data.

Keywords: age-related macular degeneration; anti-VEGF treatment; explainability; statistical modelling.


Conflict of interest statement

The authors declare no conflict of interest.

Figures

Figure 1
Figure 1
Schematic illustration of multiple imputation method (adapted from Molenberghs et al, 2015 [76]). This illustration demonstrates the imputation of an incomplete dataset. Each dataset was then analysed and the results were combined. (√) refers to imputed portions of dataset.
Figure 2
Figure 2
Schematic illustration of multiple imputation and stacked dataset method. This illustration demonstrates the imputation of an incomplete dataset five times. The imputed datasets are then “stacked” together to form one large dataset. Rather than carrying out multiple analyses and combing the results, this method allows the analysis of one single dataset. * refers to imputed portions of dataset.
Figure 3
Figure 3
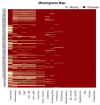
Missing map for original dataset. The map illustrates missing values across all variables tested for the treatment duration of 24 months. Those marked with dark red represent observed and available data, while the light pink represents missing data. Most of the missing information can be found in OCT derived variables. We found that treatment drug had the most missing values (35.6%), followed by haemorrhage (24.8%), and PED (20.67%).
Figure 4
Figure 4
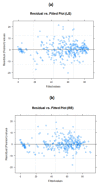
Residual versus fitted value plots. (a) LE model and (b) RE model. The residual plots appear to be evenly distributed, with no particular patterns emerging; this suggests the models are generally good fits to the data.
Figure 5
Figure 5
Normal probability plot of residuals. (a) LE model and (b) RE model. The normal probability plot of residuals appears to be generally and normally distributed, except for some deviation around the tails.
Figure 6
Figure 6
DFBETAS for LE models for all variables. Using the cut-off value of 2/n, our plot suggests that there are several potential influential points (indicated in red). However, using sigtest(),we found that the removal of the DFBETAS had no bearing on the model outcomes.
Figure 7
Figure 7
DFBETAS for RE models for all variables. Using the cut-off value of 2/n, the plots suggested that there are several potential influential points (indicated in red). However, using sigtest(), we found that the removal of the DFBETAS had no bearing on the model outcomes.
Figure 8
Figure 8
Cook’s distance for LE models for all variables. Using the cut-off value of 4/n, the plot revealed potential influential points (indicated in red). Statistical tests revealed the impacts were not significant.
Figure 9
Figure 9
Cook’s distance for RE models for all variables. Using the cut-off value of 4/n, the plot reveals potential influential points (indicated in red), but the tests revealed that there was no significant impact.
Figure 10
Figure 10
Residual versus fitted value plot. (a) LE model and (b) RE model without outliers. It is evident that the model assumptions include evenly distributed and randomly spaced plot points.
Figure 11
Figure 11
Observed versus predicted value for LE model. The plot suggests most observed and predicted values are overlapping, suggesting a good prediction technique.
Figure 12
Figure 12
Observed versus predicted value for RE model. The plot shows most observed and predicted values are overlapping, suggesting a good prediction technique.

References

    1. De Jong P.T. A Historical Analysis of the Quest for the Origins of Aging Macula Disorder, the Tissues Involved, and Its Terminology. Ophthalmol. Eye Dis. 2016;8:5–14. doi: 10.4137/OED.S40523. - DOI - PMC - PubMed
    1. Donders F.C. Beiträge zur pathologischen Anatomie des Auges [Contributions to the pathologic anatomy of the eye] Arch. Ophthalmol. 1855;1:106–118.
    1. Chakravarthy U., Harding S.P., Rogers C.A., Downes S.M., Lotery A.J., Culliford L.A., Reeves B.C. Alternative treatments to inhibit VEGF in age-related choroidal neovascularisation: 2-year findings of the IVAN randomised controlled trial. Lancet. 2013;382:1258–1267. doi: 10.1016/S0140-6736(13)61501-9. - DOI - PubMed
    1. Bora N.S., Matta B., Lyzogubov V.V., Bora P.S. Relationship between the complement system, risk factors and prediction models in age-related macular degeneration. Mol. Immunol. 2015;63:176–183. doi: 10.1016/j.molimm.2014.07.012. - DOI - PubMed
    1. Buck D.A., Dawkins R., Kawasaki R., Sandhu S.S., Allen P.J. Survey of Victorian Ophthalmologists who use ranibizumab to treat age-related macular degeneration: To identify current practice and modifiable risk factors relevant to post-injection endophthalmitis. Clin. Exp. Ophthalmol. 2014;43:277–279. doi: 10.1111/ceo.12405. - DOI - PubMed

LinkOut - more resources