. 2022 Nov 15;27(22):7903.
doi: 10.3390/molecules27227903.

Sequence-Activity Relationship of ATCUN Peptides in the Context of Alzheimer's Disease

Affiliations

Sequence-Activity Relationship of ATCUN Peptides in the Context of Alzheimer's Disease

Margot Lefèvre et al. Molecules. .

Abstract

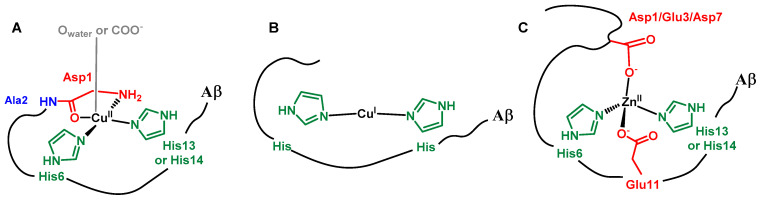
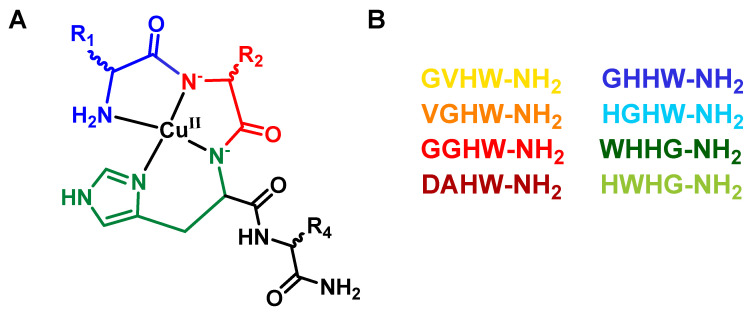
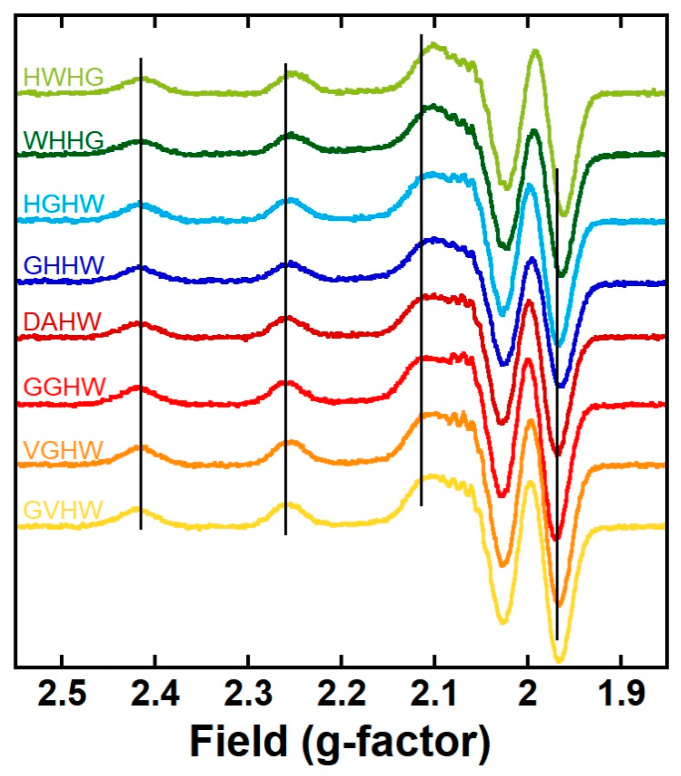
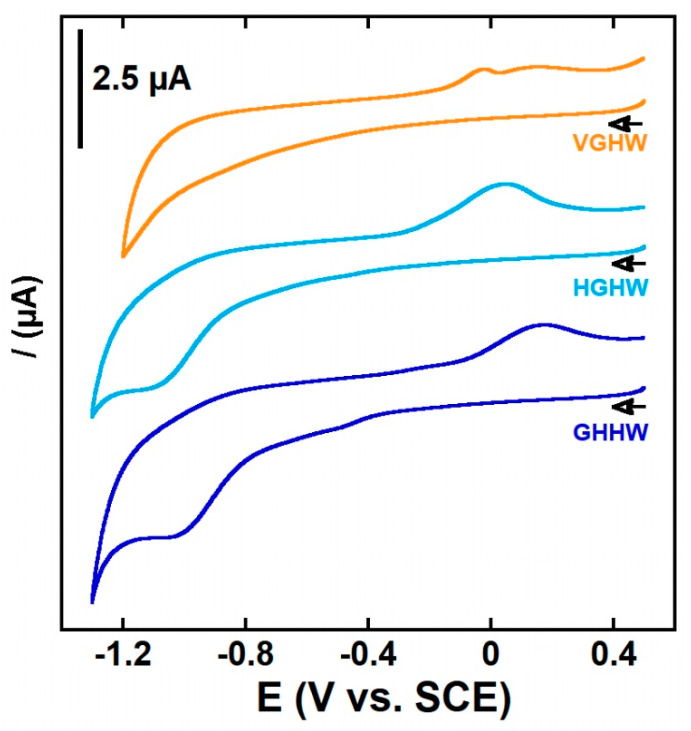
Amino-terminal CuII and NiII (ATCUN) binding sequences are widespread in the biological world. Here, we report on the study of eight ATCUN peptides aimed at targeting copper ions and stopping the associated formation of reactive oxygen species (ROS). This study was actually more focused on Cu(Aβ)-induced ROS production in which the Aβ peptide is the "villain" linked to Alzheimer's disease. The full characterization of CuII binding to the ATCUN peptides, the CuII extraction from CuII(Aβ), and the ability of the peptides to prevent and/or stop ROS formation are described in the relevant biological conditions. We highlighted in this research that all the ATCUN motifs studied formed the same thermodynamic complex but that the addition of a second histidine in position 1 or 2 allowed for an improvement in the CuII uptake kinetics. This kinetic rate was directly related to the ability of the peptide to stop the CuII(Aβ)-induced production of ROS, with the most efficient motifs being HWHG and HGHW.

Keywords: ATCUN peptide; copper; kinetics; reactive oxygen species.


Conflict of interest statement

The authors declare no conflict of interest.

Figures

Scheme 1
Scheme 1
CuII (A), CuI (B), and ZnII (C) sites in Aβ.
Scheme 2
Scheme 2
Schematic representation of the CuII(P) ATCUN coordination site (A) and sequences of the peptide studied in the present work with the color code used thereafter (B). R1-4 corresponds to the side chain of the amino acid residues; position 3 (green residue in Panel (A)) is His by definition in an ATCUN peptide.
Figure 1
Figure 1
Low-temperature (120 K) X-band EPR spectra (second derivatives of the absorption) of CuII(P): GVHW (yellow curve), VGHW (orange curve), GGHW (red curve), DAHW (dark red curve), GHHW (dark blue curve), HGHW (light blue curve), WHHG (dark green curve), and HWHG (light green curve). The grey vertical lines follow the parallel transitions for the CuII(GGHW) complex arbitrarily chosen as the internal reference. Experimental conditions: [65CuII] = 500 μM, [P] = 500 μM, [HEPES] = 50 mM, pH 7.4, 10% (v/v) glycerol as a cryoprotectant, T = 120 K, ν = 9.5 GHz, mod. ampl. = 5 G, microwave power = 5 mW.
Figure 2
Figure 2
Cyclic voltammograms of Cu(P) with P = VGHW (orange curve), GHHW (dark blue curve), and HGHW (light blue curve); arrows indicate the scanning direction. [P] = 200 μM, [CuII] = 180 μM, [HEPES] = 100 mM, pH 7.4, scan rate 100 mV/s, T = 25 °C, working electrode = glassy carbon, reference: SCE, counter-electrode: Pt wire. E (V vs. SCE) values can be converted to E (V vs. NHE) by adding 244 mV.
Figure 3
Figure 3
CuII removal from CuII(Aβ) by VGHW ((A,B) bold orange line) and GHHW ((C,D) bold blue line) followed by UV–vis (A,C) and by X-band EPR (B,D). Each panel contains spectra of CuII(Aβ) (black lines), CuII(P) (faint lines, orange for VGHW and blue for GHHW), and CuII(P) + Aβ (bold lines, orange for VGHW and blue for GHHW). The blank is also plotted in grey for the UV–vis experiments. CuII(P) + Aβ spectra were recorded after 5 min of mixing. The grey dotted vertical lines in (B,D) follow the parallel transitions of CuIIP complexes as a reference. Experimental conditions for UV–vis: [CuII] = 400 µM, [P] = [Aβ] = 450 µM, [HEPES] = 100 mM, pH 7.4, T = 25 °C; for EPR: [65CuII] = 500 µM, [P] = [Aβ] = 600 µM, [HEPES] = 50 mM, pH 7.4, 10% glycerol as cryoprotectant, T = 120 K, ν = 9.5 GHz, mod. ampl. = 5 G, microwave power = 5 mW.
Figure 4
Figure 4
Kinetics of CuII removal from CuII(Aβ) by GVHW (yellow curve), VGHW (orange curve), and GGHW (red curve) (A); DAHW (dark red curve), GHHW (dark blue curve), and WHHG (dark green curve) (B); and HGHW (light blue curve) and HWHG (light green curve) (C) followed by fluorescence. The inset in (B) is an enlargement of the time between 50 and 100 s. The CuII(Aβ) was added to a peptide solution 50 s after the beginning of the kinetic. Experimental conditions: [CuII(Aβ)] = [P] = 1 µM, [HEPES] = 100 mM, pH 7.4, T = 25 °C, λex = 280 nm and λem = 350 nm. Normalization: y = F/(Fmax-F0). In (B), the dotted gray line indicates when the time point corresponding to the fluorescence value from which the t1/2 of the CuII(ATCUN) complex formation was evaluated. This fluorescence value was arbitrarily taken in order to discard the first steps in the process of CuII removal from Cu(Aβ).
Scheme 3
Scheme 3
Possible intermediate CuII coordination modes for the eight ATCUN peptides under study: (A) intermediate 1N proposed with GGHW, VGHW, GVHW, GHHW, and WHHG peptides; (B) intermediate 2N proposed with GGHW, VGHW, and GVHW peptides on one hand and GHHW and WHHG on the other; (C) intermediate 3N proposed with GHHW and WHHG peptides; (D) intermediates 1N1O and 2N1O proposed with DAHW peptides; (E) intermediates 2N and 3N proposed with HGHW and HWHG peptides. The term “brace” indicates the formation of a metallacycle.
Figure 5
Figure 5
Kinetics of ascorbate consumption induced by Cu(Aβ) followed by UV–visible spectroscopy at 265 nm with a background correction at 800 nm starting from CuII(Aβ) with 30 s of incubation with P (A), CuII(Aβ) with 30 min incubation with P (B), CuI/II(Aβ) (C), and CuI/II(Aβ) in the presence of one equiv. of ZnII (D) using GVHW (yellow curves), VGHW (orange curves), GGHW (red curves), DAHW (dark red curves), GHHW (dark blue curves), HGHW (light blue curves), WHHG (dark green curves), and HWHG (light green curves). [P] = [Aβ] = 12 μM, [CuII] = 10 μM, [Asc] = 100 μM, [HEPES] = 100 mM, pH 7.4, T = 25 °C.
Scheme 4
Scheme 4
The three possible routes of arrest of Asc consumption as a function of the peptides in play. In pink: the “CuII path” corresponding to oxidation of CuI(Aβ) to CuII(Aβ) followed by retrieval of CuII from CuII(Aβ) by the peptides P. In blue: the “CuI path” corresponding to retrieval of CuI from CuI(Aβ) by the peptides P followed by the oxidation of the resulting CuI(P) complex to CuII(P) and its rearrangement into the CuII(ATCUN) complex. Width of the pink arrows corresponds to the kinetics of the retrieval of CuII from CuII(Aβ) by the peptides P. Length of arrows corresponds to the thermodynamic equilibria between the species.

Similar articles

Cited by

References

    1. Dementia Statistics. [(accessed on 1 July 2022)]. Available online: https://www.alzint.org/about/dementia-facts-figures/dementia-statistics/
    1. Alzheimer’s Disease: Facts & Figures. [(accessed on 1 July 2022)]. Available online: https://www.brightfocus.org/alzheimers/article/alzheimers-disease-facts-....
    1. Hampel H., Hardy J., Blennow K., Chen C., Perry G., Kim S.H., Villemagne V.L., Aisen P., Vendruscolo M., Iwatsubo T., et al. The Amyloid-β Pathway in Alzheimer’s Disease. Mol. Psychiatry. 2021;26:5481–5503. doi: 10.1038/s41380-021-01249-0. - DOI - PMC - PubMed
    1. Kametani F., Hasegawa M. Reconsideration of Amyloid Hypothesis and Tau Hypothesis in Alzheimer’s Disease. Front. Neurosci. 2018;12:25. doi: 10.3389/fnins.2018.00025. - DOI - PMC - PubMed
    1. Selkoe D.J., Hardy J. The amyloid hypothesis of Alzheimer’s disease at 25 years. EMBO Mol. Med. 2016;8:595–608. doi: 10.15252/emmm.201606210. - DOI - PMC - PubMed