

Molecular Characterization of an Isoflavone 2'-Hydroxylase Gene Revealed Positive Insights into Flavonoid Accumulation and Abiotic Stress Tolerance in Safflower
- PMID: 36432102
- PMCID: PMC9697648
- DOI: 10.3390/molecules27228001
Molecular Characterization of an Isoflavone 2'-Hydroxylase Gene Revealed Positive Insights into Flavonoid Accumulation and Abiotic Stress Tolerance in Safflower
Abstract
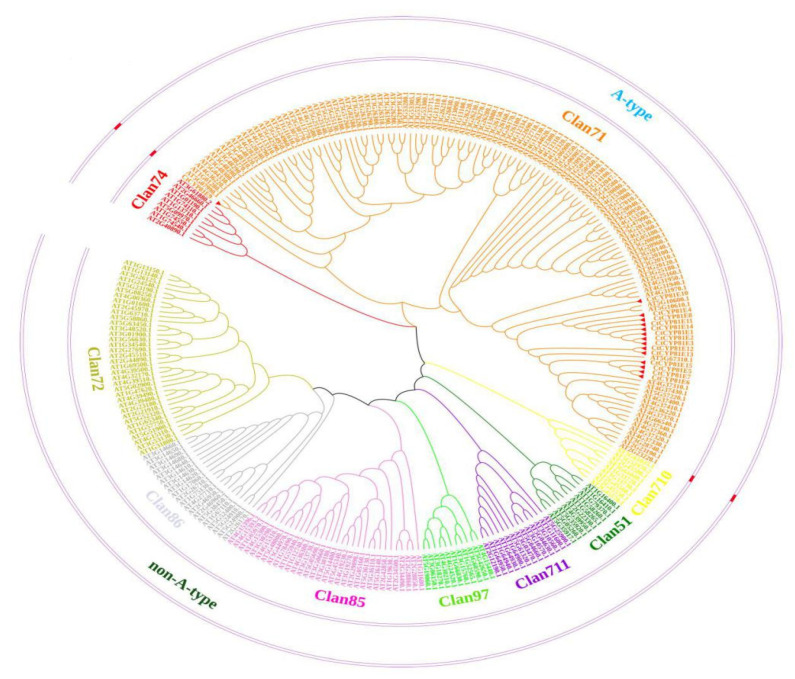
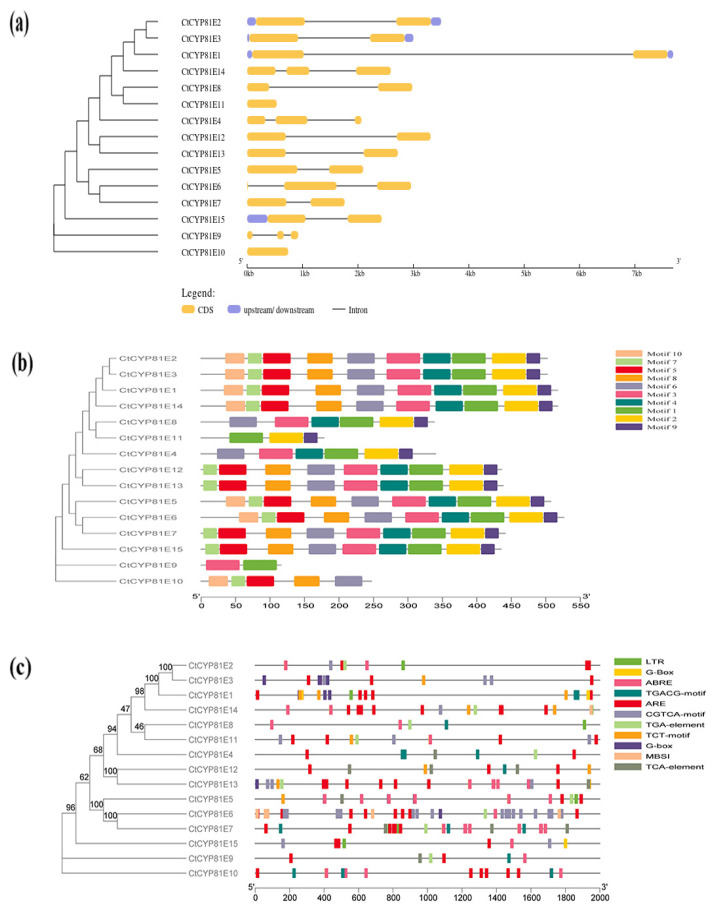
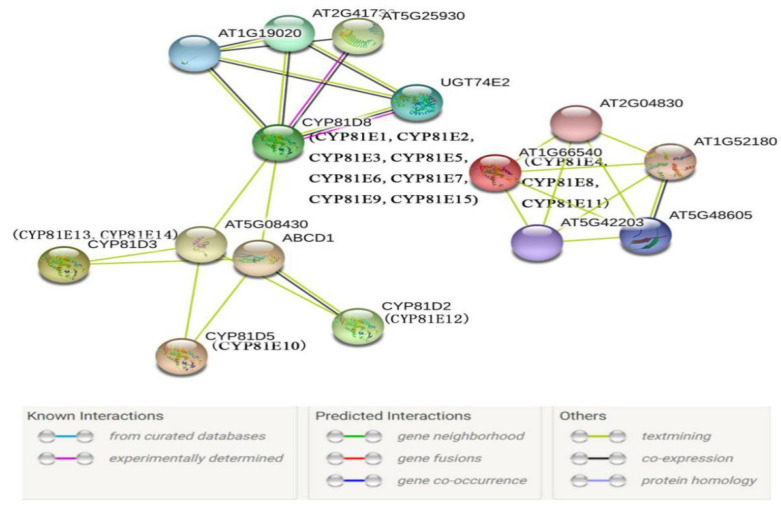
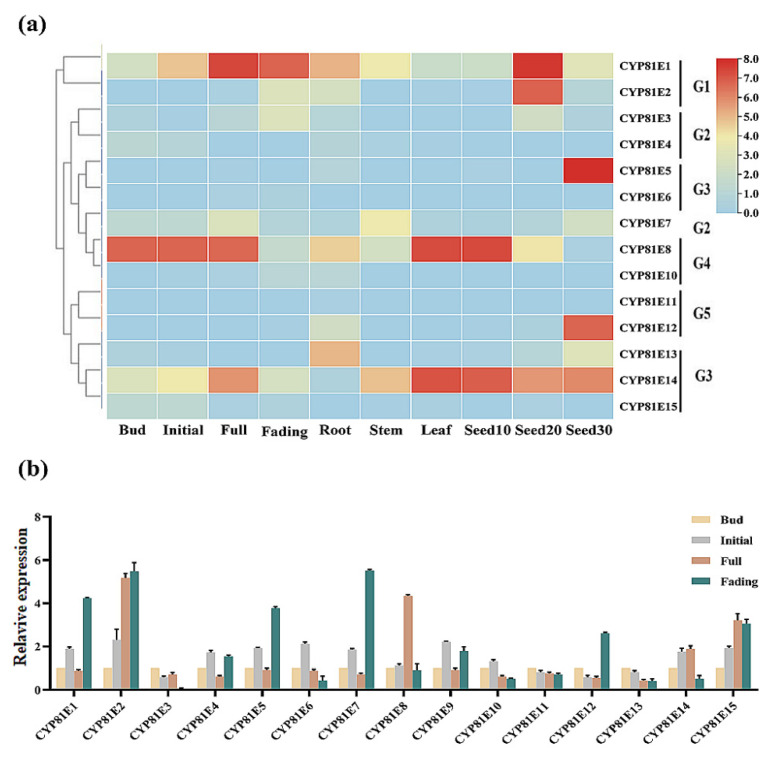
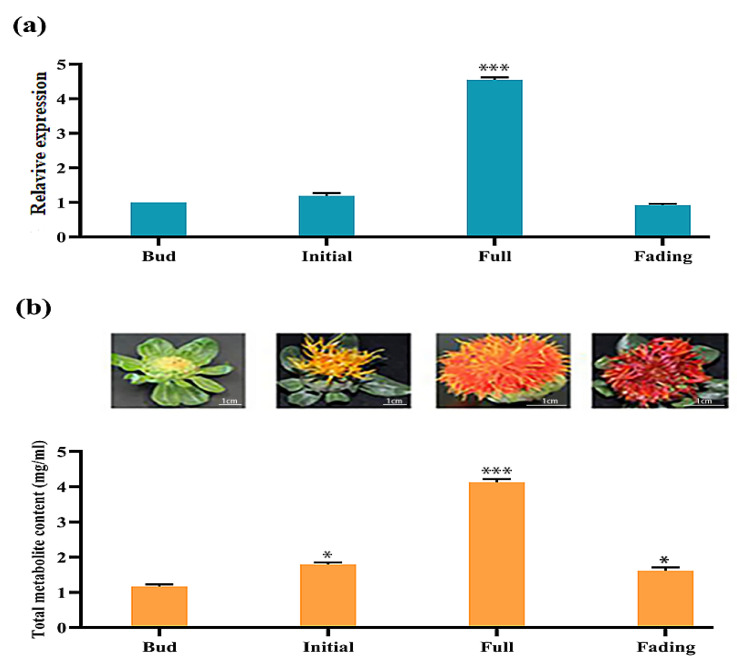
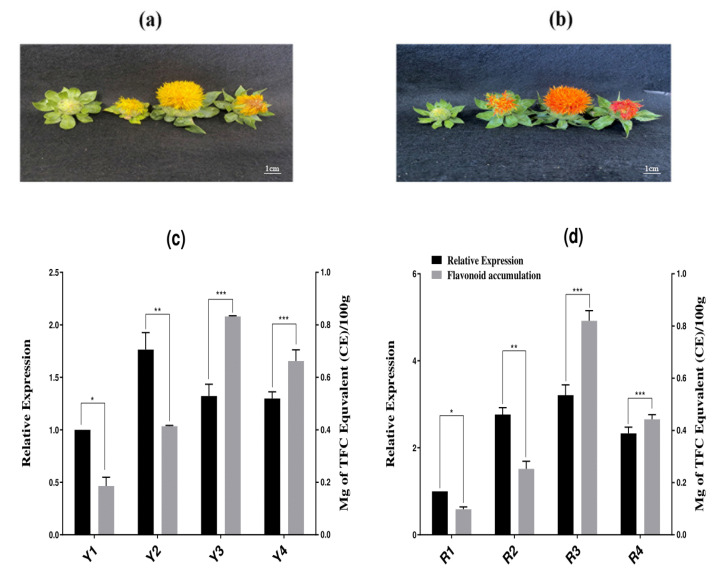
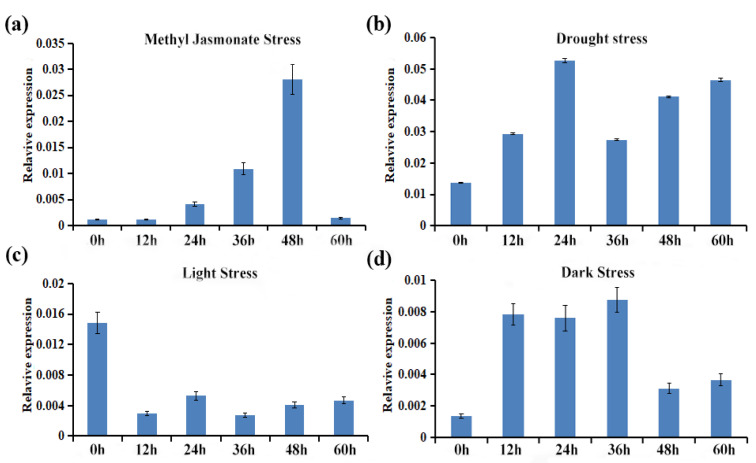
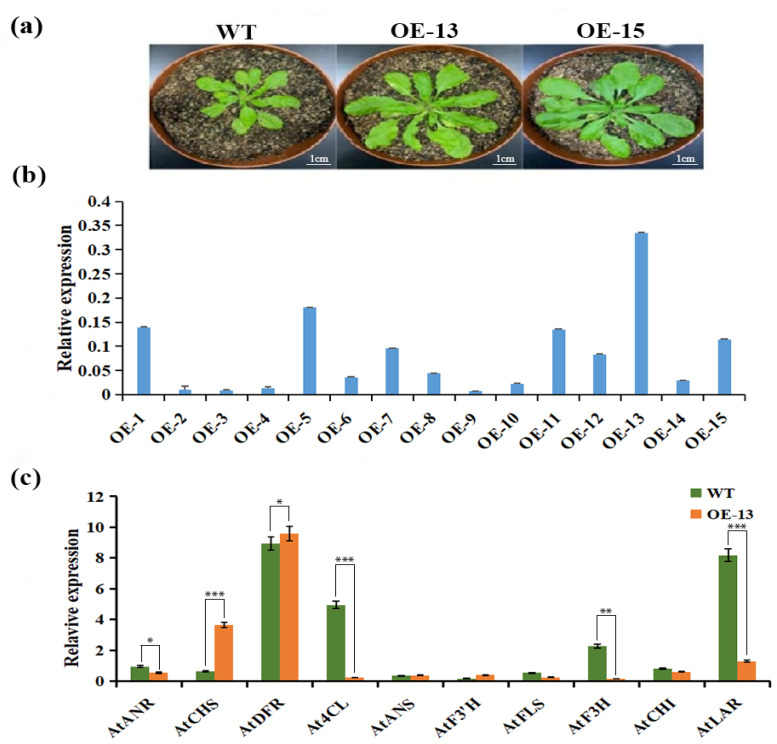
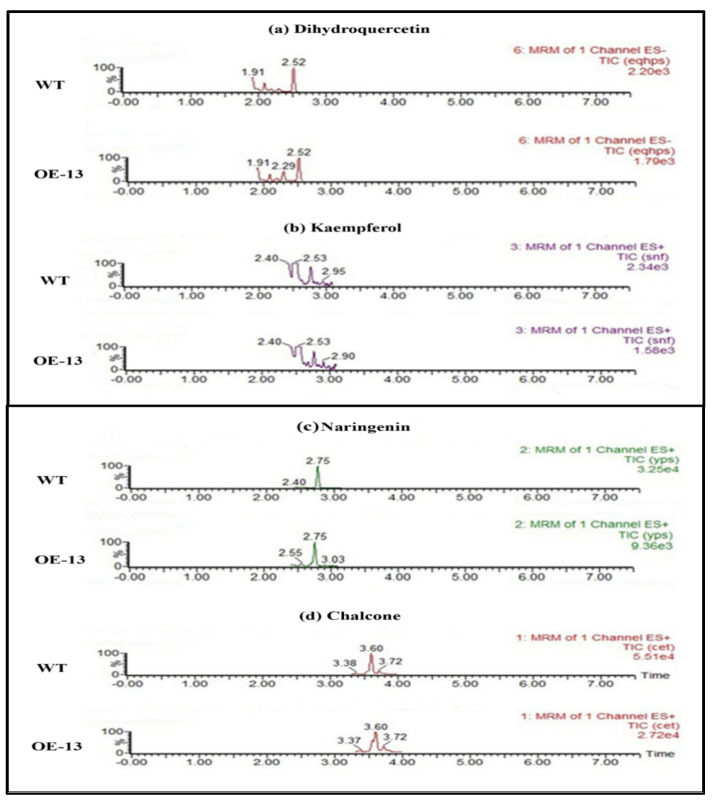
Flavonoids with significant therapeutic properties play an essential role in plant growth, development, and adaptation to various environments. The biosynthetic pathway of flavonoids has long been studied in plants; however, its regulatory mechanism in safflower largely remains unclear. Here, we carried out comprehensive genome-wide identification and functional characterization of a putative cytochrome P45081E8 gene encoding an isoflavone 2'-hydroxylase from safflower. A total of 15 CtCYP81E genes were identified from the safflower genome. Phylogenetic classification and conserved topology of CtCYP81E gene structures, protein motifs, and cis-elements elucidated crucial insights into plant growth, development, and stress responses. The diverse expression pattern of CtCYP81E genes in four different flowering stages suggested important clues into the regulation of secondary metabolites. Similarly, the variable expression of CtCYP81E8 during multiple flowering stages further highlighted a strong relationship with metabolite accumulation. Furthermore, the orchestrated link between transcriptional regulation of CtCYP81E8 and flavonoid accumulation was further validated in the yellow- and red-type safflower. The spatiotemporal expression of CtCYP81E8 under methyl jasmonate, polyethylene glycol, light, and dark conditions further highlighted its likely significance in abiotic stress adaption. Moreover, the over-expressed transgenic Arabidopsis lines showed enhanced transcript abundance in OE-13 line with approximately eight-fold increased expression. The upregulation of AtCHS, AtF3'H, and AtDFR genes and the detection of several types of flavonoids in the OE-13 transgenic line also provides crucial insights into the potential role of CtCYP81E8 during flavonoid accumulation. Together, our findings shed light on the fundamental role of CtCYP81E8 encoding a putative isoflavone 2'-hydroxylase via constitutive expression during flavonoid biosynthesis.
Keywords: CYP81E8; constitutive expression; flavonoid biosynthesis; isoflavone 2′-hydroxylase; safflower; transgenic Arabidopsis.
Conflict of interest statement
The authors declare no conflict of interest.
Figures
Similar articles
-
Safflower Flavonoid 3'5'Hydroxylase Promotes Methyl Jasmonate-Induced Anthocyanin Accumulation in Transgenic Plants.Molecules. 2023 Apr 4;28(7):3205. doi: 10.3390/molecules28073205. Molecules. 2023. PMID: 37049967 Free PMC article.
-
Unraveling the functional characterization of a jasmonate-induced flavonoid biosynthetic CYP45082G24 gene in Carthamus tinctorius.Funct Integr Genomics. 2023 May 22;23(2):172. doi: 10.1007/s10142-023-01110-3. Funct Integr Genomics. 2023. PMID: 37212893
-
Molecular characterization of flavanone 3-hydroxylase gene and flavonoid accumulation in two chemotyped safflower lines in response to methyl jasmonate stimulation.BMC Plant Biol. 2016 Jun 10;16(1):132. doi: 10.1186/s12870-016-0813-5. BMC Plant Biol. 2016. PMID: 27286810 Free PMC article.
-
Comprehensive review of two groups of flavonoids in Carthamus tinctorius L.Biomed Pharmacother. 2022 Sep;153:113462. doi: 10.1016/j.biopha.2022.113462. Epub 2022 Aug 1. Biomed Pharmacother. 2022. PMID: 36076573 Review.
-
Research Progress of Genomics Applications in Secondary Metabolites of Medicinal Plants: A Case Study in Safflower.Int J Mol Sci. 2025 Apr 19;26(8):3867. doi: 10.3390/ijms26083867. Int J Mol Sci. 2025. PMID: 40332590 Free PMC article. Review.
Cited by
-
Evaluating the influence of straw mulching and intercropping on nitrogen uptake, crop growth, and yield performance in maize and soybean.Front Plant Sci. 2023 Oct 13;14:1280382. doi: 10.3389/fpls.2023.1280382. eCollection 2023. Front Plant Sci. 2023. PMID: 37900744 Free PMC article.
-
GmHXK2 promotes the salt tolerance of soybean seedlings by mediating AsA synthesis, and auxin synthesis and distribution.BMC Plant Biol. 2024 Jun 27;24(1):613. doi: 10.1186/s12870-024-05301-3. BMC Plant Biol. 2024. PMID: 38937682 Free PMC article.
-
Comparative Transcriptome Analysis Reveals the Protective Role of Melatonin during Salt Stress by Regulating the Photosynthesis and Ascorbic Acid Metabolism Pathways in Brassica campestris.Int J Mol Sci. 2024 May 7;25(10):5092. doi: 10.3390/ijms25105092. Int J Mol Sci. 2024. PMID: 38791131 Free PMC article.
-
Genetic modification strategies for enhancing plant resilience to abiotic stresses in the context of climate change.Funct Integr Genomics. 2023 Aug 29;23(3):283. doi: 10.1007/s10142-023-01202-0. Funct Integr Genomics. 2023. PMID: 37642792 Review.
-
Combined analysis of metagenome and transcriptome revealed the adaptive mechanism of different golden Camellia species in karst regions.Front Plant Sci. 2023 Nov 20;14:1180472. doi: 10.3389/fpls.2023.1180472. eCollection 2023. Front Plant Sci. 2023. PMID: 38078115 Free PMC article.
References
-
- Chinese Pharmacopoeia Commission . Pharmacopoeia of the People’s Republic of China. Beijing Chemical Industry Press; Beijing, China: 2015. pp. 188–189. Part 1.
-
- Qu C., Wang L.-Y., Jin W.-T., Tang Y.-P., Jin Y., Shi X.-Q., Shang L.-L., Shang E.-X., Duan J.-A. Comparative analysis of the effects of Hydroxysafflor yellow a and Anhydrosafflor yellow B in safflower series of herb pairs using prep-HPLC and a selective knock-out approach. Molecules. 2016;21:1480. doi: 10.3390/molecules21111480. - DOI - PMC - PubMed
MeSH terms
Substances
Grants and funding
LinkOut - more resources
Full Text Sources
Miscellaneous
