

Investigation of Aggregation and Disaggregation of Self-Assembling Nano-Sized Clusters Consisting of Individual Iron Oxide Nanoparticles upon Interaction with HEWL Protein Molecules
- PMID: 36432246
- PMCID: PMC9696017
- DOI: 10.3390/nano12223960
Investigation of Aggregation and Disaggregation of Self-Assembling Nano-Sized Clusters Consisting of Individual Iron Oxide Nanoparticles upon Interaction with HEWL Protein Molecules
Abstract
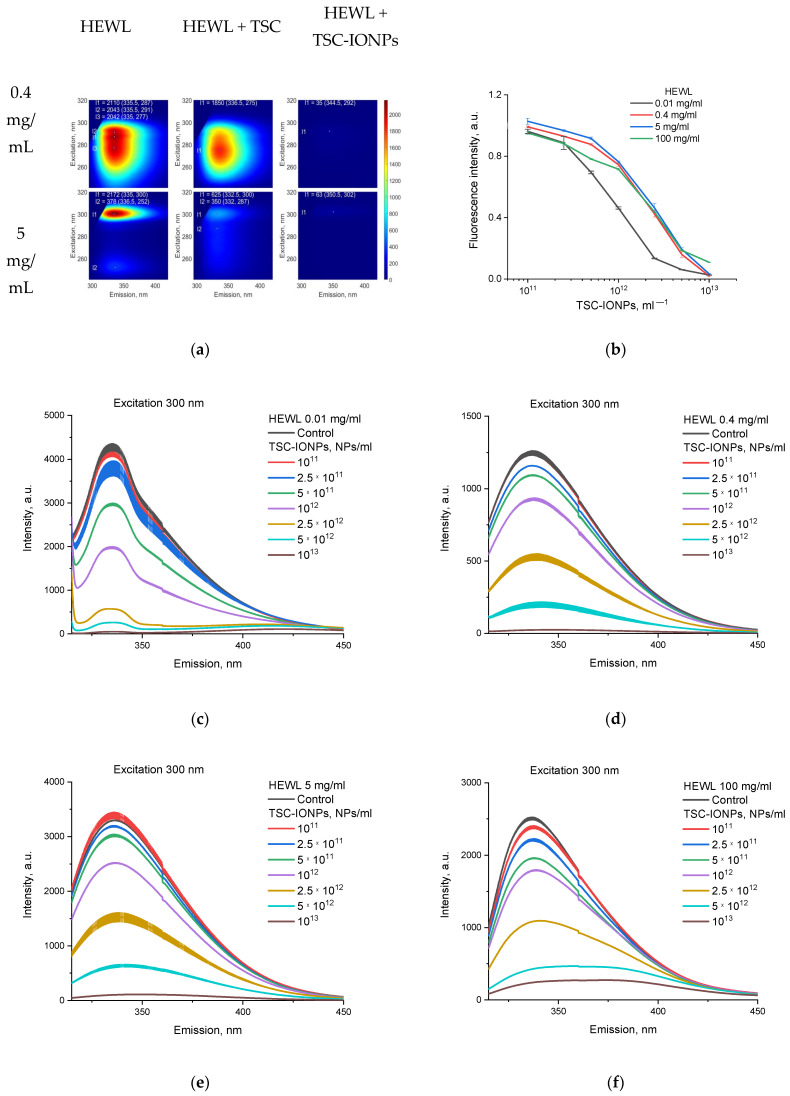
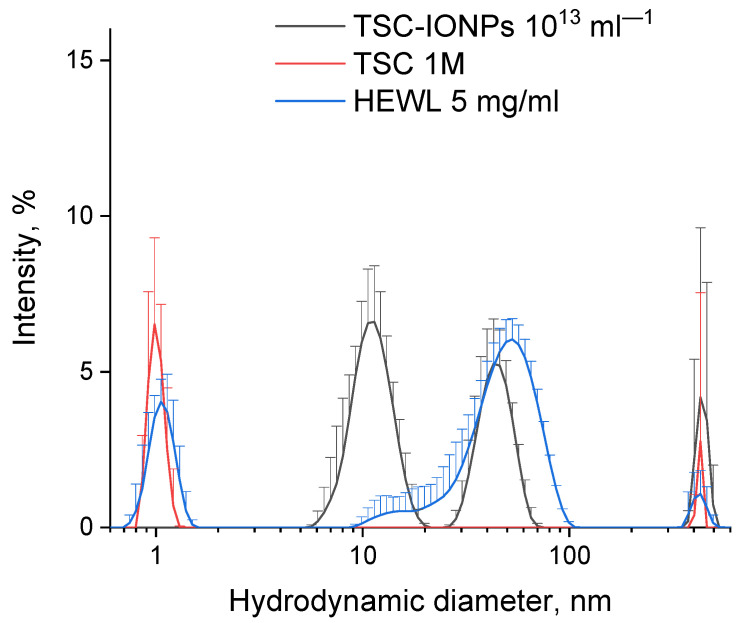
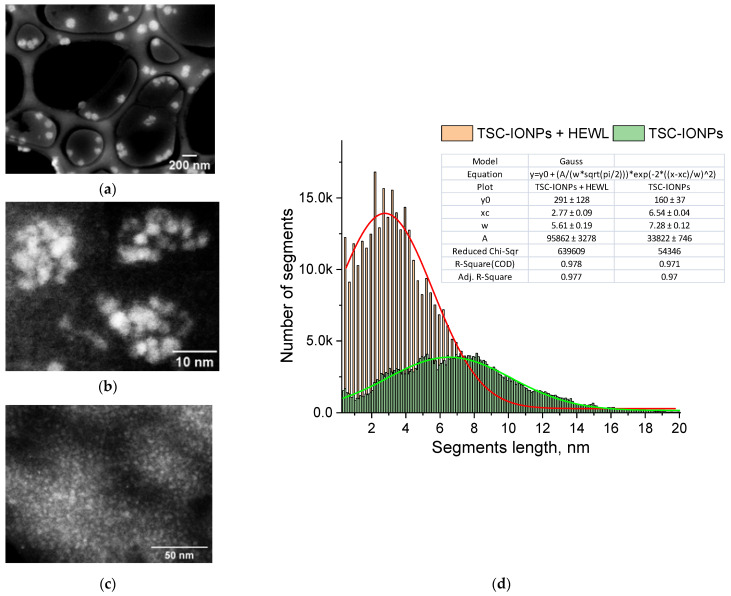
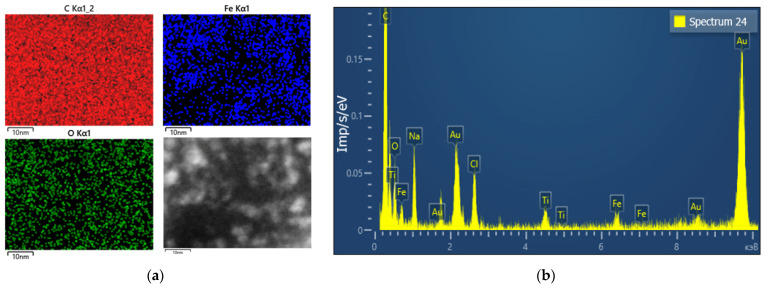
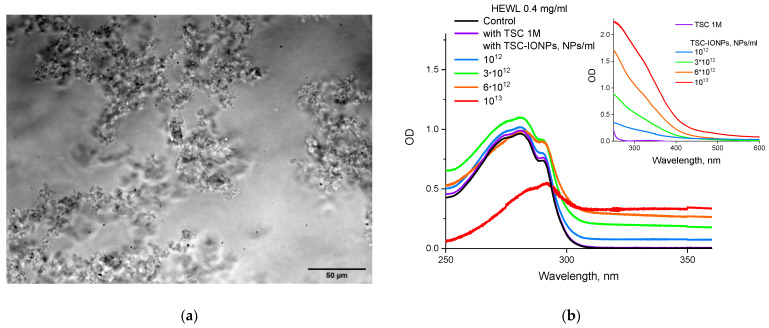
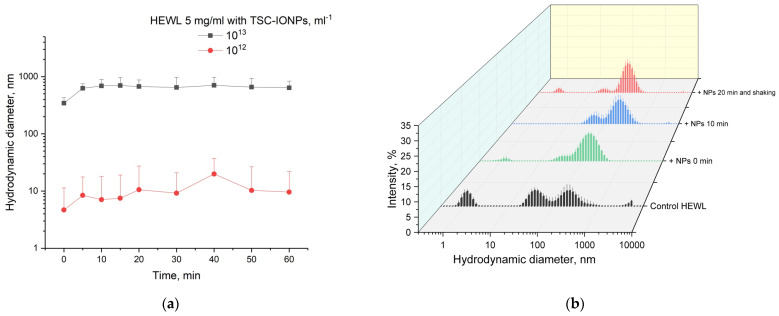
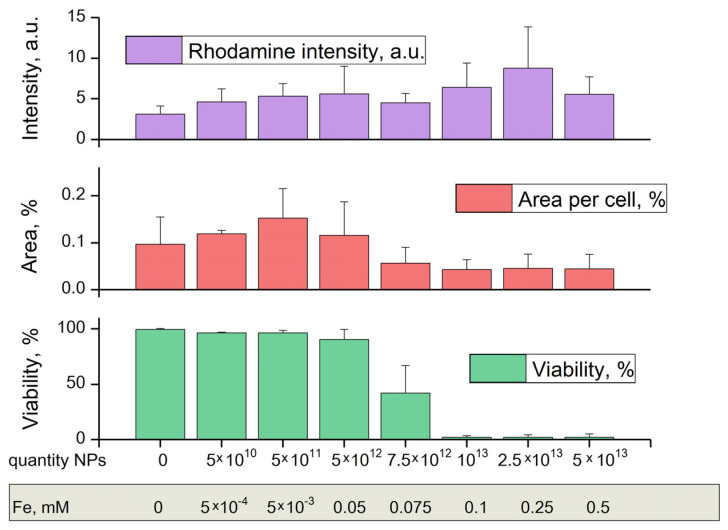
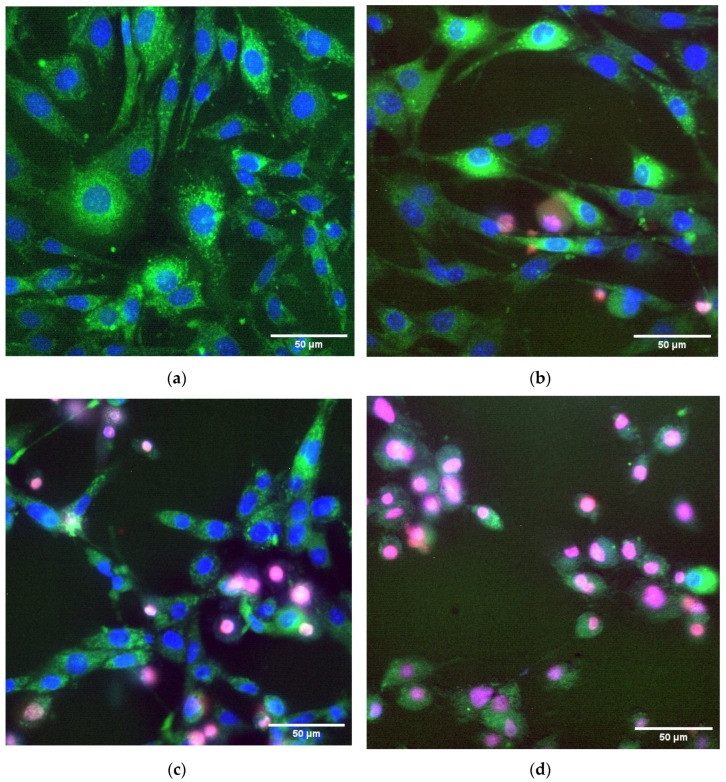
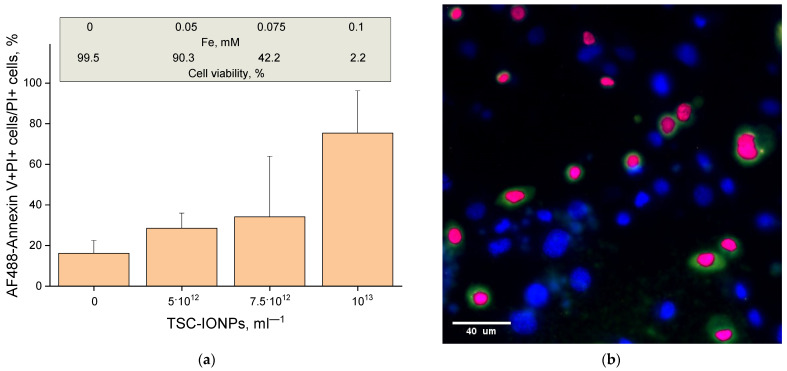
In this paper, iron oxide nanoparticles coated with trisodium citrate were obtained. Nanoparticles self-assembling stable clusters were ~10 and 50-80 nm in size, consisting of NPs 3 nm in size. The stability was controlled by using multi-angle dynamic light scattering and the zeta potential, which was -32 ± 2 mV. Clusters from TSC-IONPs can be destroyed when interacting with a hen egg-white lysozyme. After the destruction of the nanoparticles and proteins, aggregates are formed quickly, within 5-10 min. Their sizes depend on the concentration of the lysozyme and nanoparticles and can reach micron sizes. It is shown that individual protein molecules can be isolated from the formed aggregates under shaking. Such aggregation was observed by several methods: multi-angle dynamic light scattering, optical absorption, fluorescence spectroscopy, TEM, and optical microscopy. It is important to note that the concentrations of NPs at which the protein aggregation took place were also toxic to cells. There was a sharp decrease in the survival of mouse fibroblasts (Fe concentration ~75-100 μM), while the ratio of apoptotic to all dead cells increased. Additionally, at low concentrations of NPs, an increase in cell size was observed.
Keywords: aggregation; fibroblast cell viability; hen egg-white lysozyme; toxicity; trisodium citrate–coated iron oxide nanoparticles.
Conflict of interest statement
The authors declare no conflict of interest.
Figures


Similar articles
-
Counter ion induced irreversible denaturation of hen egg white lysozyme upon electrostatic interaction with iron oxide nanoparticles: a predicted model.Colloids Surf B Biointerfaces. 2013 Mar 1;103:267-74. doi: 10.1016/j.colsurfb.2012.10.034. Epub 2012 Oct 30. Colloids Surf B Biointerfaces. 2013. PMID: 23201747
-
Protein nanoparticle electrostatic interaction: size dependent counterions induced conformational change of hen egg white lysozyme.Colloids Surf B Biointerfaces. 2014 Jun 1;118:1-6. doi: 10.1016/j.colsurfb.2014.03.026. Epub 2014 Mar 24. Colloids Surf B Biointerfaces. 2014. PMID: 24704636
-
Assessing safety and protein interactions of surface-modified iron oxide nanoparticles for potential use in biomedical areas.Colloids Surf B Biointerfaces. 2017 Jun 1;154:408-420. doi: 10.1016/j.colsurfb.2017.03.050. Epub 2017 Mar 29. Colloids Surf B Biointerfaces. 2017. PMID: 28388527
-
How the surface functionalized nanoparticles affect conformation and activity of proteins: Exploring through protein-nanoparticle interactions.Bioorg Chem. 2019 Feb;82:17-25. doi: 10.1016/j.bioorg.2018.09.020. Epub 2018 Sep 15. Bioorg Chem. 2019. PMID: 30267970
-
pH-Dependent HEWL-AuNPs Interactions: Optical Study.Molecules. 2023 Dec 22;29(1):82. doi: 10.3390/molecules29010082. Molecules. 2023. PMID: 38202662 Free PMC article.
Cited by
-
Photocatalytic degradation of reactive black 5 from synthetic and real wastewater under visible light with TiO2 coated PET photocatalysts.Sci Rep. 2025 Apr 24;15(1):14314. doi: 10.1038/s41598-025-95091-x. Sci Rep. 2025. PMID: 40274880 Free PMC article.
-
The Development of New Nanocomposite Polytetrafluoroethylene/Fe2O3 NPs to Prevent Bacterial Contamination in Meat Industry.Polymers (Basel). 2022 Nov 12;14(22):4880. doi: 10.3390/polym14224880. Polymers (Basel). 2022. PMID: 36433009 Free PMC article.
-
Diversity of Effects of Mechanical Influences on Living Systems and Aqueous Solutions.Int J Mol Sci. 2025 Jun 10;26(12):5556. doi: 10.3390/ijms26125556. Int J Mol Sci. 2025. PMID: 40565019 Free PMC article. Review.
-
Heavy Metal Nanoparticle Detection in Human and Formula Milk.Foods. 2024 Oct 6;13(19):3178. doi: 10.3390/foods13193178. Foods. 2024. PMID: 39410213 Free PMC article.
-
Investigation of TiO2 nanoparticle interactions in the fibroblast NIH-3T3 cells via liquid-mode atomic force microscope.Arch Toxicol. 2023 Nov;97(11):2893-2901. doi: 10.1007/s00204-023-03585-2. Epub 2023 Aug 23. Arch Toxicol. 2023. PMID: 37612376
References
-
- Harish V., Tewari D., Gaur M., Yadav A.B., Swaroop S., Bechelany M., Barhoum A. Review on Nanoparticles and Nanostructured Materials: Bioimaging, Biosensing, Drug Delivery, Tissue Engineering, Antimicrobial, and Agro-Food Applications. Nanomaterials. 2022;12:457. doi: 10.3390/nano12030457. - DOI - PMC - PubMed
-
- Khomutov G.B. NATO Security through Science Series C: Environmental Security. Springer; Bonn, Germany: 2008. DNA-based synthesis and assembly of organized iron oxide nanostructures; pp. 39–57. - DOI
Grants and funding
LinkOut - more resources
Full Text Sources
