

Highly Bright Gold Nanowires Arrays for Sensitive Detection of Urea and Urease
- PMID: 36432310
- PMCID: PMC9698401
- DOI: 10.3390/nano12224023
Highly Bright Gold Nanowires Arrays for Sensitive Detection of Urea and Urease
Abstract
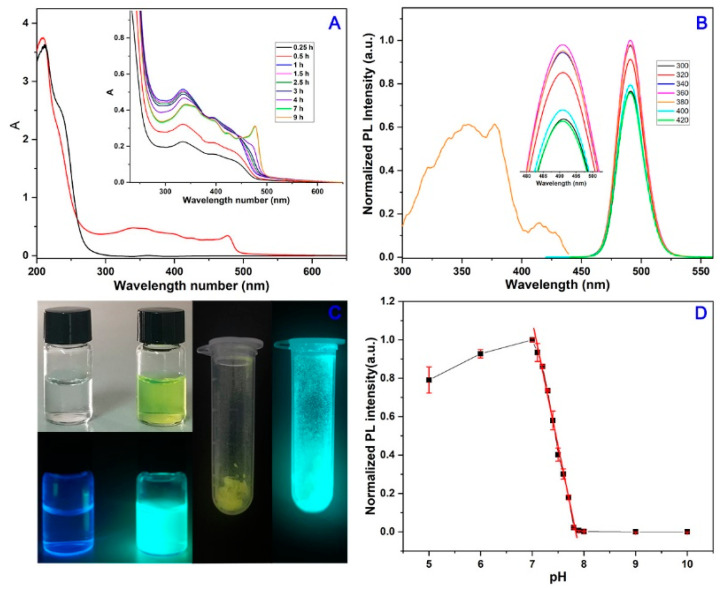
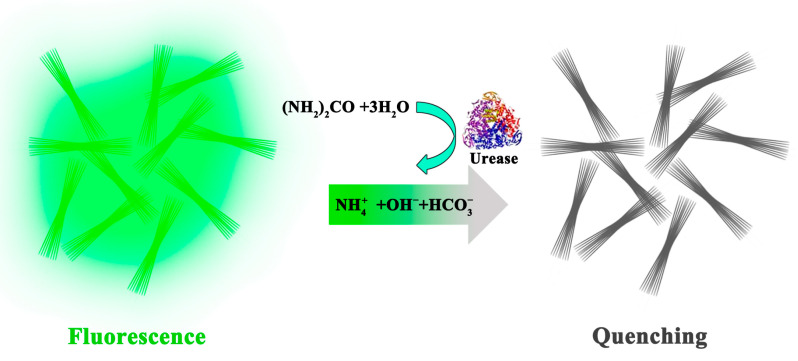
In this work, highly fluorescent gold nanowire arrays (Au NWs) are successfully synthesized by assembling Zn2+ ions and non-emissive oligomeric gold-thiolate clusters using mercaptopropionic acid both as a reducing agent and a growth ligand. The synthesized Au NWs exhibited strong bluish green fluorescence with an absolute quantum yield up to 32% and possessed ultrasensitive pH stimuli-responsive performance in the range of 7.0-7.8. Based on the excellent properties of the as-prepared nanowire arrays, we developed a facile, sensitive, and selective fluorescent method for quantitative detection of urea and urease. The fabricated nanoprobe showed superior biosensing response characteristics with good linearities in the range of 0-100 μM for urea concentration and 0-12 U/L for urease activity. In addition, this fluorescent probe afforded relatively high sensitivity with the detection limit as low as 2.1 μM and 0.13 U/L for urea and urease, respectively. Urea in human urine and urease in human serum were detected with satisfied results, exhibiting a promising potential for biomedical application.
Keywords: assembly induced emission; enhanced fluorescence; gold nanowire arrays; self-assembly; urea and urease.
Conflict of interest statement
The authors declare no conflict of interest.
Figures


Similar articles
-
Self-Referenced Ratiometric Detection of Sulfatase Activity with Dual-Emissive Urease-Encapsulated Gold Nanoclusters.ACS Sens. 2019 Feb 22;4(2):344-352. doi: 10.1021/acssensors.8b01130. Epub 2019 Jan 29. ACS Sens. 2019. PMID: 30652857
-
pH-induced highly sensitive fluorescence detection of urea and urease based on carbon dots-based nanohybrids.Spectrochim Acta A Mol Biomol Spectrosc. 2022 Mar 15;269:120705. doi: 10.1016/j.saa.2021.120705. Epub 2021 Dec 3. Spectrochim Acta A Mol Biomol Spectrosc. 2022. PMID: 34922286
-
Colorimetric detection of urea, urease, and urease inhibitor based on the peroxidase-like activity of gold nanoparticles.Anal Chim Acta. 2016 Apr 7;915:74-80. doi: 10.1016/j.aca.2016.02.008. Epub 2016 Feb 12. Anal Chim Acta. 2016. PMID: 26995642
-
pH-Sensitive gold nanoclusters: preparation and analytical applications for urea, urease, and urease inhibitor detection.Chem Commun (Camb). 2015 May 7;51(37):7847-50. doi: 10.1039/c5cc00702j. Chem Commun (Camb). 2015. PMID: 25854314
-
Gold nanoclusters Cys-Au NCs as selective fluorescent probes for "on-off-on" detection of Fe3+ and ascorbic acid.RSC Adv. 2023 Mar 7;13(11):7425-7431. doi: 10.1039/d3ra00410d. eCollection 2023 Mar 1. RSC Adv. 2023. PMID: 36895769 Free PMC article.
Cited by
-
Fluorescent Probe for the pH-Independent Rapid and Sensitive Direct Detection of Urease-Producing Bacteria.Anal Chem. 2024 Dec 31;96(52):20578-20586. doi: 10.1021/acs.analchem.4c05182. Epub 2024 Dec 16. Anal Chem. 2024. PMID: 39679657 Free PMC article.
References
Grants and funding
LinkOut - more resources
Full Text Sources
