. 2022 Nov 14;14(22):4818.
doi: 10.3390/nu14224818.

Gut Microbiota Associated with Gestational Health Conditions in a Sample of Mexican Women

Affiliations

Gut Microbiota Associated with Gestational Health Conditions in a Sample of Mexican Women

Tizziani Benítez-Guerrero et al. Nutrients. .

Abstract

Gestational diabetes (GD), pre-gestational diabetes (PD), and pre-eclampsia (PE) are morbidities affecting gestational health which have been associated with dysbiosis of the mother's gut microbiota. This study aimed to assess the extent of change in the gut microbiota diversity, short-chain fatty acids (SCFA) production, and fecal metabolites profile in a sample of Mexican women affected by these disorders. Fecal samples were collected from women with GD, PD, or PE in the third trimester of pregnancy, along with clinical and biochemical data. Gut microbiota was characterized by high-throughput DNA sequencing of V3-16S rRNA gene libraries; SCFA and metabolites were measured by High-Pressure Liquid Chromatography (HPLC) and (Fourier Transform Ion Cyclotron Mass Spectrometry (FT-ICR MS), respectively, in extracts prepared from feces. Although the results for fecal microbiota did not show statistically significant differences in alfa diversity for GD, PD, and PE concerning controls, there was a difference in beta diversity for GD versus CO, and a high abundance of Proteobacteria, followed by Firmicutes and Bacteroidota among gestational health conditions. DESeq2 analysis revealed bacterial genera associated with each health condition; the Spearman's correlation analyses showed selected anthropometric, biochemical, dietary, and SCFA metadata associated with specific bacterial abundances, and although the HPLC did not show relevant differences in SCFA content among the studied groups, FT-ICR MS disclosed the presence of interesting metabolites of complex phenolic, valeric, arachidic, and caprylic acid nature. The major conclusion of our work is that GD, PD, and PE are associated with fecal bacterial microbiota profiles, with distinct predictive metagenomes.

Keywords: Bruker Solarix XR; FT ICR MS; fecal microbiota; gestational diabetes; gut microbiota; high-throughput DNA sequencing; mother feces; pre-eclampsia; pre-gestational diabetes.


Conflict of interest statement

The authors declare no conflict of interest. The funders had no role in the design of the study; in the collection, analyses, or interpretation of data; in the writing of the manuscript, or in the decision to publish the results.

Figures

Figure 1
Figure 1
Characterization of the bacterial diversity in the different studied samples. (A) Alpha diversity box plots. The Y-axes indicate the values for the species richness indexes (Chao1, ACE), and diversity indexes (Shannon, Simpson, InvSimpson, and Fisher). The type of sample is shown on the right. Supplementary Material—(see Supplementary Materials Table S2 for numerical data of indexes). (B) Beta diversity Non-Metric Multidimensional Scaling (NMDS) scatter plots. The graphics show bacterial beta diversity calculated by NMDS ordination based on the UniFrac distance matrix. The scatter plots were generated in R. The samples CO and GD differed significantly according to ANOSIM (p = 0.01). (C) Bacterial Phyla relative abundance stacked bar plots. Color sectors indicate taxa as denoted by tags at the bottom of the figure; abundances are shown as a percentage on the X-axis. The type of sample is shown on the left side of the figure. The graphic shows the four top more abundant phyla, while “Other” includes phyla with <1% relative abundance—(see Supplementary Materials for numerical data abundances and statistical test for CO versus GD, Table S3; CO versus PD, Table S4, and CO versus PE, Table S5). PE (Pre-Eclampsia), PD (Pre-gestational Diabetes), GD (Gestational Diabetes), and CO (Control).
Figure 2
Figure 2
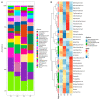
Relative abundances of bacterial genera in the studied samples. (A) Stacked bar plots with relative abundances of bacteria. Color sectors indicate taxa as indicated by tags at the right side of the figure; abundances are shown as percentages on the Y-axis. The graphic shows the twenty-six topmost abundant genera, while “Other” group genera with <1% relative abundance—(see Supplementary Materials for numerical data abundance and statistical test for CO versus GD, Table S6; CO versus PD, Table S7, and CO versus PE, Table S8). (B) Core microbiota heatmap among samples. Columns show the abundance of core microbiota members with a prevalence of at least 50% in the samples and an abundance ≥1%. The color scale from blue (−2) to red (2) indicates the relative abundance normalized from the core taxa of groups. Color keys for phyla are shown on the left side of the figure. NK4A136 (Lachnospiraceae), UCG-001 (Prevotellaceae), Escherichia (Escherichia-Shigella), Allorhizobium (Allorhizobium-Neorhizobium-Pararhizobium-Rhizobium), Methylobacterium (Methylobacterium-Methylorubrum), Clostridium_1 (Clostridium_sensu_stricto_1). The type of sample is indicated at the bottom of the figure, where PE (Pre-Eclampsia), PD (Pre-gestational Diabetes), GD (Gestational Diabetes), and CO (Control).
Figure 3
Figure 3
Differential abundance analysis of bacterial genera with DESeq2. The Figure shows data for (A) CO vs. GD, (B) CO vs. PD, and (C) CO vs. PE. Normalization was made with size factor from counts geometric means and the Wald test was applied to calculate differences between groups, False Discovery Rate (FDR) was used to correct p-values. Log2 Fold Change is shown by the horizontal bars. Bacterial taxa with q values <0.05 are written alongside the Y-axis. Phyla are shown with a black solid circle (Actinobacteriota), black solid triangle (Bacteroidota), black solid square (Cyanobacteria), plus symbol (Firmicutes), and cross symbol (Proteobacteria) at the bottom. The repetition of symbols indicates that more than one ASV was reported in the analyses. UCG-014 (Class Clostridia), Clostridium_1 (Clostridium_sensu_stricto_1), uncultured (Oscillospiraceae), UCG-002 (Oscillospiraceae), UBA1819 (Oscillospiraceae), NK4A136 (Lachnospiraceae), halli_group (Eubacterium). —(see Supplementary Materials for full taxon description, log2FoldChange, p, and p-adjusted values for CO versus GD, Table S9; CO versus PDF, Table S10, and CO versus PE, Table S11).
Figure 4
Figure 4
Spearman correlation analysis of clinical data and other variables with bacterial abundance. Anthropometric and clinical for CO (A), and GD (B); dietary for CO (C) and GD (D), and SCFA for CO (E) and GD (F). Columns in the heatmaps show the bacterial taxa, while rows show the numerical metadata. The correlation is measured by the color key from blue (−1, negative) to red (+1, positive). The plus symbol “+” denotes a significance of p < 0.001. vadinBB60 (Class Clostridia); UCG001 (Prevotellaceae); NK4A136 (Lachnospiraceae), Clostridium_1 (Clostridium_sensu_stricto_1), Escherichia (Escherichia-Shigella).
Figure 5
Figure 5
Prediction of functional microbial metabolic pathways using PICRUSt 2 analysis with the MetaCyc database. The graphics show the abundance of (A) thirteen statistically significant metabolic pathways between CO (blue color) and GD (red color) bacterial communities. (B) Twenty-seven statistically significant metabolic pathways between CO (blue color) and PD (green color) bacterial communities; and (C) one statistically significant metabolic pathway between CO (blue color) and PE (orange color) bacterial communities. Confidence intervals are indicated on top, while the mean proportions and differences in mean proportions with percentage scale are shown underneath each graphic. Groups are identified by a tab placed below the graphics. A Welch test was applied with a Bonferroni post-hoc. Corrected p-values are shown on the right side of each graphic. —(see Supplementary Materials Table S12 for all included statistically significant pathways q < 0.05).
Figure 6
Figure 6
Analysis of metabolites in fecal samples by FT-ICR MS. Metabolites extracted from fecal samples were analyzed using a Fourier Transform Ion Cyclotron Resonance Mass Spectrophotometer (Solarix XR Bruker) calibrated in positive mode for CO versus GD (A), CO versus PD (B), CO versus PE (C), and negative mode for CO versus GD (D), CO versus PD (E), and CO versus PE (F) see Materials and Methods. For each graphic, the PC1, PC2, and PC3 axes indicate the PCA ordination as a percentage of the total variance explained. The red color is the m/z values and the lines with conic tips represent the samples that are identified by tags.

References

    1. Thursby E., Juge N. Introduction to the Human Gut Microbiota. Biochem. J. 2017;474:1823–1836. doi: 10.1042/BCJ20160510. - DOI - PMC - PubMed
    1. Gilbert J.A., Blaser M.J., Caporaso J.G., Jansson J.K., Lynch S.V., Knight R. Current Understanding of the Human Microbiome. Nat. Med. 2018;24:392–400. doi: 10.1038/nm.4517. - DOI - PMC - PubMed
    1. Murugesan S., Nirmalkar K., Hoyo-Vadillo C., García-Espitia M., Ramírez-Sánchez D., García-Mena J. Gut Microbiome Production of Short-Chain Fatty Acids and Obesity in Children. Eur. J. Clin. Microbiol. Infect. Dis. 2018;37:621–625. doi: 10.1007/s10096-017-3143-0. - DOI - PubMed
    1. Yang T., Santisteban M.M., Rodriguez V., Li E., Ahmari N., Carvajal J.M., Zadeh M., Gong M., Qi Y., Zubcevic J., et al. Gut Dysbiosis Is Linked to Hypertension. Hypertension. 2015;65:1331–1340. doi: 10.1161/HYPERTENSIONAHA.115.05315. - DOI - PMC - PubMed
    1. Yoshida N., Yamashita T., Hirata K. Gut Microbiome and Cardiovascular Diseases. Diseases. 2018;6:56. doi: 10.3390/diseases6030056. - DOI - PMC - PubMed

LinkOut - more resources