. 2022 Nov 17;14(22):4856.
doi: 10.3390/nu14224856.

Transepithelial Effect of Probiotics in a Novel Model of Gut Lumen to Nerve Signaling

Affiliations

Transepithelial Effect of Probiotics in a Novel Model of Gut Lumen to Nerve Signaling

John E Piletz et al. Nutrients. .

Abstract

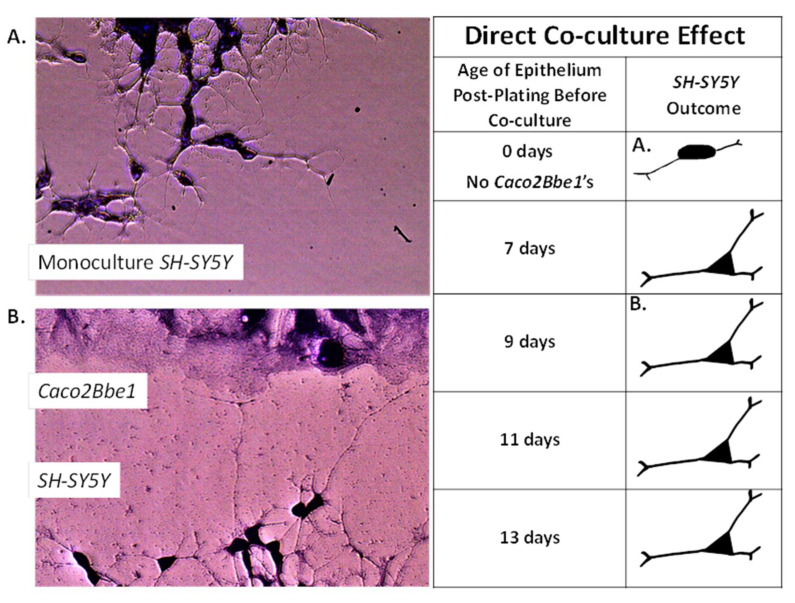
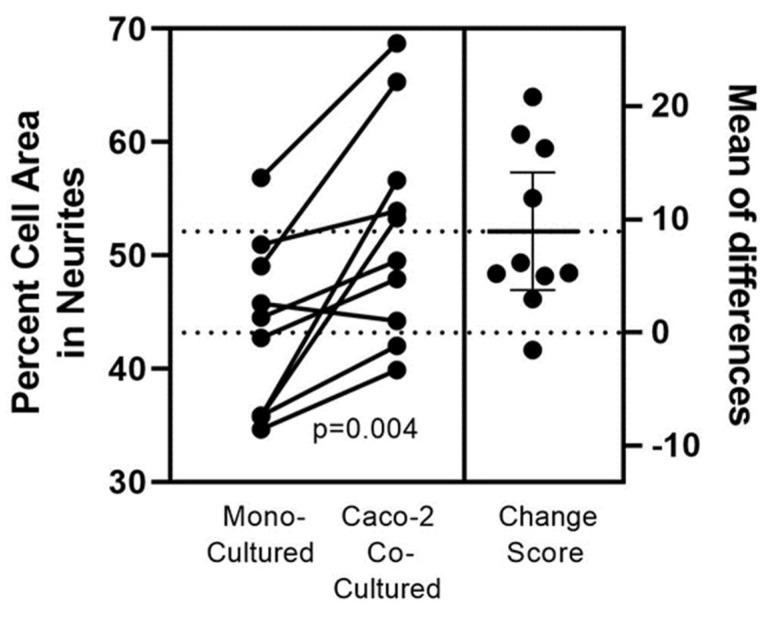
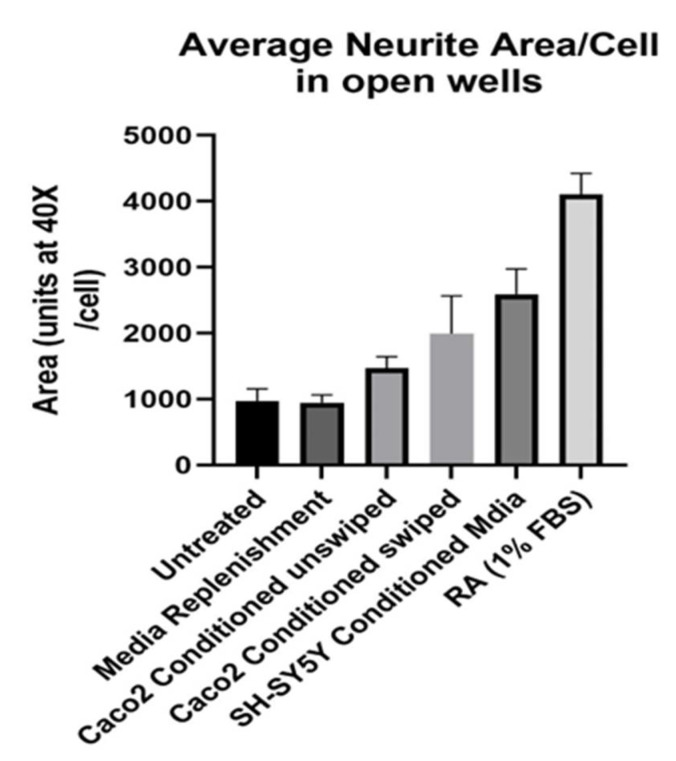
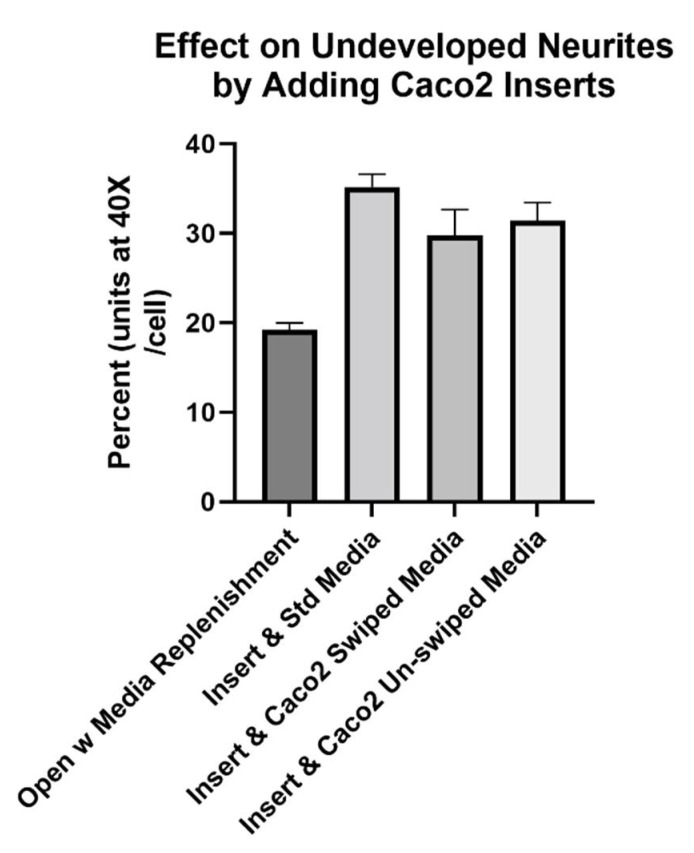
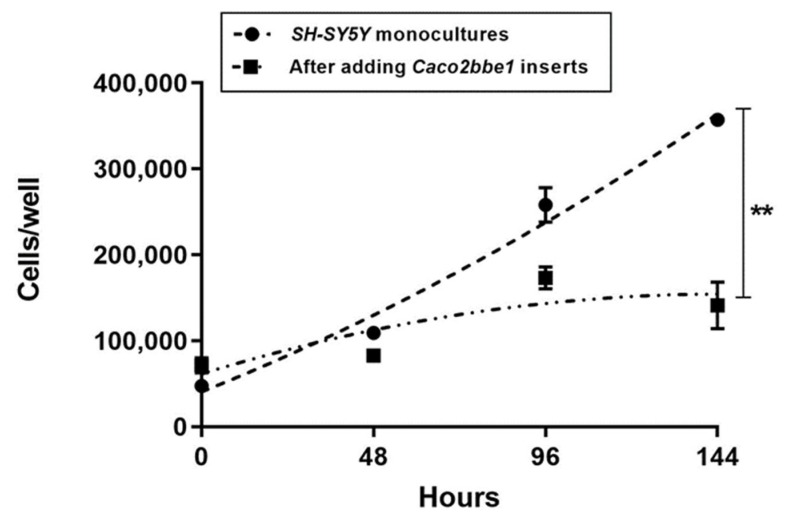
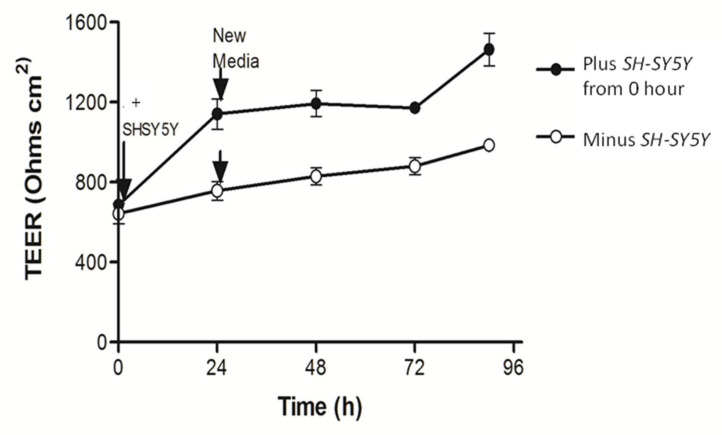
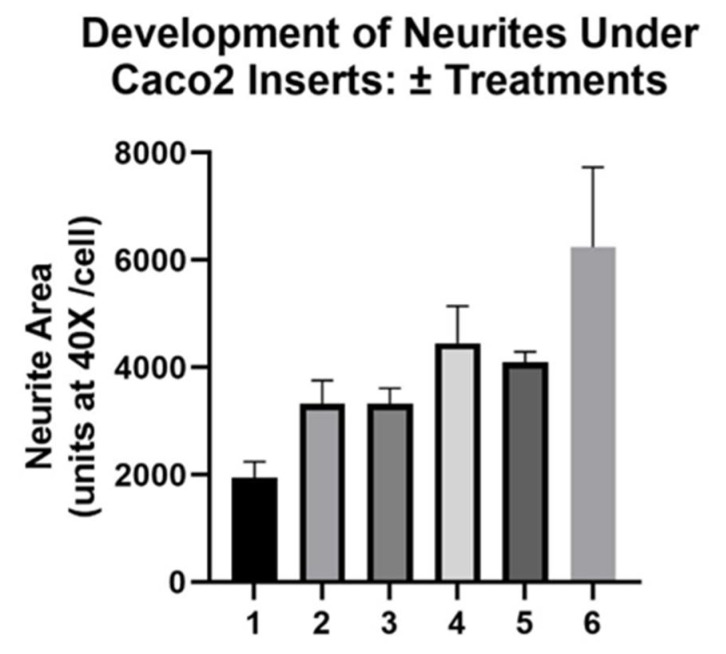
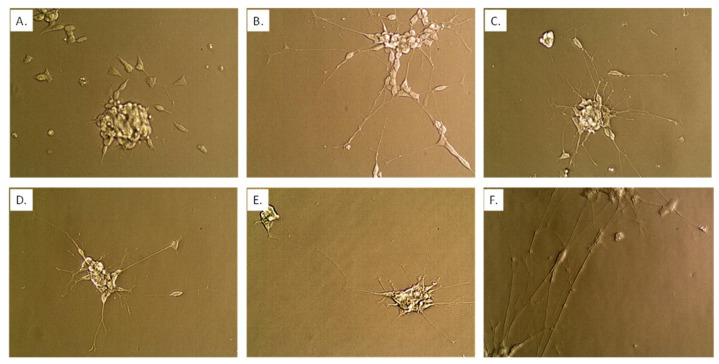
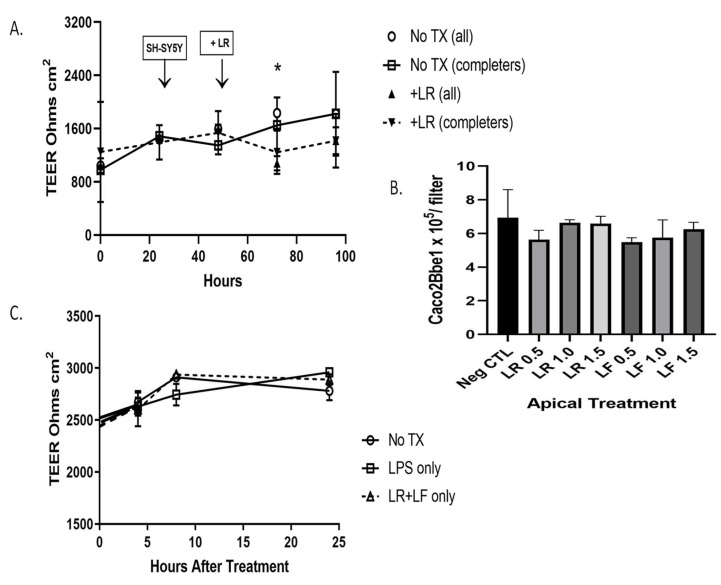
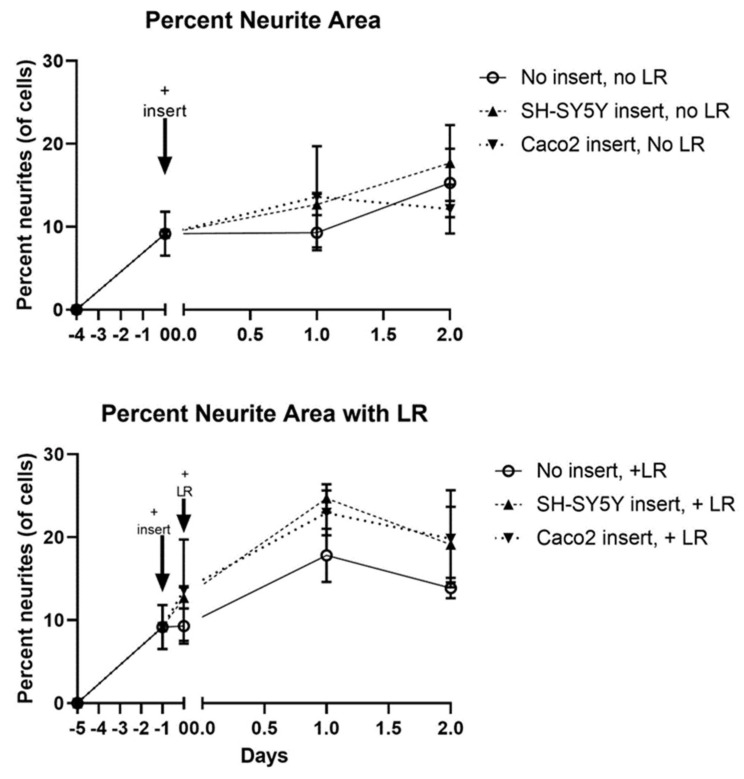
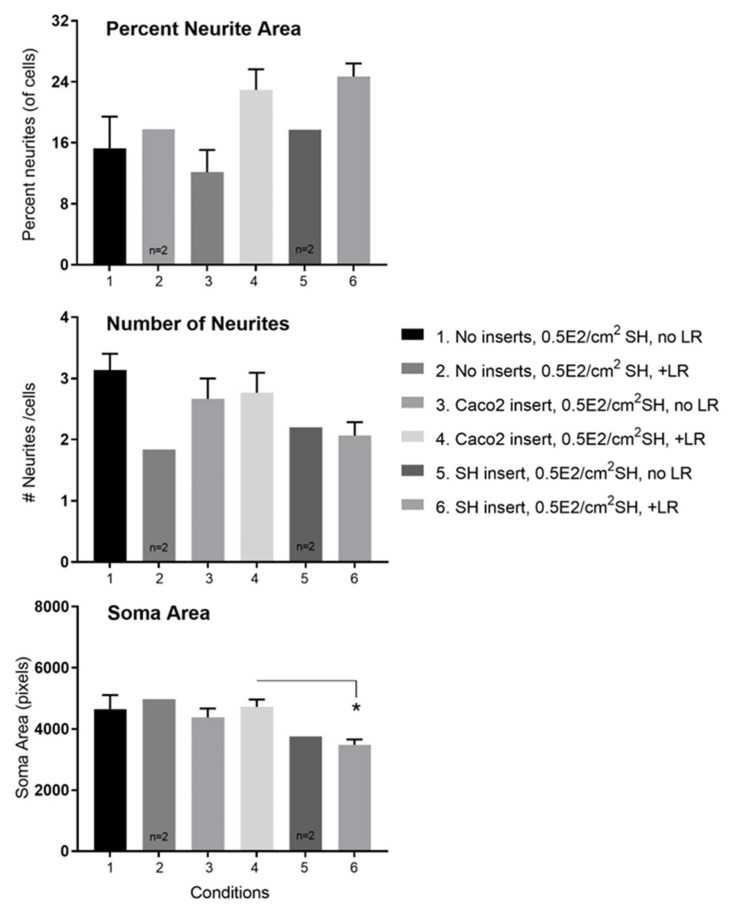
Recent studies have shown that the gut microbiome changes brain function, behavior, and psychiatric and neurological disorders. The Gut-Brain Axis (GBA) provides a neuronal pathway to explain this. But exactly how do commensal bacteria signal through the epithelial layer of the large intestine to activate GBA nerve afferents? An in vitro model is described. We differentiated two human cell lines: Caco2Bbe1 into mature epithelium on 0.4-micron filters and then SH-SY5Y into mature neurons in 24-well plates. These were co-cultured by placing the epithelium-laden filters 1 mm above the neurons. Twenty-four hours later they were tri-cultured by apical addition of 107Lactobacillus rhamnosus or Lactobacillus fermentum which settled on the epithelium. Alone, the Caco2bbe1 cells stimulated neurite outgrowth in underlying SH-SY5Y. Beyond this, the lactobacilli were well tolerated and stimulated further neurite outgrowth by 24 h post-treatment, though not passing through the filters. The results provide face validity for a first-of-kind model of transepithelial intestinal lumen-to nerve signaling. The model displays the tight junctional barrier characteristics found in the large intestine while at the same time translating stimulatory signals from the bacteria through epithelial cells to attracted neurons. The model is easy to set-up with components widely available.

Keywords: Caco2; SH-SY5Y; brain; cholinergic; commensal; enteric; gut; gut brain axis; nervous system; neurites; probiotics; transwell.


Conflict of interest statement

The authors declare no conflict of interest.

Figures

Figure 1
Figure 1
The SH-SY5Y neuronal phenotype in response to direct co-culture with Caco2Bbe1. The manner of swiping and assessing the Caco2Bbe1 cells is described under Methods and in legends of Figure 2 and Figure S1. A suspension of SH-SY5Y cells was added to the swiped open wells of Caco2Bbe1 cells (without inserts) in complete (10% FBS) media. The experimental variables were the presence and stage of epithelial cells prior to swiping. Six days after adding the SH-SY5Y’s, the media was removed by washing, the remaining cells were stained with crystal violet, and photographs were made using 40× phase contrast microscopy. The images show: (A) control SH-SY5Y cells in empty wells without Caco2Bbe1′s (same source, plating density, media, and time of growth), and (B) experimental SH-SY5Y’s cells with their neurites extending toward the Caco2Bbe1 cells in co-culture. At the earliest epithelial stage of swiping (7-day-old Caco2Bbe1′s post-plating), the cells had reached confluency only one day prior. By comparison, based on studies performed later with transmembrane electrical resistance, the Caco2Bbe1 cells should have achieved full maturity by 11 days in pre-culture. As shown in the drawings, all stages of Caco2Bbe1 maturation were equally effective on neurite out-growth in the SH-SY5Y cell line.
Figure 2
Figure 2
Quantifying the Caco2Bbe1 effect on neurite out-growth in SH-SY5Y cells directly co-cultured. Caco2Bbe1 (Caco-2) cells were plated at n = 200,000/well in 3 mL 6-well plates with complete 10% FBS media, incubated, and refed on day 6. On day 7 a single swipe was made in the middle of each well using flat end of a sterile p1000 pipette tip. Debris was removed and a fresh suspension of n= 2000 SH-SY5Y cells was added to each well along with fresh complete media (3 mL per well). Paired controls were set-up with SH-SY5Y cells in monocultures. Following 6 more days as co-cultures, media was removed, and the attached cells were stained with crystal violet. More details of this set-up may be found in Figure S1. Photographs were made at 40× magnification and SH-SY5Y cells were traced using ImageJ software. At least 5 neurons in each swiped area were chosen for tracing based on finding enough neurons that did not clump or overlap with other cells. The left Y-axis is the neurite percent of total cell volume. The number of neurites per cell was also tabulated but not shown (described in the text). Each dot represents average values from 3 wells per experimental condition (so at least 15 neurons were drawn per dot). Connected pairs of dots correspond to paired groups in each experiment. The p-value derives from a paired two-tailed t-test using all (n = 10) experiments. The right Y-axis shows mean percent differences between each pair.
Figure 3
Figure 3
Conditioned media promotes longer SH-SY5Y neurites. SH-SY5Y’s were plated in open 24-well plates at low density (n = 400/well) in complete (10% FBS) media. The experimental variable was type of media change on day 6. Namely, from left to right, the wells were either: untreated (no media change or addition); replenished with fresh complete media; replenished with complete conditioned media taken from confluent Caco2Bbe1 cells (not swiped); replenished with complete conditioned media taken from confluent Caco2Bbe1 cells swiped 2 days earlier; replenished with complete conditioned media from near- confluent SH-SY5Y cells (not swiped); or subject to switching to a media low (1%) in FBS containing 10 µM retinoic acid (RA). Two days afterward, media was removed, cells were washed and stained with crystal violet, and photographs were made using 40× phase contrast microscopy. Cells were traced and the average neurite area per cell was computed using ImageJ software. Bars are means ± SEMs. Significant p values by two-tailed, unpaired head-to-head t-tests were as follows: Media Replenishment alone vs. Caco2Bbe1 conditioned media unswiped (p = 0.019). Media replenishment alone vs. Caco2Bbe1 conditioned media swiped (p = 0.0004). Media replenishment alone vs. SH-SY5Y conditioned media (p < 0.0001). Media Replenishment alone vs. RA in 1% FBS (p < 0.0001). There were no significant differences between Caco2Bbe1 conditioned swiped vs. unswiped (0.091).
Figure 4
Figure 4
Caco2Bbe1 inserts, alone, induce higher percent of neurites in SH-SY5Y cells. SH-SY5Y’s were plated in open wells at low density (n = 400/well) in complete (10% FBS) media. They received inserts on day 6. The experimental variable that occurred on day 6 was insert addition and/or the type of media under the inserts. Namely, from left to right, either: remained open wells but replenished with standard complete (10% FBS) media; added Caco2Bbe1 inserts at the same time as replenished basally with standard complete media; added Caco2Bbe1 inserts at the same time as replenished basally with complete conditioned media taken from confluent Caco2Bbe1 swiped 2 days earlier, or; added Caco2Bbe1 inserts at the same time as replenished basally with complete conditioned media taken from confluent Caco2Bbe1 cells which had not been swiped. Two days afterward, the media was removed, cells were washed and stained with crystal violet, and photographs were made using 40× phase contrast microscopy. Cells were traced and the average neurite area percent was computed using ImageJ software. Bars are means ± SEMs. All three experimental bars are significantly higher than media-only controls (p < 0.01). The right three bars were not significantly different from each other.
Figure 5
Figure 5
Cytostatic effect of Caco2bbe1 inserts on growth of SH-SY5Y cells. Caco2BBe1 cells were plated on inserts (n = 25,000/insert) and grown with regular feeding of complete (10% FBS) media, top, and bottom. On day 11, SH-SY5Y cells were plated in separate open 24-well plates (n = 25,000/well) in complete media. Three days later, both 24-well plates were refed complete media. Immediately afterward, experimental wells received Caco2Bbe1 inserts. The control wells of SH-SY5Y cells remained without inserts (monocultures). Three or more wells per the condition of SH-SY5Y cells were harvested and counted by trypan blue cellometry at 0 (day of combination), 48, 96, and 144 h. Plots are means ± SEMs. The asterisks indicate high statistical difference in cell numbers between the two groups at 144 h (p < 0.001).
Figure 6
Figure 6
SH-SY5Y cells underneath cause tighter junctions between Caco2bbe1 cells on inserts. Caco2BBe1 cells were plated on inserts (n = 25,000/insert) and grown with regular feeding of complete (10% FBS) media, top and bottom. On day 11, SH-SY5Y cells were plated at high density in separate open 24-well plates (n = 25,000/well) in complete media. Four days later, both 24-well plates were refed complete media and half the well inserts were transplanted above the SH-SY5Y cells. The experimental variable was presence or (continued) absence of SH-SY5Y cells under the inserts. The measure was daily TEER readings. Three inserts were assessed per condition and the experiment was repeated three times. Evidence that the initial rise in TEER did not owe to the simple replenishment of media is shown by the arrows when fresh complete media was again replaced after 24 h. No elevation in TEER appeared by just replenishing the media. The inserts not transplanted above SH-SY5Y cells never caught up in TEER. Plots are means ± SEMs.
Figure 7
Figure 7
Development of long neurites under Caco2Bbe1 inserts in response to retinoic acid. Caco2BBe1 cells were plated on inserts (n = 25,000/insert) and grown with regular feeding of complete (10% FBS) media, top and bottom, sufficient to attain high TEER. Eleven days after their plating, SH-SY5Y cells (n = 400) were plated in a different 24-well plate in complete media without inserts. Fourteen days after Caco2Bbe1 plating, the apical side of the inserts was switched to media with 1% FBS, and most of the SH-SY5Y open wells were replaced with media lacking FBS (0%). On the same day-14, the open wells of SH-SY5Y without FBS received 10 µM retinoic acid (RA). Two days later (day 16), the first two conditions were assessed for neurites: (1) untreated open wells in complete (10% FBS) media, and (2) open wells switched to media lacking FBS but containing RA. Among the remaining wells, some were given a second dose of RA and simultaneously covered with Caco2Bbe1 inserts in apical 1% FBS to be assessed another 2 days later (on day 18). Other wells received a combination second treatment with 10 µM RA + 50 ng/0.5 mL Brain-derived Neurotrophic Factor (BDNF) to be assessed three days later (6 below). Before reaching that stage, the day-18 data were collected from cells given (3) 2 × 2-day basal treatments with RA with the second treatment going under the inserts in 1% FBS, and (4) 2 × 2-day basal treatments with RA with the second going under the inserts reverted to 10% FBS. After this, (5) another day passed and the readings from the inserts in 1% FBS were reassessed (on day 19). (6) Assessments were at last made of the wells that had been treated first open for 2 days with RA alone and then simultaneously with inserts and basal RA+ BDNF for 3 more days after that (until day 19). In each case, the SH-SY5Y cells were washed and stained with crystal violet and photographed using 40× phase contrast microscopy. Cells were traced and average neurite areas were computed using ImageJ software. Bars are means ± SEMs. All experimental bars (2–6) are significantly higher than media-only controls (p < 0.01). The right five bars were not significantly different from each other.
Figure 8
Figure 8
Neuronal state using co-culture model begun by plating n = 25,000 Caco2Bbe1 cells on inserts in each well of a 24-well plate. Such were regularly refed to attain high TEER as described in Figure S2. Eleven days after starting to grow the inserts, a separate 24-well plate was given SH-SY5Y cells (n = 400) in complete (10% FBS) media. On day 14 after plating the inserts, the apical media was switched to deplete media with 1% FBS (basal media remained at 10% FBS). On the same day, media in the SH-SY5Y wells was replaced with fresh media lacking FBS (0%) containing 10 µM retinoic acid (RA). Some controls remained in complete media. Both plates were returned to the incubator for 2 more days. At this time, the untreated panel (A) and 2-day RA-treated panel (B) neuroblastoma cells were photographed at 40× magnification. A second batch of serum-deplete media + RA was applied to some of the experimental SH-SY5Y cells (becoming 0.5 mL volume) and inserts were transplanted atop them; although there were 2 more variations (no second dose of RA but adding inserts, or a second dose of RA but remaining in open wells). After two more days in the incubator, the inserts were briefly lifted so that neurons could be photographed without staining at 40× magnification. Panel (C) represents the effects of a single dose of RA then two more days under inserts. After two more days, the inserts were again briefly lifted so neurons could again be photographed panel (D). After two more days, the inserts were again briefly lifted so neurons could again be photographed panel (E). The image in panel (F) comes after two scheduled doses of RA without inserts placed atop them and then incubated the same time course as panel (E). The set-up recommended for treatment studies is probiotics begun with panel (C) (state of neurons when probiotics were administered) and ending with panel (D) (control neuron state compared to the end of studies).
Figure 9
Figure 9
Status of Caco2Bbe1 cells during probiotic administration to the apical side of co-culture model. These studies began by plating n = 25,000 Caco2Bbe1 cells on inserts in a 24-well plate. Such were regularly refed (Figure S2). Eleven days after starting the inserts, a separate open-well plate was given SH-SY5Y cells (n = 400) in complete (10% FBS) media. On day 14 after plating the inserts, the apical media was switched to media with 1% FBS (though basal media remained 10% FBS). On same day, the media in the open SH-SY5Y wells was replaced with fresh media lacking FBS (0%) but containing 10 µM retinoic acid (RA). Both plates were returned to the incubator for 1 more day. Panel (A) shows TEER values from one day after open-well RA. The experimental Caco2Bbe1 inserts were transplanted atop SH-SY5Y cells (first arrow). A day after that, probiotic Lactobacillus rhamnosus (LR) was added atop the inserts, or, in the untreated case, no LR was added (just vehicle: 1% FBS media). Some of the starting inserts were harvested and counted before reaching the 190-h endpoint, which meant the data analysis was performed from start to finish in two ways: with “all” or “completer” wells. Panel (B) shows Caco2Bbe1 cell numbers counted from the inserts harvested at 190 h. The groups were either without probiotics, or with LR added at 0.5, 1.0, or 1.5 × 10⁷ bacilli per insert, or with Lactobacillus fermentum (LF) added at 0.5, 1.0, or 1.5 × 10⁷ bacilli per insert. Panel (C) shows another experiment in which TEER was followed for 24 h from when the probiotic was added (set up as in panel (A)), except the experimental variables were without more additions, or with only lipopolysaccharides (LPS) added apically (0.5 µg in 0.5 mL per well), or with a mixture of LR and LF added apically, each at 0.5 × 10⁷ bacilli per 0.5 mL volume into the upper well of the insert (No LPS). The plots are means ± SEMs. * Comparing TEER in panel (A), with LR versus without LR (all), p = 0.033 when adjusted for multiple unpaired t tests. No other comparisons were statistically significant in any of the panels.
Figure 10
Figure 10
Time course transmembrane effects of Lactobacillius rhamsosus (LR) on SH-SY5Y neurites. Inserts were set up according to the plating and feeding sequence (Figure S4), whether using normal Caco2Bbe1 cells (n = 25,000) or control SH-SY5Y cells (n= 25,000 inserts). After 9 days (designated “minus 5 days” on the lower graph), companion SH-SY5Y wells were plated (n = 50/ well) into open wells of a separate 24-well plate with complete (10% FBS) media. Three days later, the apical media of all inserts was changed to 1% FBS. The next day (day -1 on the lower graph), the first 40× microscopic photographs were taken of the SH-SY5Y cells, following which the inserts were added to create the 3-dimensional (3D) co-cultures. It should be noted that this experiment intentionally used neuroblastoma cells with medium-length neurites because had SH-SY5Y’s been converted to their full-length neurite phenotype before adding LR, it would have been impossible to observe a rise in neurite length as seen in the lower panel. Upper panel: Transmembrane control of apical 1% FBS on basal neurites. The data follow the percent of neurites per total cell volume according to type of inserts with apical 1% FBS in the media, either in: 13-day-old blank inserts, 13-day-old SH-SY5Y inserts, or 13-day-old Caco2Bbe1 inserts. Lower panel: LR transmembrane effect on basal neurites. Fifteen hours after the model became 3D (still running in parallel with upper panel), LR was applied apically (n = 1.0 × 10⁷) to all inserts. The time course followed the percent of neurites per total cell volume according to type of inserts, starting as either: LR on 13.6-day-old blank inserts, LR on 13.6-day-old SH-SY5Y inserts, or LR on 13.6-day-old Caco2Bbe1 inserts. Plots are means ± SEMs. Across all conditions and time points investigated, Caco2Bbe1 TEER values remained highly indicative of tight junctions (not so with blank or SH-SY5Y inserts that failed at any time to register TEER; data not shown here but fully expected since SH-SY5Y cells do not form tight junctions).
Figure 11
Figure 11
Details of changes induced by transmembrane Lactobacillus rhamnosus (LR) on SH-SY5Y neurons in tri-cultures. The data derive from the same experiment set-up in Figure 10 at 24 h post-LR. Upper panel: The apical addition of LR caused a rise in percent neurite area per total cell volume with either Caco2Bbe1 or SH-SY5Y inserts compared to inserts without LR, or to blank inserts with or without LR. Mid panel: The apical addition of LR did not cause a rise in number of neurites per cell with any inserts. Lower panel: The apical addition of LR to Caco2Bbe1 insets did not change soma volume per neuron. However, the apical addition of LR to SH-SY5Y inserts lowered soma volume per neuron in wells under the SH-SY5Y inserts. # is used to abbreviate numbers (of neurites). Bars are means ± SEMs. * Comparing soma areas under conditions 4 versus 6, p = 0.031 by Tukey’s multiple comparisons test. Regarding overall ANOVA, treatment between columns yielded p = 0.149. Although this slice of time effect alone did not meet criteria for significance, the pattern of higher neurite area in conditions 4 and 6 is a static validation of Figure 10 time course.

References

    1. Avetisyan M., Schill E.M., Heuckeroth R.O. Building a Second Brain in the Bowel. J. Clin. Investig. 2015;125:899–907. doi: 10.1172/JCI76307. - DOI - PMC - PubMed
    1. Rao M., Gershon M.D. The Bowel and beyond: The Enteric Nervous System in Neurological Disorders. Nat. Rev. Gastroenterol. Hepatol. 2016;13:517–528. doi: 10.1038/nrgastro.2016.107. - DOI - PMC - PubMed
    1. Tracey K.J. Reflex Control of Immunity. Nat. Rev. Immunol. 2009;9:418–428. doi: 10.1038/nri2566. - DOI - PMC - PubMed
    1. Cussotto S., Sandhu K.v., Dinan T.G., Cryan J.F. The Neuroendocrinology of the Microbiota-Gut-Brain Axis: A Behavioural Perspective. Front. Neuroendocr. 2018;51:80–101. doi: 10.1016/j.yfrne.2018.04.002. - DOI - PubMed
    1. Liang S., Wu X., Jin F. Gut-Brain Psychology: Rethinking Psychology From the Microbiota-Gut-Brain Axis. Front. Integr. Neurosci. 2018;12:33. doi: 10.3389/fnint.2018.00033. - DOI - PMC - PubMed