. 2022 Nov 17;14(11):2496.
doi: 10.3390/pharmaceutics14112496.

Determination of Metabolomics Profiling in BPA-Induced Impaired Metabolism

Affiliations

Determination of Metabolomics Profiling in BPA-Induced Impaired Metabolism

Maria Alvi et al. Pharmaceutics. .

Abstract

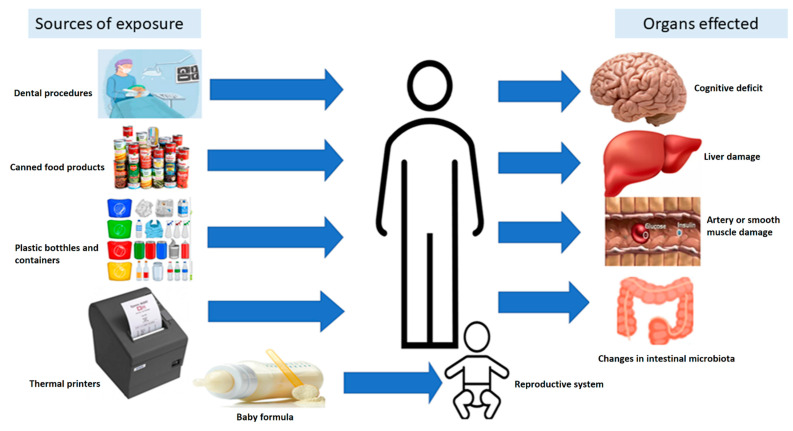
Exposure to bisphenol A (BPA) is unavoidable and it has far-reaching negative effects on living systems. This study aimed to explore the toxic effects of BPA in an experimental animal model through a metabolomics approach that is useful in measuring small molecule perturbations. Beside this, we also examined the ameliorative effects of resveratrol (RSV) against BPA-induced disturbances in experimental mice. This study was conducted for 28 days, and the results showed that BPA indeed induced an impairment in amino acid metabolism, taking place in the mitochondria by significantly (p < 0.05) decreasing the levels of certain amino acids, i.e., taurine, threonine, asparagine, leucine, norleucine, and glutamic acid in the mice plasma. However, the administration of RSV did prove effective against the BPA-induced intoxication and significantly (p < 0.05) restored the level of free amino acids. Lipid metabolites, L-carnitine, sphinganine, phytosphingosine, and lysophosphatidylcholine were also determined in the mice serum. A significant (p < 0.05) decline in glutathione peroxidase (GPx), superoxide dismutase (SOD,) glutathione, and catalase levels and an elevation in malondialdehyde level in the BPA group confirmed the generation of oxidative stress and lipid peroxidation in experimental mice exposed to BPA. The expression of Carnitine palmitoyltransferase I (CPT-I), carnitine palmitoyltransferase II (CPT-II), lecithin−cholesterol acyltransferase (LCAT), carnitine O-octanoyltransferase (CROT), carnitine-acylcarnitine translocase (CACT), and 5-methyltetrahydrofolate-homocysteine methyltransferase (MTR) genes was significantly upregulated in the liver tissue homogenates of experimental mice exposed to BPA, although RSV regulated the expression of these genes when compared with BPA treated experimental mice. CPT-I, CPT-II, and CACT genes are located in the mitochondria and are involved in the metabolism and transportation of carnitine. Hence, this study confirms that BPA exposure induced oxidative stress, upregulated gene expression, and impaired lipid and amino acid metabolism in experimental mice.

Keywords: amino acid metabolism; gene expression; lipid metabolism; mitochondria; resveratrol.


Conflict of interest statement

The authors declare no conflict of interest.

Figures

Figure 1
Figure 1
Schematic represention of the sources of BPA exposure and its impact on some of the organs in humans.
Figure 2
Figure 2
A graphical representation of weight gain in all groups over the experiment timeline. Week 0 represents the weight of the animals at the start of the study. Here, it can be seen in the 1st week bar charts that only the corn oil receiving group showed a significant increase in weight, which can be observed throughout the study. The BPA receiving group showed significant p < 0.05 weight gain in the 2nd week of the study as compared to week 0. This increase in weight of the BPA receiving group was also observed in the 3rd and 4th week of the study. At the end of the study, both the BPA receiving and corn oil receiving group showed significant p < 0.05 weight gain as compared to the start of the study and the control group. In the resveratrol receiving groups, i.e., BPA+RSV-CRN and RSV+CRN, the role of resveratrol in combating weight gain can be observed throughout the experiment timeline. Both groups showed restraint in weight gain as compared to the BPA and CRN group and showed a non-significant difference to the start of the study and among each other. The results were analyzed using a two-way ANOVA followed by Bonferroni’s post-test comparison. Here *** shows a highly significant difference, i.e., weight gain in the groups receiving corn oil and the group receiving BPA throughout the study as compared to week 0. Each group contained 5 animals.
Figure 3
Figure 3
Effect of BPA on peroxidation biomarkers and antioxidant enzymes (A) MDA, (B) GSH, (C) SOD, (D) CAT, and (E) GPx, and the ameliorative effect of RSV. The level of GSH, SOD, CAT and GPx were decreased at the end of experiment while MDA levels were enhanced. The data were analyzed using one-way ANOVA. The results are expressed as the mean ± SD. ** shows the level of significance where *** means a highly significant difference from the control group. Abbreviations: GSH: Glutathione; SOD: Superoxide dismutase; CAT: Catalase; GPx: Glutathione peroxidase; MDA: Malondialdehyde; CON: Control group; BPA: BPA receiving group; BPA+RSV-CRN: BPA and resveratrol blended in corn oil group; RSV-CRN: resveratrol blended in corn oil group; CRN: Corn oil group.
Figure 4
Figure 4
Graphical representation of the effects of BPA on mRNA expression of the (A) CPT I, (B) CPT II, (C) LCAT, (D) CROT, (E) CACT, and (F) MTR genes in all groups, i.e., CON, BPA, BPA+RSV-CRN, RSV-CRN, and CRN. The quantitative analysis was performed at the end of the experiment. Data were analyzed using one-way ANOVA. * is used to show the significance of the results where *** means a highly significant difference from the control group. Abbreviations: CPT I: Carnitine palmitoyltransferase I; CPT II: Carnitine palmitoyltransferase II; LCAT: Lecithin–cholesterol acyltransferase; CROT: Carnitine O-octanoyltransferase; CACT: Mitochondrial carnitine/acylcarnitine carrier protein; MTR: 5-methyltetrahydrofolate-homocysteine methyltransferase.
Figure 5
Figure 5
Graphical representation of the results of the amino acid analyzer: (A) taurine, (B) threonine, (C) asparagine, (D) glutamic acid, (E) leucine, and (F) norleucine in the plasma of different mice groups, i.e., CON, BPA, BPA+RSV-CRN, RSV-CRN, and CRN groups, respectively. The quantitative analysis was performed at the end of the experiment of 28 days using a one-way ANOVA followed by Tukey’s test to compare all pairs of columns. Each group contained 5 animals. The error bar represents the mean ± SD. * are used to illustrate the statistical significance of results where *** represents a highly significant difference in comparison to the control group while * shows a statistically low significance. Abbreviations: Taur: Taurine; Thr: Threonine; Asn: Asparagine; Leu: Leucine; Nleu: Norleucine; Glu: Glutamic acid; CON: Control group; BPA: BPA group; BPA+RSV-CRN: BPA and resveratrol blended in corn oil group; RSV-CRN: Resveratrol blended in corn oil group; CRN: Corn oil group; ANOVA: Analysis of variance.
Figure 6
Figure 6
MS/MS spectrum of Sphinganine in positive ion mode.
Figure 7
Figure 7
MS/MS spectrum of Phytosphingosine in positive ion mode.
Figure 8
Figure 8
MS/MS spectrum of Lysophosphatidylcholine in positive ion mode.
Figure 9
Figure 9
MS 2 of Lysophosphatidylcholine.
Figure 10
Figure 10
Structure and MS/MS spectrum of L-Carnitine in negative ion mode.
Scheme 1
Scheme 1
Synthesis of acylcarnitine from carnitine.
Scheme 2
Scheme 2
Synthesis of carnitine from acylcarnitine.
Figure 11
Figure 11
Schematic representation of the metabolomic pathway of amino acids taking place in mitochondria.

References

    1. Akash M.S.H., Sabir S., Rehman K. Bisphenol A-induced metabolic disorders: From exposure to mechanism of action. Environ. Toxicol. Pharmacol. 2020;77:103373. doi: 10.1016/j.etap.2020.103373. - DOI - PubMed
    1. Yin F., Huang X., Lin X., Chan T.-F., Lai K.P., Li R. Analyzing the synergistic adverse effects of BPA and its substitute, BHPF, on ulcerative colitis through comparative metabolomics. Chemosphere. 2021;287:132160. doi: 10.1016/j.chemosphere.2021.132160. - DOI - PubMed
    1. Oldring P.K., Castle L., O’Mahony C., Dixon J. Estimates of dietary exposure to bisphenol A (BPA) from light metal packaging using food consumption and packaging usage data: A refined deterministic approach and a fully probabilistic (FACET) approach. Food Addit. Contaminants. Part A Chem. Anal. Control. Expo. Risk Assess. 2014;31:466–489. doi: 10.1080/19440049.2013.860240. - DOI - PMC - PubMed
    1. Akash M.S.H., Ejaz ul Haq M., Sharif H., Rehman K. Bisphenol A and Neurological Disorders: From Exposure to Preventive Interventions. In: Akash M.S.H., Rehman K., editors. Environmental Contaminants and Neurological Disorders. Springer International Publishing; Cham, Switzerland: 2021. pp. 185–200. - DOI
    1. Irshad K., Rehman K., Sharif H., Tariq M., Murtaza G., Ibrahim M., Akash M.S.H. Bisphenol A as an EDC in Metabolic Disorders. In: Akash M.S.H., Rehman K., Hashmi M.Z., editors. Endocrine Disrupting Chemicals-Induced Metabolic Disorders and Treatment Strategies. Springer International Publishing; Cham, Switzerland: 2021. pp. 251–263. - DOI

LinkOut - more resources