. 2022 Nov 21;11(22):3176.
doi: 10.3390/plants11223176.

Environmental Signals Act as a Driving Force for Metabolic and Defense Responses in the Antarctic Plant Colobanthus quitensis

Affiliations

Environmental Signals Act as a Driving Force for Metabolic and Defense Responses in the Antarctic Plant Colobanthus quitensis

Laura Bertini et al. Plants (Basel). .

Abstract

During evolution, plants have faced countless stresses of both biotic and abiotic nature developing very effective mechanisms able to perceive and counteract adverse signals. The biggest challenge is the ability to fine-tune the trade-off between plant growth and stress resistance. The Antarctic plant Colobanthus quitensis has managed to survive the adverse environmental conditions of the white continent and can be considered a wonderful example of adaptation to prohibitive conditions for millions of other plant species. Due to the progressive environmental change that the Antarctic Peninsula has undergone over time, a more comprehensive overview of the metabolic features of C. quitensis becomes particularly interesting to assess its ability to respond to environmental stresses. To this end, a differential proteomic approach was used to study the response of C. quitensis to different environmental cues. Many differentially expressed proteins were identified highlighting the rewiring of metabolic pathways as well as defense responses. Finally, a different modulation of oxidative stress response between different environmental sites was observed. The data collected in this paper add knowledge on the impact of environmental stimuli on plant metabolism and stress response by providing useful information on the trade-off between plant growth and defense mechanisms.

Keywords: Colobanthus quitensis; MS/MS analysis; differential proteomic analysis; environmental signals; enzymatic activity; gene expression analysis; response to stress.


Conflict of interest statement

The authors declare no conflict of interest. The funders had no role in the design of the study; in the collection, analyses, or interpretation of data; in the writing of the manuscript, or in the decision to publish the results.

Figures
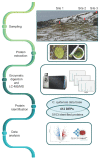
Figure 1
Figure 1
Experimental workflow (left); pictures on the right refer to each step of the workflow.
Figure 2
Figure 2
Volcano plot representation of differentially expressed proteins (DEPs) in the three data sets. Statistically significant (p-value < 0.05), |log2FC| > 0.58) upregulated and downregulated proteins for each data set are indicated with red and blue dots, respectively. Non-significant proteins are represented in gray. (a) S2 vs. S1 data set; (b) S3 vs. S1 data set; (c) S3 vs. S2 data set.
Figure 3
Figure 3
Graphical representation of the GO terms enriched in the S2 vs. S1 data set. The x-axis refers to the number of DEPs upregulated or downregulated that significantly enrich a specific GO term. Lines are colored by a red–blue gradient based on fold enrichment, whereas the size of the circle at the end of the lines is related to the statistical significance (−log10 FDR).
Figure 4
Figure 4
Graphical representation of the GO terms enriched in the S3 vs. S1 data set. The x-axis refers to the number of DEPs upregulated or downregulated that significantly enrich a specific GO term. Lines are colored by a red–blue gradient based on fold enrichment, whereas the size of the circle at the end of the lines is related to the statistical significance (−log10 FDR).
Figure 5
Figure 5
Graphical representation of the GO terms enriched in the S3 vs. S2 data set. The x-axis refers to the number of DEPs upregulated or downregulated that significantly enrich a specific GO term. Lines are colored by a red–blue gradient based on fold enrichment, whereas the size of the circle at the end of the lines is related to the statistical significance (−log10 FDR).
Figure 6
Figure 6
Antioxidant enzyme activities and TBARS content in C. quitensis leaves collected at the three sites S1, S2, and S3 (x-axes). (a) Catalase (CAT); (b) glutathione S-transferase (GST); (c) guaiacol peroxidase (POD); (d) superoxide dismutase (SOD); (e) TBARS content. Data represent the mean ± SD of three biological replicates. For all enzymatic assays, a statistically significant difference was found between all sites (p < 0.0001). As for TBARS, a statistically significant difference was found only between S1 vs. S3 and S2 vs. S3 (p < 0.0001). Statistic test: one-way ANOVA, Tukey’s multiple comparisons. The letters indicate significant differences between the samples.
Figure 7
Figure 7
Relative expression of C. quitensis genes normalized with the reference genes elongation factor 1-alpha (EF1α). (a) Hexokinase (HK1); (b) transketolase (TKL); (c) nitrite reductase 1 (NIR1); (d) cell division cycle 5 (CDC5); (e) DNAJ. Error bars represent the mean ± SD of three biological replicates. Statistic test: one-way ANOVA, Tukey’s multiple comparisons (p < 0.05). The letters indicate significant differences between the samples.
Figure 8
Figure 8
Outline of the main results obtained in the present paper.

Similar articles

Cited by

References

    1. Convey P., Coulson S.J., Worland M.R., Sjöblom A. The importance of understanding annual and shorter-term temperature patterns and variation in the surface levels of polar soils for terrestrial biota. Polar. Biol. 2018;41:1587–1605. doi: 10.1007/s00300-018-2299-0. - DOI
    1. Sierra-Almeida A., Cavieres L.A., Bravo L.A. Warmer temperatures affect the in situ freezing resistance of the Antarctic vascular plants. Front. Plant. Sci. 2018;9:1456. doi: 10.3389/fpls.2018.01456. - DOI - PMC - PubMed
    1. Clemente-Moreno M.J., Omranian N., Sáez P., Figureueroa C.M., Del-Saez N., Elso M., Poblete L., Orf I., Cuadros-Inostroza A., Cavieres L., et al. Cytochrome respiration pathway and sulphur metabolism sustain stress tolerance to low temperature in the Antarctic species Colobanthus quitensis. New Phytol. 2020;225:754–768. doi: 10.1111/nph.16167. - DOI - PubMed
    1. Alberdi M., Bravo L.A., Gutiérrez A., Gidekel M., Corcuera L.J. Ecophysiology of Antarctic vascular plants. Physiol. Plantarum. 2002;115:479–486. doi: 10.1034/j.1399-3054.2002.1150401.x. - DOI - PubMed
    1. Wasley J., Robinson S.A., Lovelock C.E., Popp M. Climate change manipulations show Antarctic flora is more strongly affected by elevated nutrients than water. Global. Change Biol. 2006;12:1800–1812. doi: 10.1111/j.1365-2486.2006.01209.x. - DOI