Review
. 2022 Nov 18;14(22):5010.
doi: 10.3390/polym14225010.

Upcycling Polystyrene

Affiliations
Review

Upcycling Polystyrene

Jaworski C Capricho et al. Polymers (Basel). .

Abstract

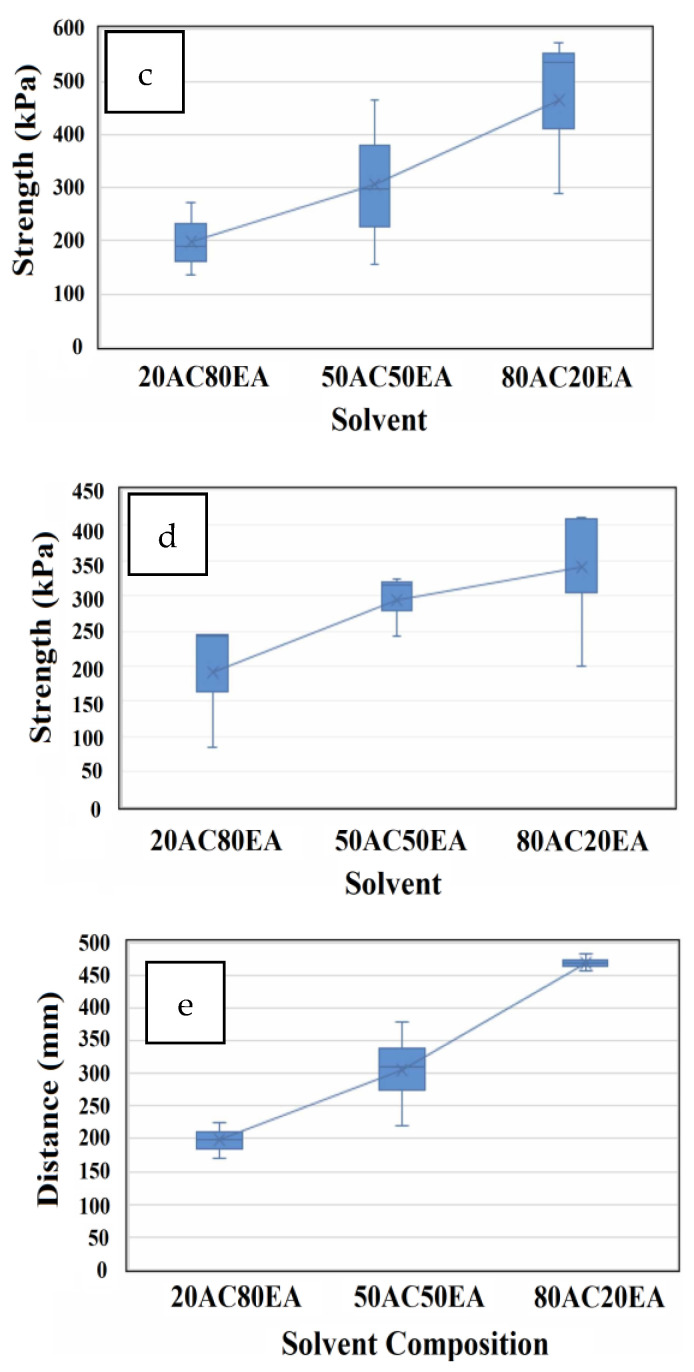
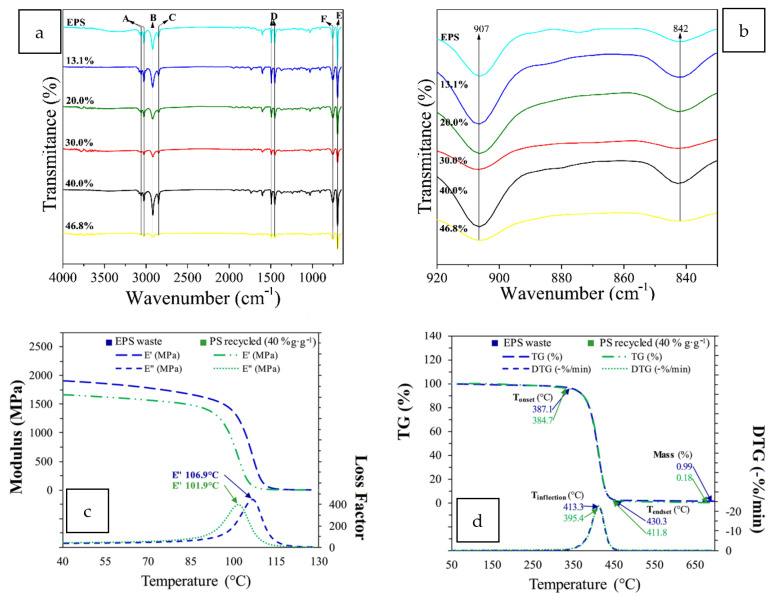
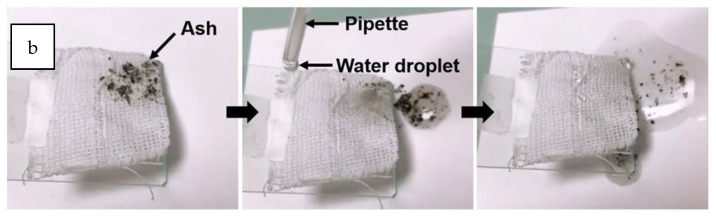
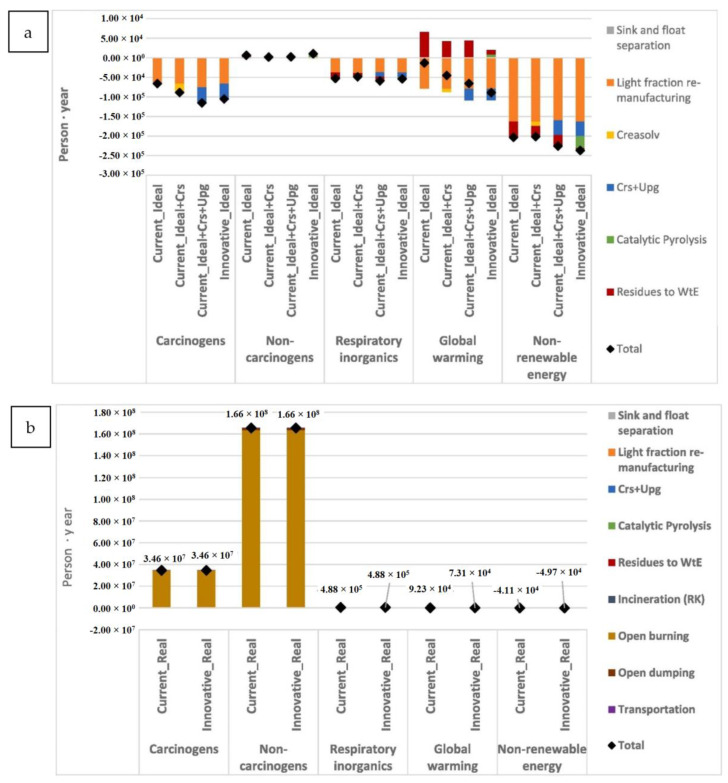
Several environmental and techno-economic assessments highlighted the advantage of placing polystyrene-based materials in a circular loop, from production to waste generation to product refabrication, either following the mechanical or thermochemical routes. This review provides an assortment of promising approaches to solving the dilemma of polystyrene waste. With a focus on upcycling technologies available in the last five years, the review first gives an overview of polystyrene, its chemistry, types, forms, and varied applications. This work presents all the stages that involve polystyrene's cycle of life and the properties that make this product, in mixtures with other polymers, command a demand on the market. The features and mechanical performance of the studied materials with their associated images give an idea of the influence of recycling on the structure. Notably, technological assessments of elucidated approaches are also provided. No single approach can be mentioned as effective per se; hybrid technologies appear to possess the highest potential. Finally, this review correlates the amenability of these polystyrene upcycling methodologies to frontier technologies relating to 3D printing, human space habitation, flow chemistry, vertical farming, and green hydrogen, which may be less intuitive to many.

Keywords: environmental assessment; plastic pollution; polystyrene; recycling; sustainability; waste plastics.


Conflict of interest statement

The authors declare that they have no conflict of interest.

Figures

Figure 1
Figure 1
The linear and circular economy based on PS. Reprinted with permission from ref. [4].
Figure 2
Figure 2
Benzoyl peroxide-initiated polymerization of PS.
Figure 3
Figure 3
Different forms of PS.
Figure 4
Figure 4
Overview of plastic recycling methodologies. Reprinted with permission from ref. [14].
Figure 5
Figure 5
Global and EU waste management rates. Reprinted with permission from ref. [16].
Figure 6
Figure 6
Using novel blending approaches to upscale properties of recycled PO blends using microfibrillar PET (a), (c) Using conventional injection molding (CIM), (b,d) Using multi-flow viber injection molding (MFVIM). Reprinted with permission from ref. [16].
Figure 7
Figure 7
Illustration of the vision system for assessing the effectiveness of the electrostatic separation process. Reprinted with permission from ref. [20].
Figure 8
Figure 8
The NIR spectra of PS samples were obtained by a linear spectrometer, where (V) are virgin particles, (O) represents the original shape of waste, (P) are large pieces, and (F) are flakes. Reprinted with permission from ref. [21].
Figure 9
Figure 9
(a) Chemical composition (in weight %) and (b) Solid, liquid and gas (in weight %) yield of product obtained from pyrolysis of WEEE and MSW streams. Reprinted with permission from ref. [28].
Figure 9
Figure 9
(a) Chemical composition (in weight %) and (b) Solid, liquid and gas (in weight %) yield of product obtained from pyrolysis of WEEE and MSW streams. Reprinted with permission from ref. [28].
Figure 10
Figure 10
Size exclusion chromatograms before (black curves) and after (red curves) hydrogenolysis with deuterium exchange (PtRe/SiO2 catalyst to PS at 1:1 (w/w) loading, 17 h, 170 °C). PS (black curve) was fully saturated, forming PCHE (red curve) before and after the reaction. Reprinted with permission from ref. [41].
Figure 11
Figure 11
Hydrogenolysis of PS with (a) catalyst, (b) PS1: laboratory-grade polystyrene; PS2: polystyrene single-use cup; PS3: EPS foam (0.1 g PS + 0.05 mmol catalyst, 10 mL o-C6H4F2, 5 bar H2). (c) Phenylalkane and benzene yields. Reprinted with permission from ref. [42].
Figure 12
Figure 12
(a) Product yield and (b) gas selectivity of hydrogenolysis of post-consumer PS. Reprinted with permission from ref. [43].
Figure 13
Figure 13
Simulation environment of the Aspen Hysys simulation model for the catalytic cracking of PS. Reprinted with permission from ref. [44].
Figure 14
Figure 14
FTIR spectra of initial DMCHA and recovered DMCHA. Reprinted with permission from ref. [45].
Figure 15
Figure 15
Drying and dissolution of waste EPS. (a) dissolution of EPS in acetone/ethyl acetate mixtures; (b) bubble formation after drying the waste, (c) binder load strength, (d) apparent strength shear; and (e) stickiness. Reprinted with permission from ref. [49].
Figure 15
Figure 15
Drying and dissolution of waste EPS. (a) dissolution of EPS in acetone/ethyl acetate mixtures; (b) bubble formation after drying the waste, (c) binder load strength, (d) apparent strength shear; and (e) stickiness. Reprinted with permission from ref. [49].
Figure 16
Figure 16
Comparison of (a,b): Chemical (via FTIR), (c): Thermal (through % weight loss thermogravimetry TG and first derivative differential thermogravimetry DTG data), and (d): Mechanical (Storage Modulus E’ (in MPa) and Loss Modulus E’’ (in MPa)) characteristics of regenerated PS with source EPS. Reprinted with permission from Ref. [50].
Figure 17
Figure 17
Synthesis scheme via the solvothermal method for hybrid nanocomposites. Reprinted with permission from ref. [51].
Figure 18
Figure 18
(a) Nanohardness and (b) elastic modulus under indentation loads of 20, 50, and 100 mN for Fe2O3 nanocomposites, ZnO nanocomposites, and recycled EPS composite. Reprinted with permission from ref. [51].
Figure 19
Figure 19
Proposed mechanism of polystyrene depolymerization in salt and oxidized copper scrubber. Reprinted with permission from ref. [53].
Figure 20
Figure 20
Compressive strength development with (a) time and (b) mortar density of EPS-based mortars, (c) Capillary water absorption coefficient (CA), and (d) water vapor resistance (μ) of lightweight EPS-based mortars. Samples V implies that virgin EPS replaces the sand volume, R implies that recycled EPS replaces the sand volume, and HR implies that recycled EPS with 0.5% silane agent replaces the sand volume, while the numbers indicate the extent of volume replacement. Reprinted with permission from ref. [60].
Figure 21
Figure 21
Scanning electron microscopy (SEM) images of mortar produced with EPS aggregate. Reprinted with permission from ref. [63].
Figure 22
Figure 22
Exposed surfaces of the concrete disc (a) without WEEE (Control mix) and (b) with 30% WEEE (PC-Blend-30). Reprinted with permission from ref. [64].
Figure 23
Figure 23
Compression testing of PS/cement composite material. Reprinted with permission from ref. [65].
Figure 24
Figure 24
Types of samples used in the single flame source test. Reprinted with permission from ref. [66].
Figure 25
Figure 25
Impact of immersion periods on the compressive strength of the cement-polymer composites in plain, ground, and seawater. Reprinted with permission from ref. [67].
Figure 26
Figure 26
Microstructure of the composite material under various conditions (a) before immersion and after immersion in (b) plain water, (c) groundwater, and (d) seawater for 420 days. Portlandite [CH], calcium silicate hydrate [CSH], salt crystals [SC], ettringite [E], and polymer matrix [PM]. Reprinted with permission from ref. [67].
Figure 27
Figure 27
Variation in the reduction of compressive strength (%) in self-consolidating lightweight concretes as the typical coarse river aggregate was replaced with 40, 50, 60, 70 and 80% EPS beads. Reprinted from ref. [69].
Figure 28
Figure 28
Water absorptivity of recycled PS-based concrete. Reprinted with permission from ref. [71].
Figure 29
Figure 29
(a): Oil absorption process by PS/SiO2-coated textile from the water surface, (b): Surface self-cleaning effect of PS/SiO2-coated textile. Reprinted with permission from ref. [72].
Figure 29
Figure 29
(a): Oil absorption process by PS/SiO2-coated textile from the water surface, (b): Surface self-cleaning effect of PS/SiO2-coated textile. Reprinted with permission from ref. [72].
Figure 30
Figure 30
Mechanism of covalent bond formation between the recycled EPS and the sawdust. Reprinted with permission from ref. [73].
Figure 31
Figure 31
Sawdust-based panels of different wood species. Reprinted with permission from ref. [74].
Figure 32
Figure 32
Comparison of the (a): current and (b): novel management pathways for WEEE plastics. Reprinted with permission from ref. [92].
Figure 33
Figure 33
Normalized impact assessment data for the analyzed (a): Ideal and (b): Real scenarios concerning the functional unit and with the contribution of every single stage of the life cycle: Crs = CreaSolv®; Upg = Plastic Upgrading; Pyr = Catalytic Pyrolysis. The intermediates represent the current scheme where innovative processes are gradually added. The shaded rhombus indicates the total value for each impact category. Results are normalized in “Person · year”, i.e., the average impact in a specific category caused by a person during one year in Europe. Reprinted with permission from ref. [92].
Figure 34
Figure 34
LCA flowchart used to assess the impact of EPS container production. Reprinted with permission from ref. [94].
Figure 35
Figure 35
Variation in mechanical properties of WEEE composites with 0–20% SBS (a) Impact strength, (b) Tensile strength, (c) Elongation at break. Reprinted with permission from ref. [101].
Figure 36
Figure 36
Impact strength of recycled PVC blended with (a) recycled ABS blends and (b) recycled HIPS. Reprinted with permission from ref. [102].
Figure 37
Figure 37
Schematic of the plausible cross-linking in recycled PVC/ABS blends. Reprinted with permission from ref. [102].
Figure 38
Figure 38
(a) Thermal conductivity of DVR–PS composites with varying quantities of DVR at 25 °C; (b) thermal conductivity of DVR–PS composite with varying temperatures; and (c) comparison of thermal conductivities of DVR–PS with other rubber composites. Reprinted with permission from ref. [103].
Figure 39
Figure 39
Mechanical properties (a): Tensile properties and (b): Impact strengths of recycled PS/HIPS/ABS ternary blends. Reprinted with permission from ref. [100].
Figure 40
Figure 40
Mechanism of ionic cross-linking in recycled PS blends. Reprinted with permission from ref. [112].
Figure 41
Figure 41
Evidence of homogenous CaCO3 dispersion in tensile fracture surfaces recycled PS/ESP/CaCO3 at (A) 80/20/0 wt.%, (B) 82/10/10 wt.%, and (C) 80/0/20 wt.%, respectively. Reprinted with permission from ref. [114].

Similar articles

Cited by

References

    1. Larrain M., Van Passel S., Thomassen G., Van Gorp B., Nhu T.T., Huysveld S., Van Geem K.M., De Meester S., Billen P. Techno-Economic Assessment of Mechanical Recycling of Challenging Post-Consumer Plastic Packaging Waste. Resour. Conserv. Recycl. 2021;170:105607. doi: 10.1016/j.resconrec.2021.105607. - DOI
    1. Peinado F., Aldas M., López-Martínez J., Samper M.D. Recycling of the Styrene Fraction from Post-Consumer Waste. Mater. Tehnol. 2020;54:725–730. doi: 10.17222/mit.2020.043. - DOI
    1. Hirayama D., Nunnenkamp L.A., Braga F.H.G., Saron C. Enhanced Mechanical Properties of Recycled Blends Acrylonitrile–Butadiene–Styrene/High–Impact Polystyrene from Waste Electrical and Electronic Equipment Using Compatibilizers and Virgin Polymers. J. Appl. Polym. Sci. 2022;139:51873. doi: 10.1002/app.51873. - DOI
    1. Civancik-Uslu D., Nhu T.T., Van Gorp B., Kresovic U., Larrain M., Billen P., Ragaert K., De Meester S., Dewulf J., Huysveld S. Moving from Linear to Circular Household Plastic Packaging in Belgium: Prospective Life Cycle Assessment of Mechanical and Thermochemical Recycling. Resour. Conserv. Recycl. 2021;171:105633. doi: 10.1016/j.resconrec.2021.105633. - DOI
    1. Zhao X., Korey M., Li K., Copenhaver K., Tekinalp H., Celik S., Kalaitzidou K., Ruan R., Ragauskas A.J., Ozcan S. Plastic Waste Upcycling toward a Circular Economy. Chem. Eng. J. 2022;428:131928. doi: 10.1016/j.cej.2021.131928. - DOI

LinkOut - more resources