

A Catalogue of Machine Learning Algorithms for Healthcare Risk Predictions
- PMID: 36433212
- PMCID: PMC9695983
- DOI: 10.3390/s22228615
A Catalogue of Machine Learning Algorithms for Healthcare Risk Predictions
Abstract
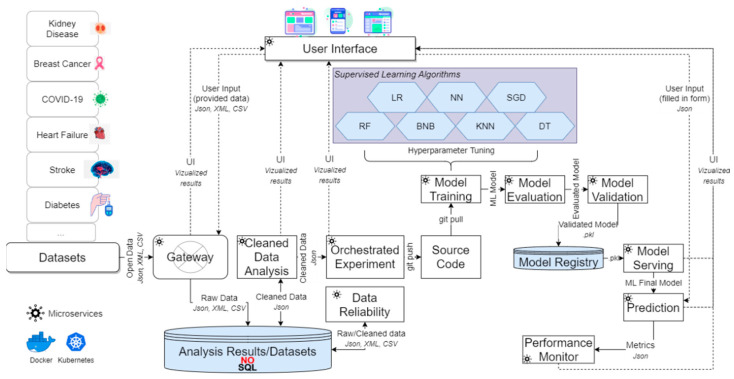
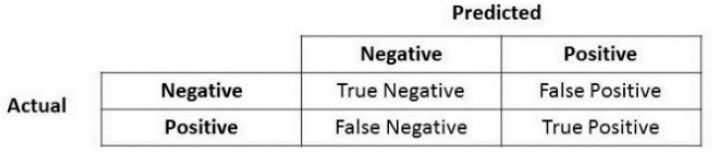
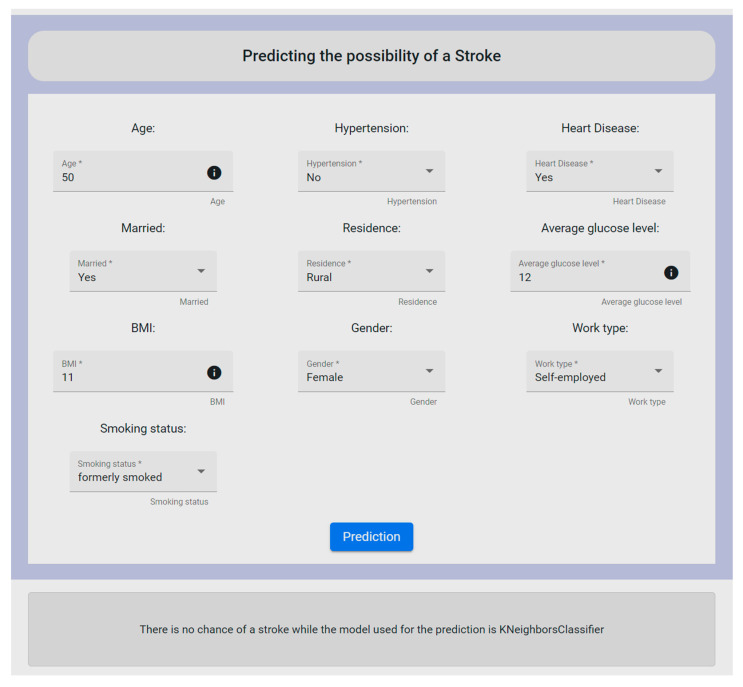
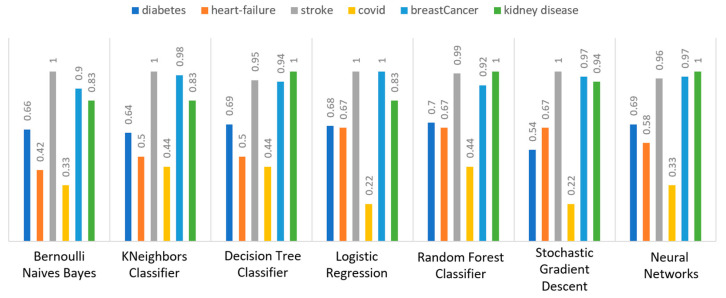
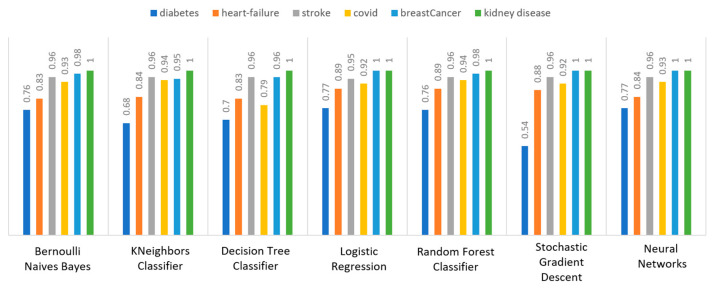
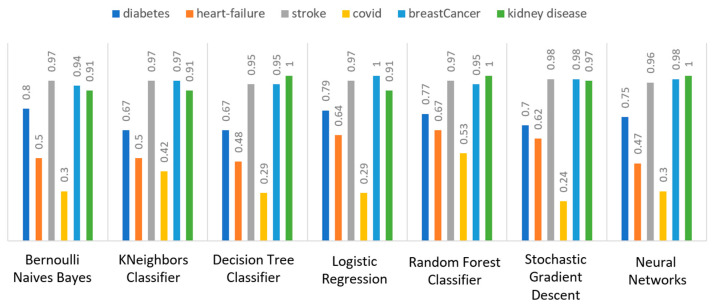
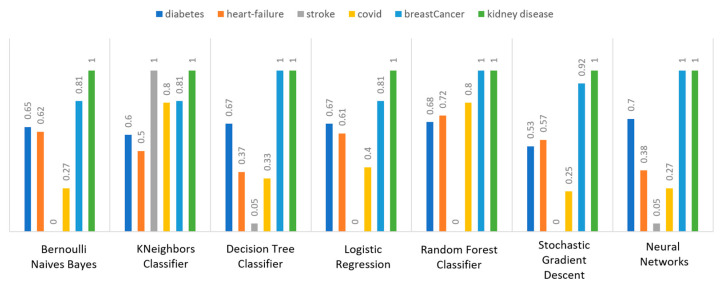
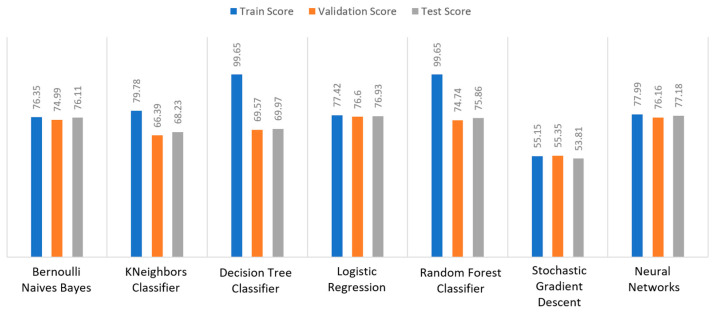
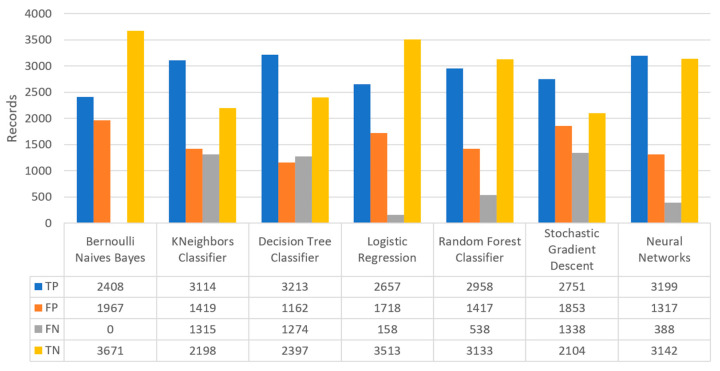
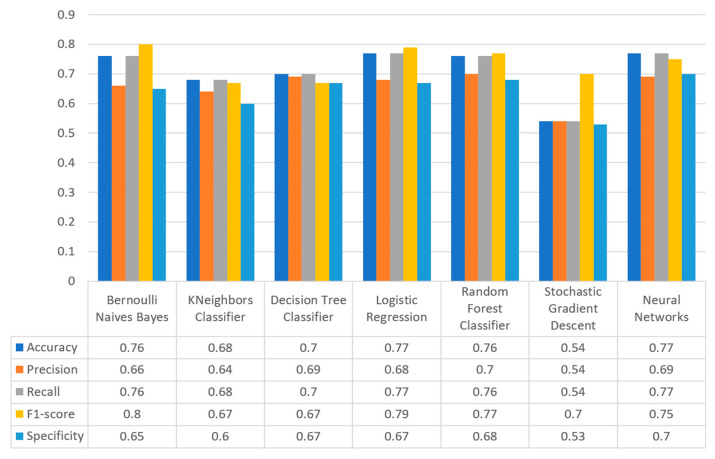
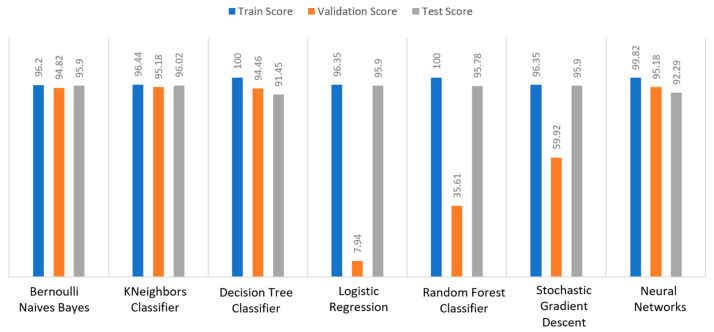
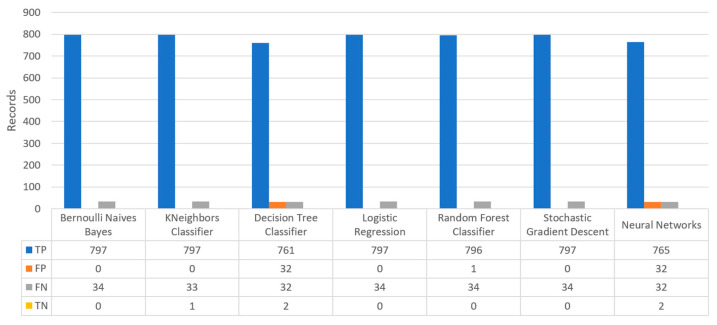
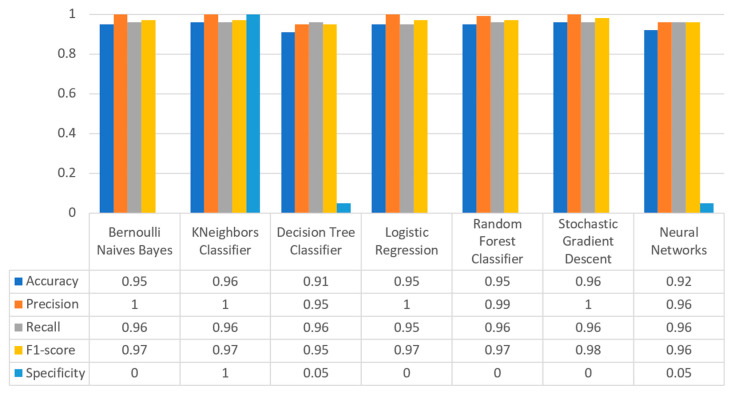
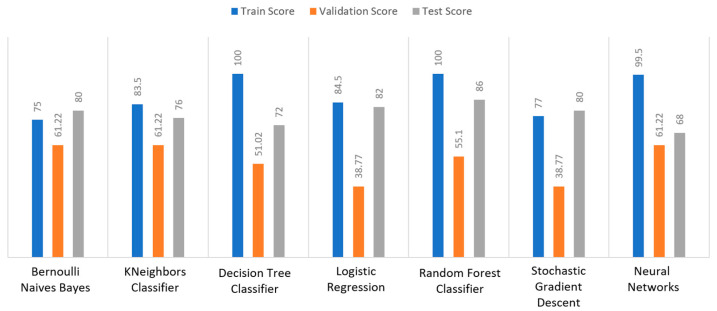
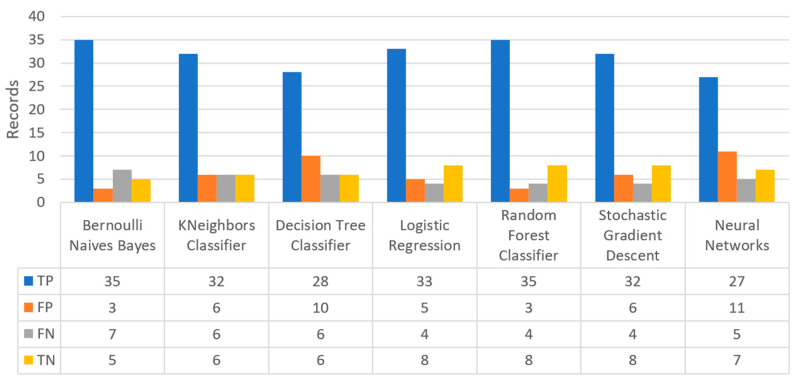
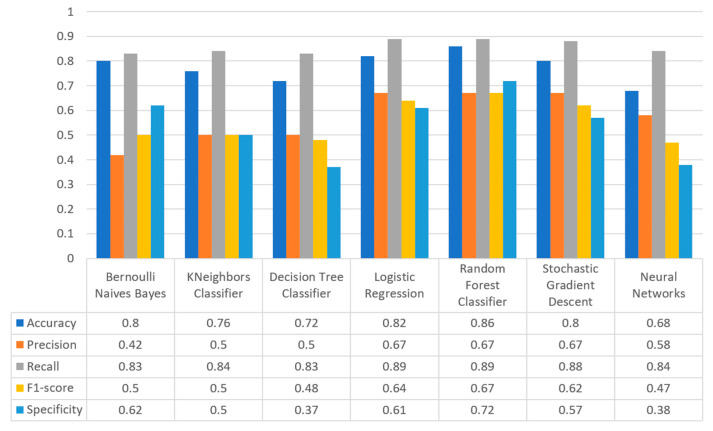
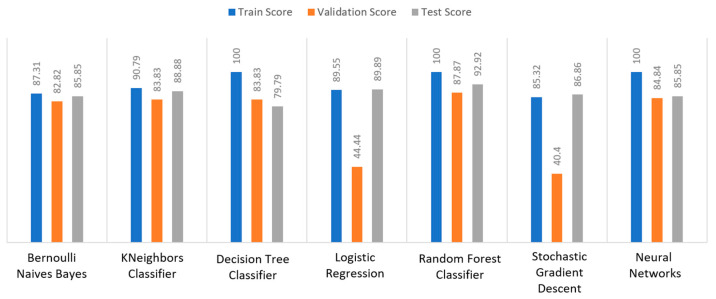
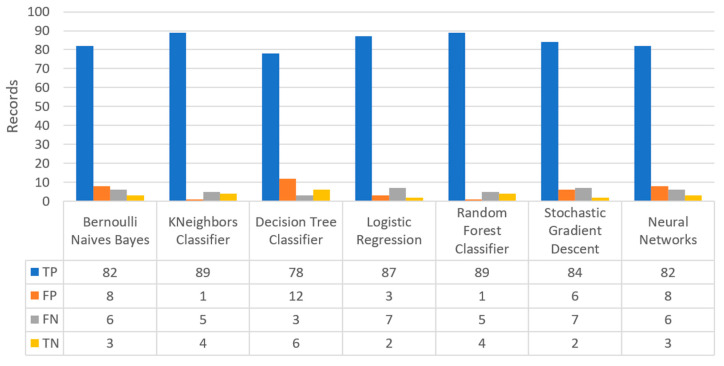
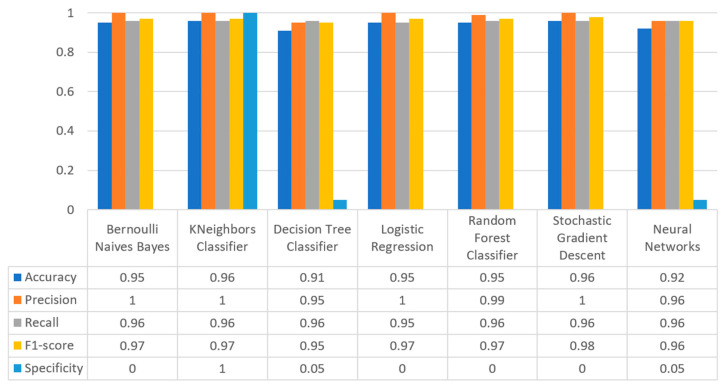
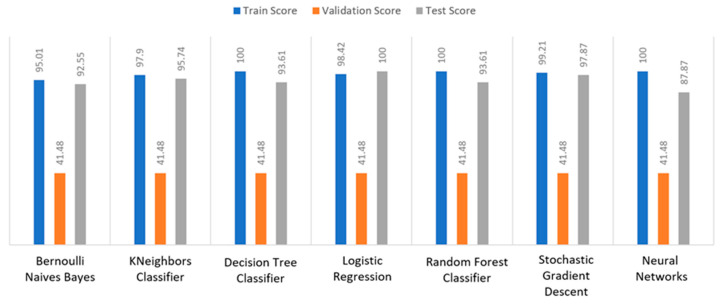
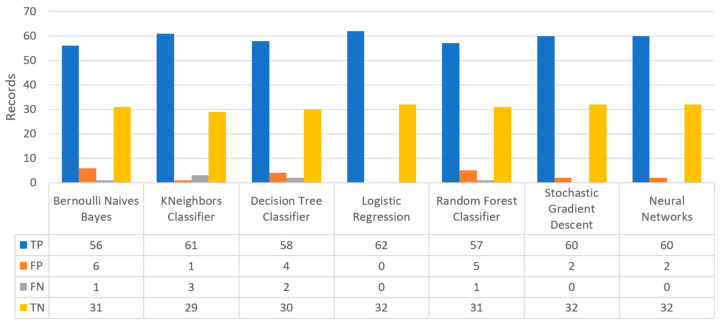
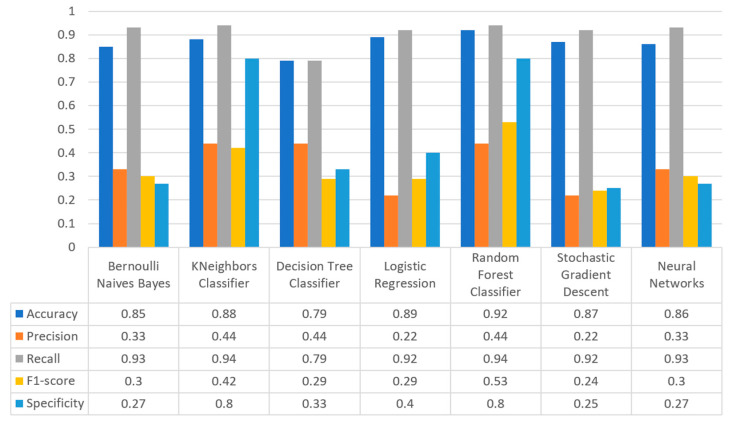
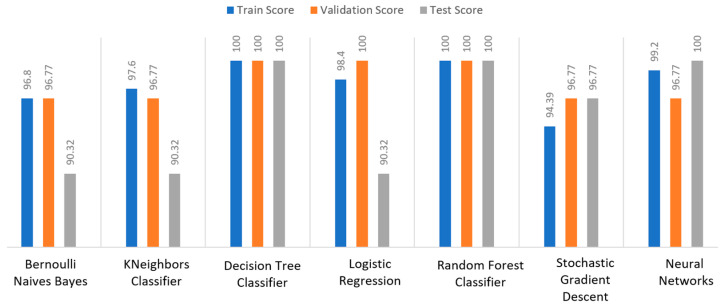
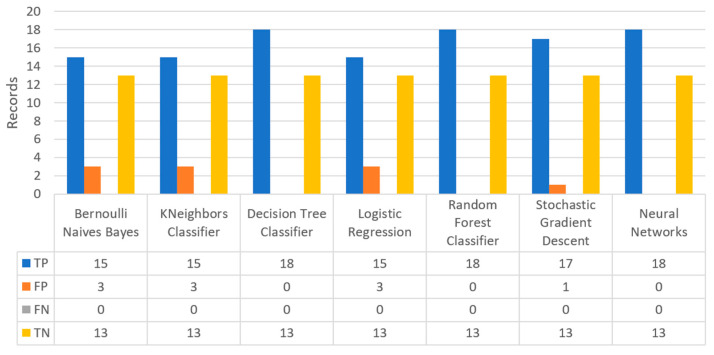
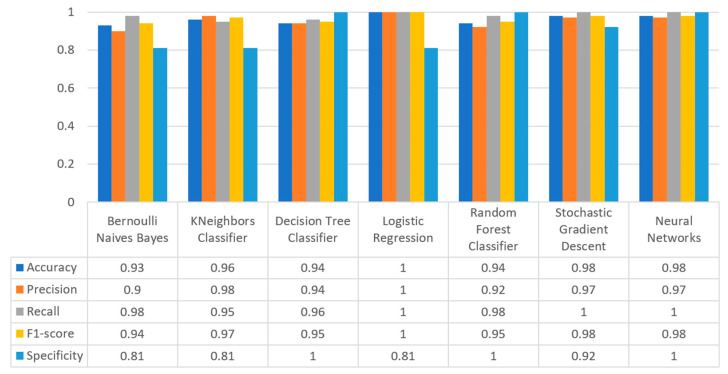
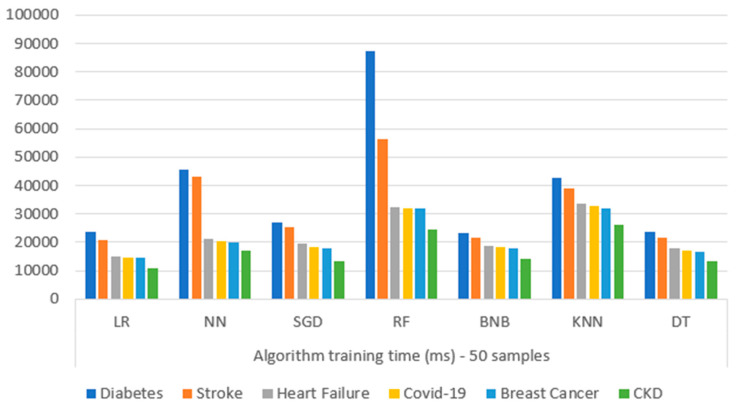
Extracting useful knowledge from proper data analysis is a very challenging task for efficient and timely decision-making. To achieve this, there exist a plethora of machine learning (ML) algorithms, while, especially in healthcare, this complexity increases due to the domain's requirements for analytics-based risk predictions. This manuscript proposes a data analysis mechanism experimented in diverse healthcare scenarios, towards constructing a catalogue of the most efficient ML algorithms to be used depending on the healthcare scenario's requirements and datasets, for efficiently predicting the onset of a disease. To this context, seven (7) different ML algorithms (Naïve Bayes, K-Nearest Neighbors, Decision Tree, Logistic Regression, Random Forest, Neural Networks, Stochastic Gradient Descent) have been executed on top of diverse healthcare scenarios (stroke, COVID-19, diabetes, breast cancer, kidney disease, heart failure). Based on a variety of performance metrics (accuracy, recall, precision, F1-score, specificity, confusion matrix), it has been identified that a sub-set of ML algorithms are more efficient for timely predictions under specific healthcare scenarios, and that is why the envisioned ML catalogue prioritizes the ML algorithms to be used, depending on the scenarios' nature and needed metrics. Further evaluation must be performed considering additional scenarios, involving state-of-the-art techniques (e.g., cloud deployment, federated ML) for improving the mechanism's efficiency.
Keywords: catalogue; data analysis; healthcare; machine learning; prediction; supervised learning.
Conflict of interest statement
The authors declare no conflict of interest.
Figures


Similar articles
-
Application of supervised machine learning algorithms for classification and prediction of type-2 diabetes disease status in Afar regional state, Northeastern Ethiopia 2021.Sci Rep. 2023 May 13;13(1):7779. doi: 10.1038/s41598-023-34906-1. Sci Rep. 2023. PMID: 37179444 Free PMC article.
-
Efficient Prediction of Missed Clinical Appointment Using Machine Learning.Comput Math Methods Med. 2021 Oct 22;2021:2376391. doi: 10.1155/2021/2376391. eCollection 2021. Comput Math Methods Med. 2021. Retraction in: Comput Math Methods Med. 2023 Aug 2;2023:9795312. doi: 10.1155/2023/9795312. PMID: 34721656 Free PMC article. Retracted.
-
Which supervised machine learning algorithm can best predict achievement of minimum clinically important difference in neck pain after surgery in patients with cervical myelopathy? A QOD study.Neurosurg Focus. 2023 Jun;54(6):E5. doi: 10.3171/2023.3.FOCUS2372. Neurosurg Focus. 2023. PMID: 37283449
-
Involvement of Machine Learning Tools in Healthcare Decision Making.J Healthc Eng. 2021 Jan 27;2021:6679512. doi: 10.1155/2021/6679512. eCollection 2021. J Healthc Eng. 2021. PMID: 33575021 Free PMC article. Review.
-
In-depth evaluation of machine learning methods for semi-automating article screening in a systematic review of mechanistic literature.Res Synth Methods. 2023 Mar;14(2):156-172. doi: 10.1002/jrsm.1589. Epub 2022 Jul 23. Res Synth Methods. 2023. PMID: 35798691
Cited by
-
Risk Prediction Model for Chronic Kidney Disease in Thailand Using Artificial Intelligence and SHAP.Diagnostics (Basel). 2023 Nov 28;13(23):3548. doi: 10.3390/diagnostics13233548. Diagnostics (Basel). 2023. PMID: 38066789 Free PMC article.
-
Unlocking stroke prediction: Harnessing projection-based statistical feature extraction with ML algorithms.Heliyon. 2024 Mar 6;10(5):e27411. doi: 10.1016/j.heliyon.2024.e27411. eCollection 2024 Mar 15. Heliyon. 2024. PMID: 38495193 Free PMC article.
-
Special Issue: "Intelligent Systems for Clinical Care and Remote Patient Monitoring".Sensors (Basel). 2023 Sep 20;23(18):7993. doi: 10.3390/s23187993. Sensors (Basel). 2023. PMID: 37766047 Free PMC article.
-
Going paperless - Qualitative monitoring of staff morale during the transition from paper to electronic health records.Heliyon. 2023 Oct 4;9(10):e20645. doi: 10.1016/j.heliyon.2023.e20645. eCollection 2023 Oct. Heliyon. 2023. PMID: 37867851 Free PMC article.
-
Prediction models for COVID-19 disease outcomes.Emerg Microbes Infect. 2024 Dec;13(1):2361791. doi: 10.1080/22221751.2024.2361791. Epub 2024 Jun 14. Emerg Microbes Infect. 2024. PMID: 38828796 Free PMC article.
References
-
- Power D.J., Sharda R., Burstein F. Decision Support Systems. John Wiley & Sons, Ltd.; Hoboken, NJ, USA: 2015.
-
- Zantalis F., Koulouras G., Karabetsos S., Kandris D. A review of machine learning and IoT in smart transportation. Future Internet. 2019;11:94. doi: 10.3390/fi11040094. - DOI
-
- Dixon M.F., Halperin I., Bilokon P. Machine Learning in Finance. Volume 1406 Springer; New York, NY, USA: 2020.
MeSH terms
LinkOut - more resources
Full Text Sources
Medical
