

Rapid Detection of Fraudulent Rice Using Low-Cost Digital Sensing Devices and Machine Learning
- PMID: 36433249
- PMCID: PMC9697730
- DOI: 10.3390/s22228655
Rapid Detection of Fraudulent Rice Using Low-Cost Digital Sensing Devices and Machine Learning
Abstract
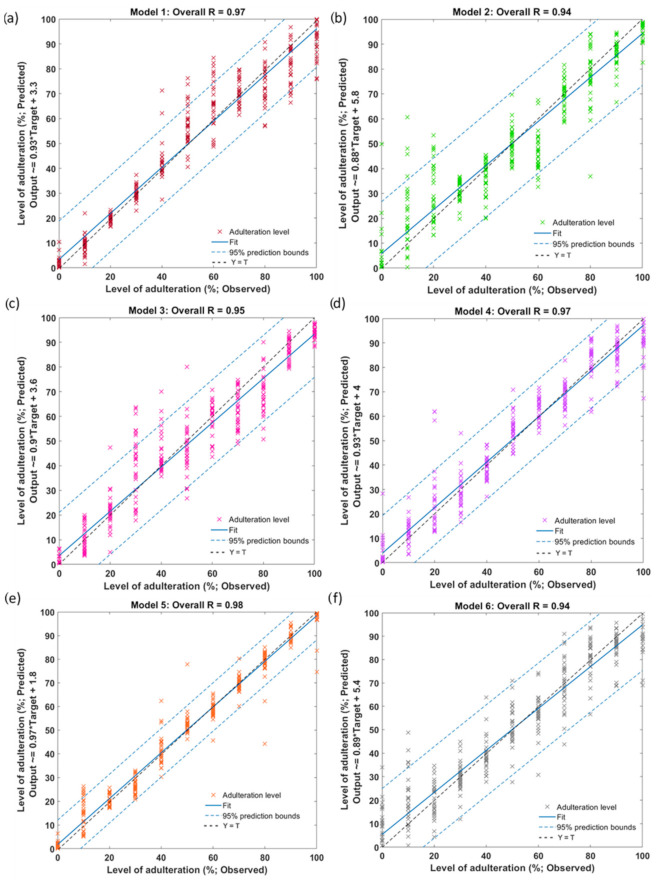
Rice fraud is one of the common threats to the rice industry. Conventional methods to detect rice adulteration are costly, time-consuming, and tedious. This study proposes the quantitative prediction of rice adulteration levels measured through the packaging using a handheld near-infrared (NIR) spectrometer and electronic nose (e-nose) sensors measuring directly on samples and paired with machine learning (ML) algorithms. For these purposes, the samples were prepared by mixing rice at different ratios from 0% to 100% with a 10% increment based on the rice's weight, consisting of (i) rice from different origins, (ii) premium with regular rice, (iii) aromatic with non-aromatic, and (iv) organic with non-organic rice. Multivariate data analysis was used to explore the sample distribution and its relationship with the e-nose sensors for parameter engineering before ML modeling. Artificial neural network (ANN) algorithms were used to predict the adulteration levels of the rice samples using the e-nose sensors and NIR absorbances readings as inputs. Results showed that both sensing devices could detect rice adulteration at different mixing ratios with high correlation coefficients through direct (e-nose; R = 0.94-0.98) and non-invasive measurement through the packaging (NIR; R = 0.95-0.98). The proposed method uses low-cost, rapid, and portable sensing devices coupled with ML that have shown to be reliable and accurate to increase the efficiency of rice fraud detection through the rice production chain.
Keywords: adulteration; artificial intelligence; electronic nose; food fraud; near-infrared; sensor.
Conflict of interest statement
The authors declare no conflict of interest.
Figures


References
-
- Viinikainen T. Food frauds—Intention, detection and management. In: Markus L., Cornelia B., Isabella A., Dharmapuri S., editors. Food Safety Technical Toolkit for Asia and the Pacific. FAO; Bangkok, Thailand: 2021.
-
- Macready A.L., Hieke S., Klimczuk-Kochańska M., Szumiał S., Vranken L., Grunert K.G. Consumer trust in the food value chain and its impact on consumer confidence: A model for assessing consumer trust and evidence from a 5-country study in Europe. Food Policy. 2020;92:101880. doi: 10.1016/j.foodpol.2020.101880. - DOI
-
- Śliwińska-Bartel M., Burns D.T., Elliott C. Rice fraud a global problem: A review of analytical tools to detect species, country of origin and adulterations. Trends Food Sci. Technol. 2021;116:36–46. doi: 10.1016/j.tifs.2021.06.042. - DOI
-
- Peijin T., Kevin L.J., Tingting W., Elejalde U., Hongchao Z., Yuanrong J., Wenming C. Rapid identification of the variety and geographical origin of Wuyou No.4 rice by fourier transform near-infrared spectroscopy coupled with chemometrics. J. Cereal Sci. 2021;102:103322. doi: 10.1016/j.jcs.2021.103322. - DOI
MeSH terms
LinkOut - more resources
Full Text Sources
Miscellaneous
