

Application of Edge Computing in Structural Health Monitoring of Simply Supported PCI Girder Bridges
- PMID: 36433306
- PMCID: PMC9698580
- DOI: 10.3390/s22228711
Application of Edge Computing in Structural Health Monitoring of Simply Supported PCI Girder Bridges
Abstract
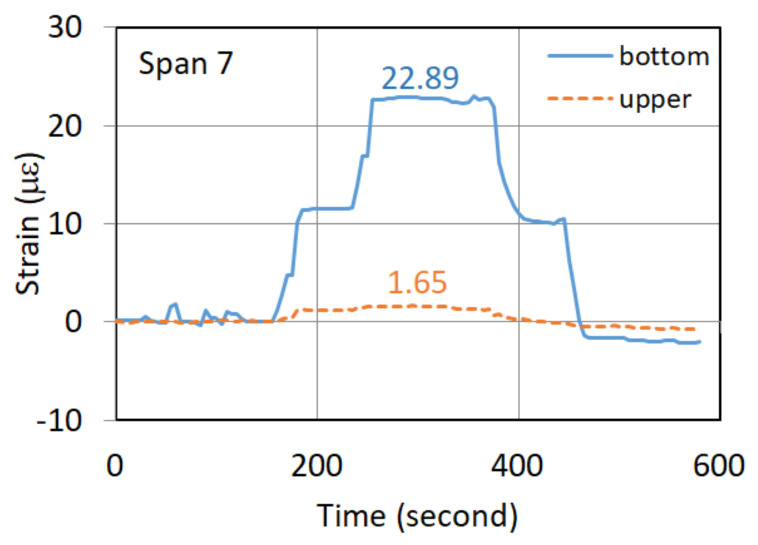
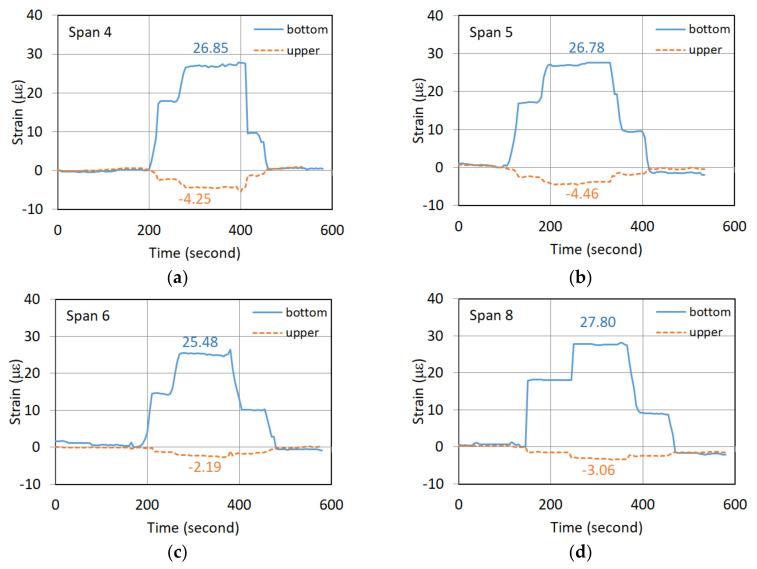
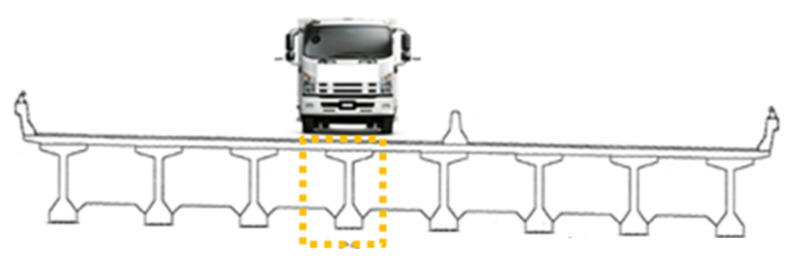
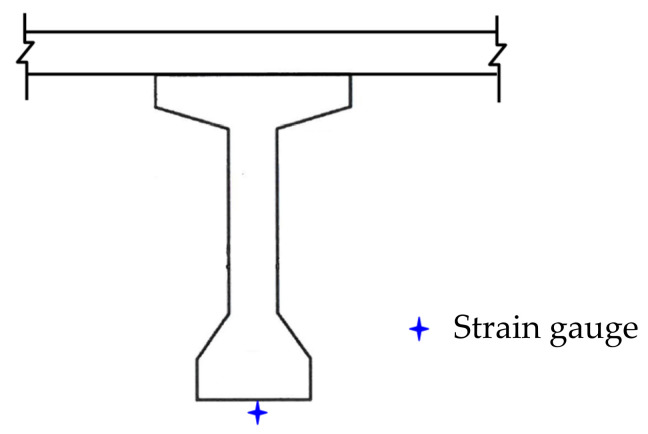
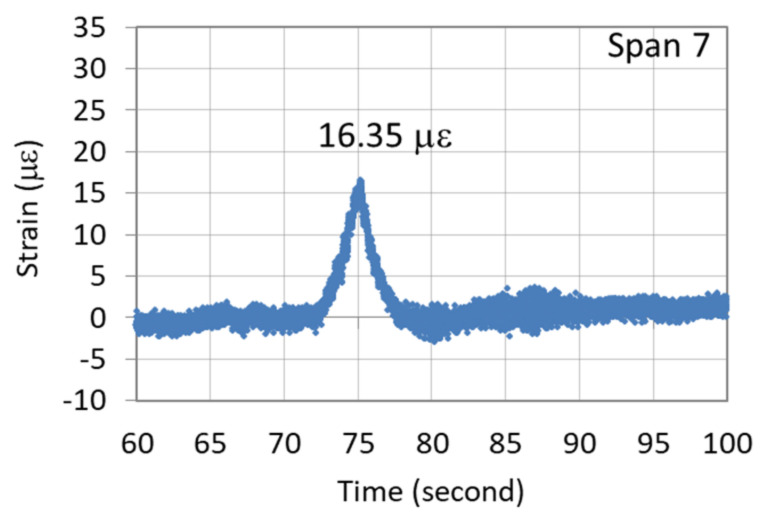
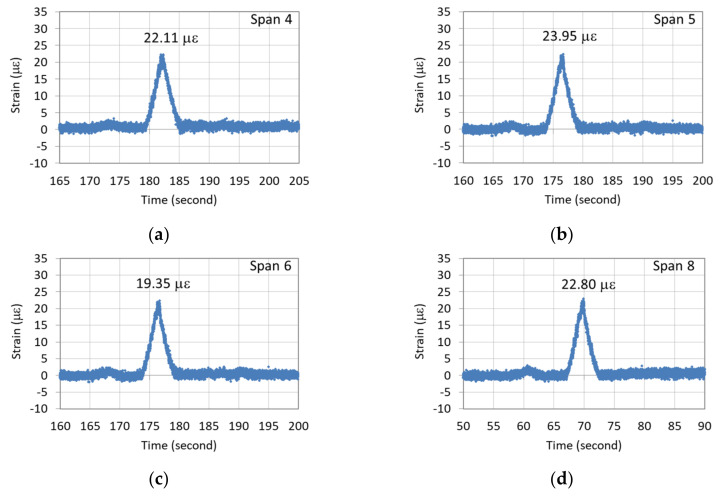
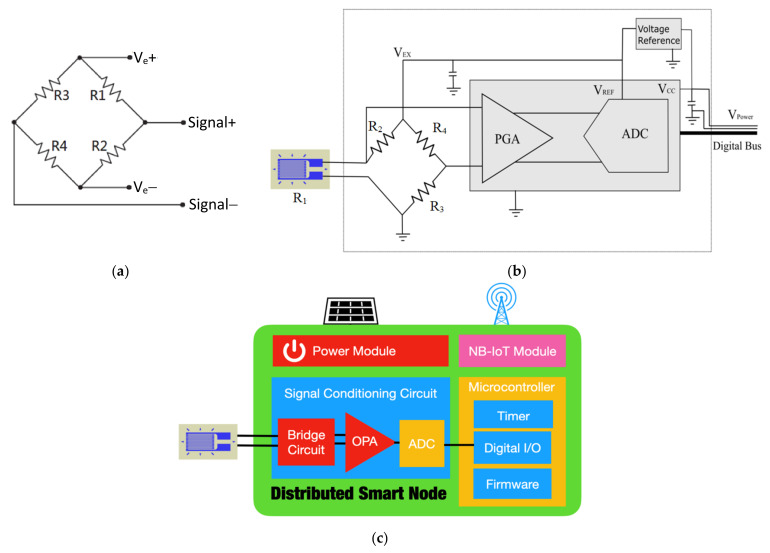
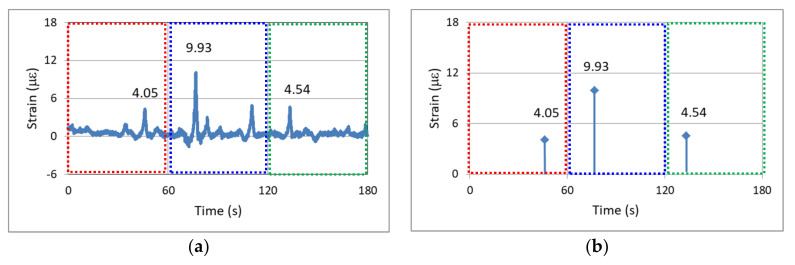
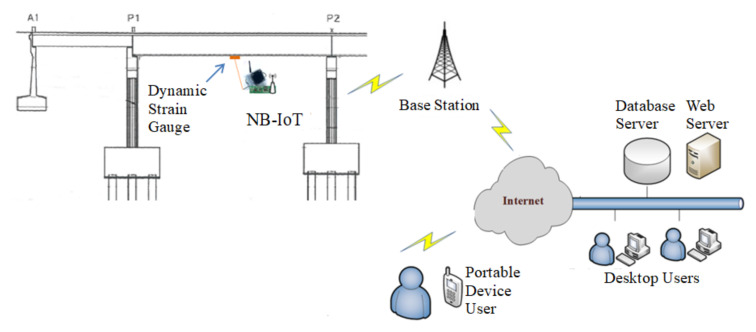
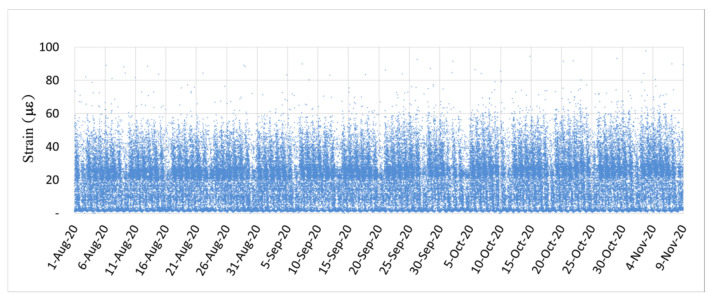
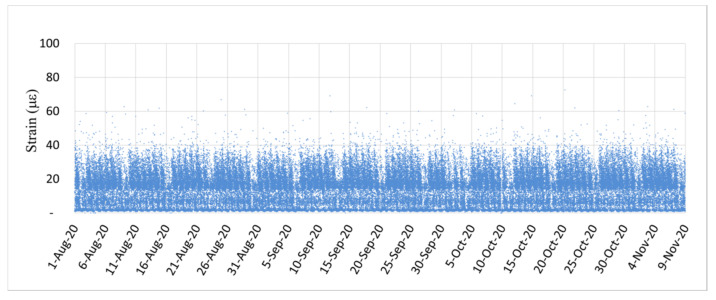
This study proposes an innovative method for structural health monitoring of simply supported PCI girder bridges based on dynamic strain and edge computing. Field static and dynamic load tests were conducted on a bridge consisting of a span with newly replaced PCI girders and numerous spans with old PCI girders. Both the static and dynamic test results showed that the flexural rigidity of the old PCI girders decreased significantly due to deterioration. To improve the efficiency of on-site monitoring data transmission and data analysis, this study developed a smart dynamic strain gauge node with the function of edge computing. Continuous data with a sampling frequency of 100 Hz were computed at the sensor node. Among the computed results, only the maximum dynamic strain data caused by the passage of the heaviest vehicle within 1 min were transmitted. The on-site monitoring results indicated that under routine traffic conditions, the dynamic strain response of the new PCI girder was smaller than that of the deteriorated PCI girder. When the monitored dynamic strain response has a tendency to magnify, attention should be paid to the potential prestress loss or other deterioration behaviors of the bridge.
Keywords: dynamic strains; edge computing; flexural rigidity; prestressed concrete I girders; structural health monitoring.
Conflict of interest statement
The authors declare no conflict of interest.
Figures

Similar articles
-
Application of Multi-Channel Synchronized Dynamic Strain Gauges in Monitoring the Neutral Axis Position and Prestress Loss of Box Girder Bridges.Sensors (Basel). 2024 May 28;24(11):3489. doi: 10.3390/s24113489. Sensors (Basel). 2024. PMID: 38894279 Free PMC article.
-
Experimental-Numerical Study on the Flexural Ultimate Capacity of Prestressed Concrete Box Girders Subjected to Collision.Materials (Basel). 2022 Jun 1;15(11):3949. doi: 10.3390/ma15113949. Materials (Basel). 2022. PMID: 35683246 Free PMC article.
-
Flexural Behavior of Damaged Hollow RC Box Girders Repaired with Prestressed CFRP.Materials (Basel). 2023 Apr 24;16(9):3338. doi: 10.3390/ma16093338. Materials (Basel). 2023. PMID: 37176220 Free PMC article.
-
Synthesis of Repair Materials and Methods for Reinforced Concrete and Prestressed Bridge Girders.Materials (Basel). 2020 Sep 14;13(18):4079. doi: 10.3390/ma13184079. Materials (Basel). 2020. PMID: 32937848 Free PMC article. Review.
-
Advances in the Structural Health Monitoring of Bridges Using Piezoelectric Transducers.Sensors (Basel). 2018 Dec 7;18(12):4312. doi: 10.3390/s18124312. Sensors (Basel). 2018. PMID: 30544485 Free PMC article. Review.
Cited by
-
Application of Multi-Channel Synchronized Dynamic Strain Gauges in Monitoring the Neutral Axis Position and Prestress Loss of Box Girder Bridges.Sensors (Basel). 2024 May 28;24(11):3489. doi: 10.3390/s24113489. Sensors (Basel). 2024. PMID: 38894279 Free PMC article.
References
-
- Chang P.C., Flatau A., Liu S.C. Review Paper: Health Monitoring of Civil Infrastructure. Struct. Health Monit. 2003;2:257–267. doi: 10.1177/1475921703036169. - DOI
-
- Gasco F., Feraboli P., Braun J., Smith J., Stickler P., DeOto L. Wireless strain measurement for structural testing and health monitoring of carbon fiber composites. Compos. Part A. 2011;42:1263–1274. doi: 10.1016/j.compositesa.2011.05.008. - DOI
MeSH terms
Grants and funding
LinkOut - more resources
Full Text Sources
Miscellaneous
