

Interpretable Machine Learning for Inpatient COVID-19 Mortality Risk Assessments: Diabetes Mellitus Exclusive Interplay
- PMID: 36433354
- PMCID: PMC9692305
- DOI: 10.3390/s22228757
Interpretable Machine Learning for Inpatient COVID-19 Mortality Risk Assessments: Diabetes Mellitus Exclusive Interplay
Abstract
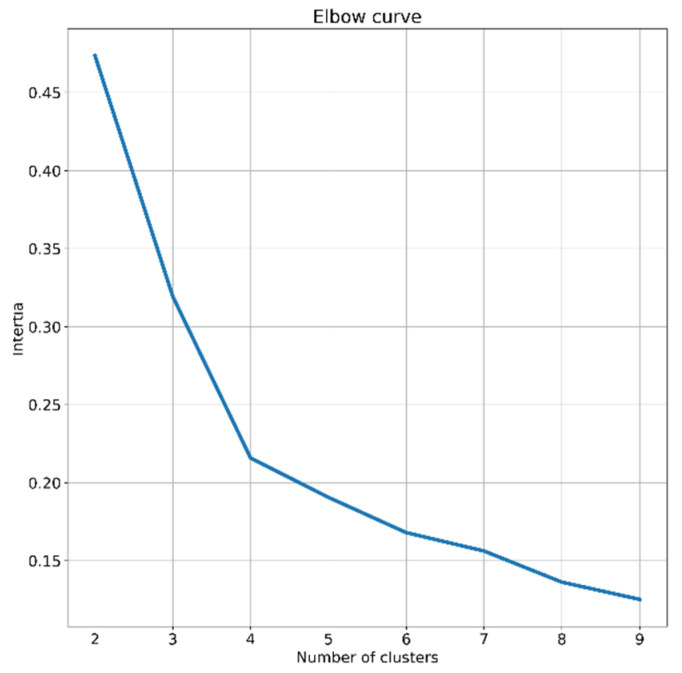
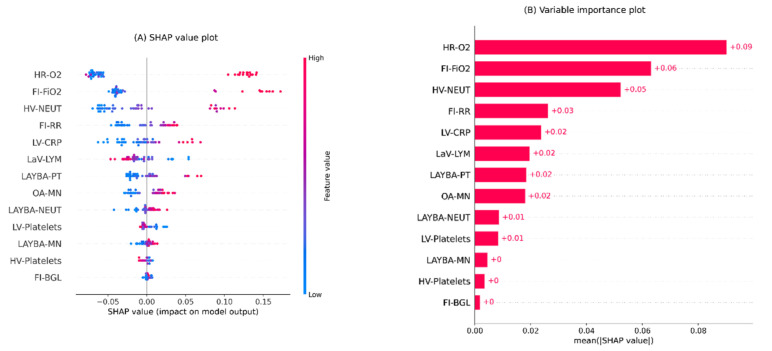
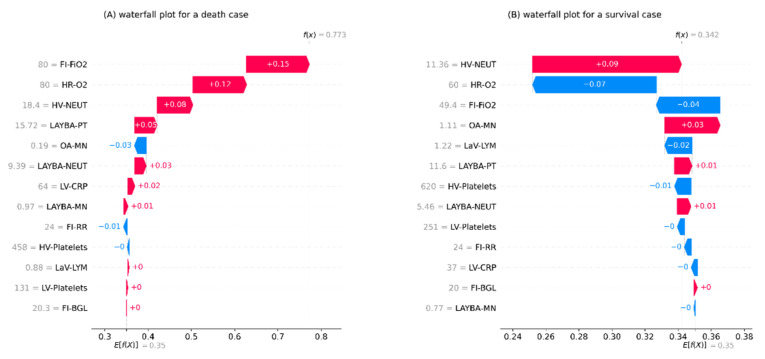
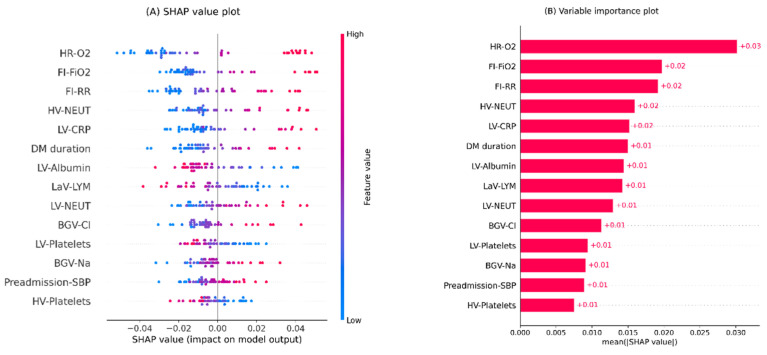
People with diabetes mellitus (DM) are at elevated risk of in-hospital mortality from coronavirus disease-2019 (COVID-19). This vulnerability has spurred efforts to pinpoint distinctive characteristics of COVID-19 patients with DM. In this context, the present article develops ML models equipped with interpretation modules for inpatient mortality risk assessments of COVID-19 patients with DM. To this end, a cohort of 156 hospitalised COVID-19 patients with pre-existing DM is studied. For creating risk assessment platforms, this work explores a pool of historical, on-admission, and during-admission data that are DM-related or, according to preliminary investigations, are exclusively attributed to the COVID-19 susceptibility of DM patients. First, a set of careful pre-modelling steps are executed on the clinical data, including cleaning, pre-processing, subdivision, and feature elimination. Subsequently, standard machine learning (ML) modelling analysis is performed on the cured data. Initially, a classifier is tasked with forecasting COVID-19 fatality from selected features. The model undergoes thorough evaluation analysis. The results achieved substantiate the efficacy of the undertaken data curation and modelling steps. Afterwards, SHapley Additive exPlanations (SHAP) technique is assigned to interpret the generated mortality risk prediction model by rating the predictors' global and local influence on the model's outputs. These interpretations advance the comprehensibility of the analysis by explaining the formation of outcomes and, in this way, foster the adoption of the proposed methodologies. Next, a clustering algorithm demarcates patients into four separate groups based on their SHAP values, providing a practical risk stratification method. Finally, a re-evaluation analysis is performed to verify the robustness of the proposed framework.
Keywords: COVID-19; SHAP; diabetes mellitus; machine learning.
Conflict of interest statement
The authors declare that they have no known competing financial interest or personal relationships that could have appeared to influence the work reported in this paper.
Figures
Similar articles
-
COVID-19 mortality risk assessments for individuals with and without diabetes mellitus: Machine learning models integrated with interpretation framework.Comput Biol Med. 2022 May;144:105361. doi: 10.1016/j.compbiomed.2022.105361. Epub 2022 Mar 2. Comput Biol Med. 2022. PMID: 35255295 Free PMC article.
-
Predicting 1-year mortality of patients with diabetes mellitus in Kazakhstan based on administrative health data using machine learning.Sci Rep. 2023 May 24;13(1):8412. doi: 10.1038/s41598-023-35551-4. Sci Rep. 2023. PMID: 37225754 Free PMC article.
-
Prediction of Online Psychological Help-Seeking Behavior During the COVID-19 Pandemic: An Interpretable Machine Learning Method.Front Public Health. 2022 Mar 3;10:814366. doi: 10.3389/fpubh.2022.814366. eCollection 2022. Front Public Health. 2022. PMID: 35309216 Free PMC article.
-
Prediction of in-hospital mortality with machine learning for COVID-19 patients treated with steroid and remdesivir.J Med Virol. 2022 Mar;94(3):958-964. doi: 10.1002/jmv.27393. Epub 2021 Oct 22. J Med Virol. 2022. PMID: 34647622 Free PMC article. Review.
-
Impact of diabetes mellitus on in-hospital mortality in adult patients with COVID-19: a systematic review and meta-analysis.Acta Diabetol. 2021 Aug;58(8):1101-1110. doi: 10.1007/s00592-021-01701-1. Epub 2021 Mar 20. Acta Diabetol. 2021. PMID: 33778910 Free PMC article.
Cited by
-
Data-driven blood glucose level prediction in type 1 diabetes: a comprehensive comparative analysis.Sci Rep. 2024 Sep 19;14(1):21863. doi: 10.1038/s41598-024-70277-x. Sci Rep. 2024. PMID: 39300118 Free PMC article.
-
In Vitro Glucose Measurement from NIR and MIR Spectroscopy: Comprehensive Benchmark of Machine Learning and Filtering Chemometrics.Heliyon. 2024 May 9;10(10):e30981. doi: 10.1016/j.heliyon.2024.e30981. eCollection 2024 May 30. Heliyon. 2024. PMID: 38778952 Free PMC article.
-
Application of Isokinetic Dynamometry Data in Predicting Gait Deviation Index Using Machine Learning in Stroke Patients: A Cross-Sectional Study.Sensors (Basel). 2024 Nov 13;24(22):7258. doi: 10.3390/s24227258. Sensors (Basel). 2024. PMID: 39599035 Free PMC article.
-
Machine learning based prediction models for the prognosis of COVID-19 patients with DKA.Sci Rep. 2025 Jan 21;15(1):2633. doi: 10.1038/s41598-025-85357-9. Sci Rep. 2025. PMID: 39837852 Free PMC article.
-
Feature Identification Using Interpretability Machine Learning Predicting Risk Factors for Disease Severity of In-Patients with COVID-19 in South Florida.Diagnostics (Basel). 2024 Aug 26;14(17):1866. doi: 10.3390/diagnostics14171866. Diagnostics (Basel). 2024. PMID: 39272651 Free PMC article.
References
-
- Zhou K., Sun Y., Li L., Zang Z., Wang J., Li J., Liang J., Zhang F., Zhang Q., Ge W., et al. Eleven Routine Clinical Features Predict COVID-19 Severity Uncovered by Machine Learning of Longitudinal Measurements. Comput. Struct. Biotechnol. J. 2021;19:3640–3649. doi: 10.1016/j.csbj.2021.06.022. - DOI - PMC - PubMed
-
- Wargny M., Potier L., Gourdy P., Pichelin M., Amadou C., Benhamou P.-Y., Bonnet J.-B., Bordier L., Bourron O., Chaumeil C., et al. Predictors of Hospital Discharge and Mortality in Patients with Diabetes and COVID-19: Updated Results from the Nationwide CORONADO Study. Diabetologia. 2021;64:778–794. doi: 10.1007/s00125-020-05351-w. - DOI - PMC - PubMed
-
- Sourij H., Aziz F., Bräuer A., Ciardi C., Clodi M., Fasching P., Karolyi M., Kautzky-Willer A., Klammer C., Malle O., et al. COVID-19 Fatality Prediction in People with Diabetes and Prediabetes Using a Simple Score upon Hospital Admission. Diabetes Obes. Metab. 2021;23:589–598. doi: 10.1111/dom.14256. - DOI - PMC - PubMed
-
- Corona G., Pizzocaro A., Vena W., Rastrelli G., Semeraro F., Isidori A.M., Pivonello R., Salonia A., Sforza A., Maggi M. Diabetes Is Most Important Cause for Mortality in COVID-19 Hospitalized Patients: Systematic Review and Meta-Analysis. Rev. Endocr. Metab. Disord. 2021;22:275–296. doi: 10.1007/s11154-021-09630-8. - DOI - PMC - PubMed
MeSH terms
LinkOut - more resources
Full Text Sources
Medical
