

Frequency Mixing Magnetic Detection Setup Employing Permanent Ring Magnets as a Static Offset Field Source
- PMID: 36433383
- PMCID: PMC9694433
- DOI: 10.3390/s22228776
Frequency Mixing Magnetic Detection Setup Employing Permanent Ring Magnets as a Static Offset Field Source
Abstract
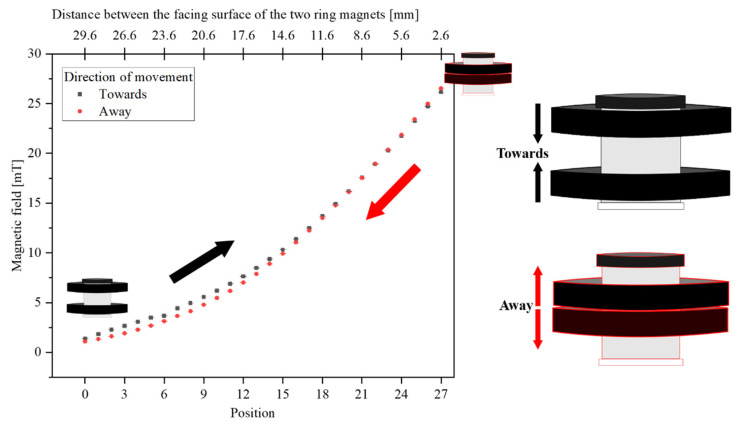
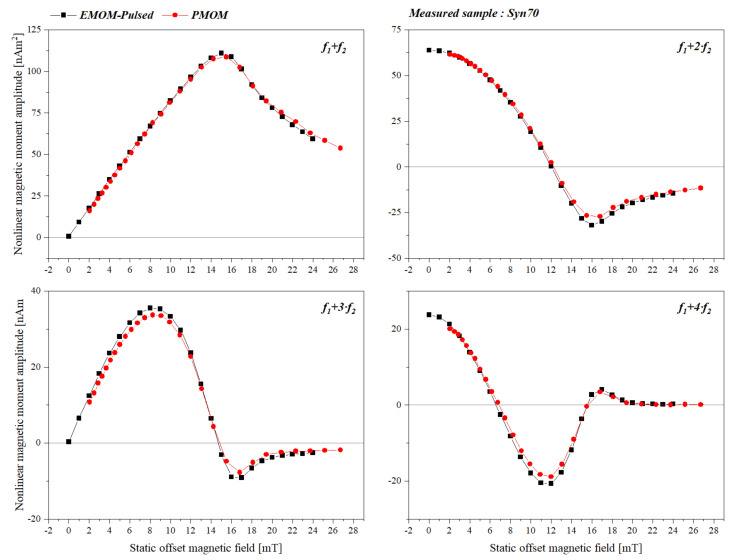
Frequency mixing magnetic detection (FMMD) has been explored for its applications in fields of magnetic biosensing, multiplex detection of magnetic nanoparticles (MNP) and the determination of core size distribution of MNP samples. Such applications rely on the application of a static offset magnetic field, which is generated traditionally with an electromagnet. Such a setup requires a current source, as well as passive or active cooling strategies, which directly sets a limitation based on the portability aspect that is desired for point of care (POC) monitoring applications. In this work, a measurement head is introduced that involves the utilization of two ring-shaped permanent magnets to generate a static offset magnetic field. A steel cylinder in the ring bores homogenizes the field. By variation of the distance between the ring magnets and of the thickness of the steel cylinder, the magnitude of the magnetic field at the sample position can be adjusted. Furthermore, the measurement setup is compared to the electromagnet offset module based on measured signals and temperature behavior.
Keywords: biosensors; frequency mixing magnetic detection; magnetic nanoparticles; magnetic sensors.
Conflict of interest statement
The authors declare no conflict of interest. The funders had no role in the design of the study; in the collection, analyses or interpretation of data; in the writing of the manuscript; or in the decision to publish the results.
Figures


Similar articles
-
Fundamentals and Applications of Dual-Frequency Magnetic Particle Spectroscopy: Review for Biomedicine and Materials Characterization.Adv Sci (Weinh). 2025 Apr;12(13):e2416838. doi: 10.1002/advs.202416838. Epub 2025 Feb 22. Adv Sci (Weinh). 2025. PMID: 39985275 Free PMC article. Review.
-
Multiplex Detection of Magnetic Beads Using Offset Field Dependent Frequency Mixing Magnetic Detection.Sensors (Basel). 2021 Aug 31;21(17):5859. doi: 10.3390/s21175859. Sensors (Basel). 2021. PMID: 34502749 Free PMC article.
-
Design of a mobile, homogeneous, and efficient electromagnet with a large field of view for neonatal low-field MRI.MAGMA. 2016 Aug;29(4):691-8. doi: 10.1007/s10334-016-0525-8. Epub 2016 Feb 9. MAGMA. 2016. PMID: 26861046 Free PMC article.
-
Spatial Manipulation of Particles and Cells at Micro- and Nanoscale via Magnetic Forces.Cells. 2022 Mar 10;11(6):950. doi: 10.3390/cells11060950. Cells. 2022. PMID: 35326401 Free PMC article. Review.
-
Frequency Mixing Magnetic Detection Scanner for Imaging Magnetic Particles in Planar Samples.J Vis Exp. 2016 Jun 9;(112):53869. doi: 10.3791/53869. J Vis Exp. 2016. PMID: 27341085 Free PMC article.
Cited by
-
Versatile and Accessible Magnetic Diagnosis Platform with Different Types of Magnetic Particles for Liquid and Solid Biopsies.Int J Mol Sci. 2023 Jun 20;24(12):10363. doi: 10.3390/ijms241210363. Int J Mol Sci. 2023. PMID: 37373510 Free PMC article.
-
Impact of Particle Size on the Nonlinear Magnetic Response of Iron Oxide Nanoparticles during Frequency Mixing Magnetic Detection.Sensors (Basel). 2024 Jun 29;24(13):4223. doi: 10.3390/s24134223. Sensors (Basel). 2024. PMID: 39001003 Free PMC article.
-
Key Contributors to Signal Generation in Frequency Mixing Magnetic Detection (FMMD): An In Silico Study.Sensors (Basel). 2024 Mar 18;24(6):1945. doi: 10.3390/s24061945. Sensors (Basel). 2024. PMID: 38544208 Free PMC article.
-
Miniaturized Pathogen Detection System Using Magnetic Nanoparticles and Microfluidics Technology.Micromachines (Basel). 2024 Oct 20;15(10):1272. doi: 10.3390/mi15101272. Micromachines (Basel). 2024. PMID: 39459146 Free PMC article.
-
Fundamentals and Applications of Dual-Frequency Magnetic Particle Spectroscopy: Review for Biomedicine and Materials Characterization.Adv Sci (Weinh). 2025 Apr;12(13):e2416838. doi: 10.1002/advs.202416838. Epub 2025 Feb 22. Adv Sci (Weinh). 2025. PMID: 39985275 Free PMC article. Review.
References
-
- Rezvani Jalal N., Mehrbod P., Shojaei S., Labouta H.I., Mokarram P., Afkhami A., Madrakian T., Los M.J., Schaafsma D., Giersig M., et al. Magnetic Nanomaterials in Microfluidic Sensors for Virus Detection: A Review. ACS Appl. Nano Mater. 2021;4:4307–4328. doi: 10.1021/acsanm.1c01077. - DOI
-
- Herynek V., Babič M., Kaman O., Charvátová H., Veselá M., Šefc L. Development of Novel Nanoparticles for MPI. Int. J. Magn. Part. Imaging. 2020;6:2009019. doi: 10.18416/IJMPI.2020.2009019. - DOI
-
- AbouSeada N., Ahmed M.A., Elmahgary M.G. Synthesis and Characterization of Novel Magnetic Nanoparticles for Photocatalytic Degradation of Indigo Carmine Dye. Mater. Sci. Energy Technol. 2022;5:116–124. doi: 10.1016/j.mset.2022.01.001. - DOI
MeSH terms
Substances
Grants and funding
LinkOut - more resources
Full Text Sources
