. 2023 Jan;113(2):225-245.
doi: 10.1111/tpj.16042. Epub 2022 Dec 17.

A genome-wide association study identifies novel players in Na and Fe homeostasis in Arabidopsis thaliana under alkaline-salinity stress

Affiliations

A genome-wide association study identifies novel players in Na and Fe homeostasis in Arabidopsis thaliana under alkaline-salinity stress

Maria Jose Almira Casellas et al. Plant J. 2023 Jan.

Abstract

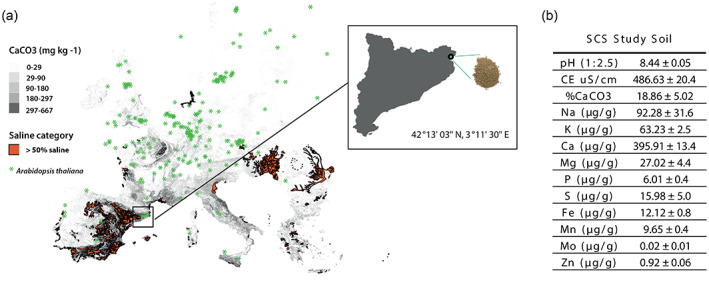
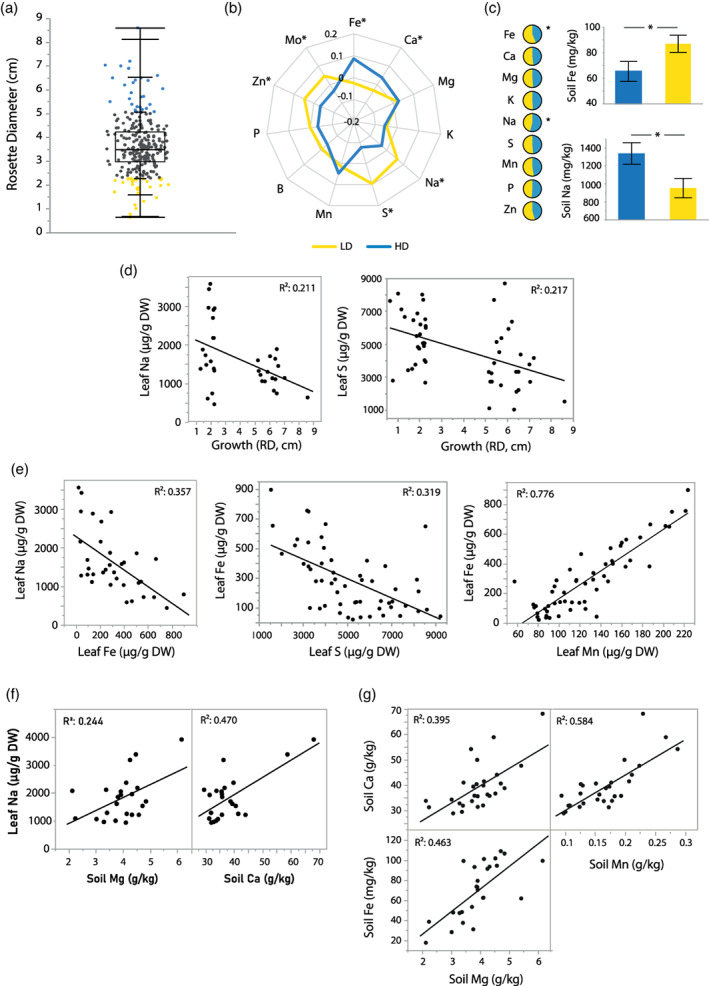
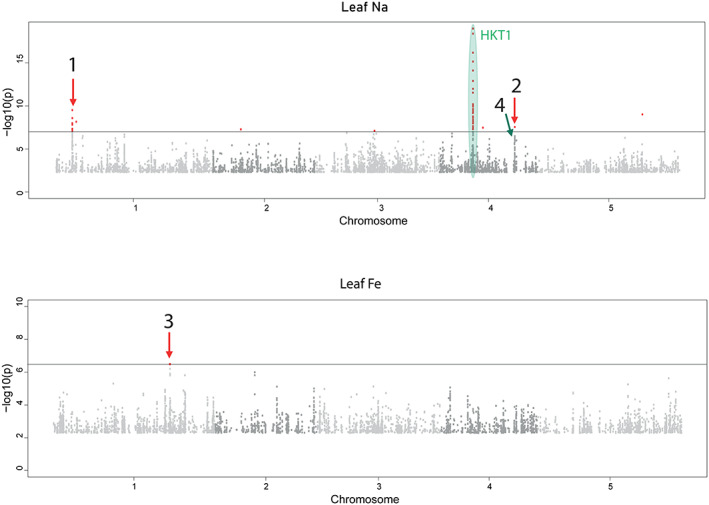
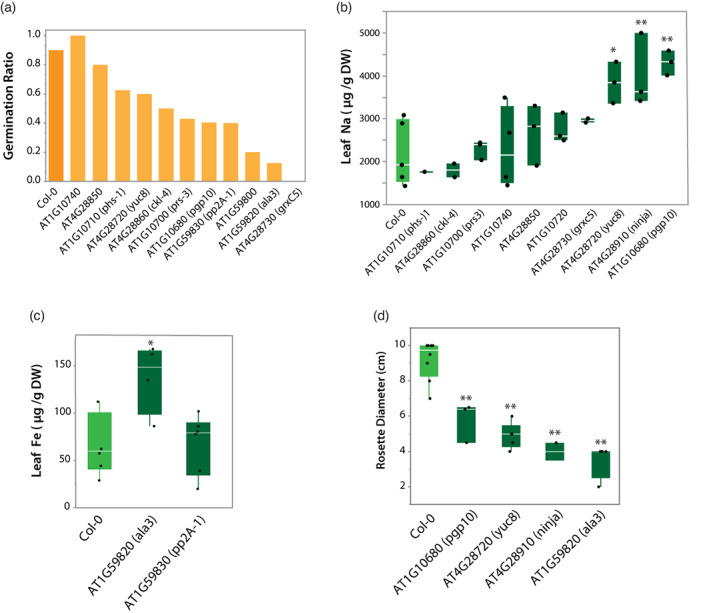
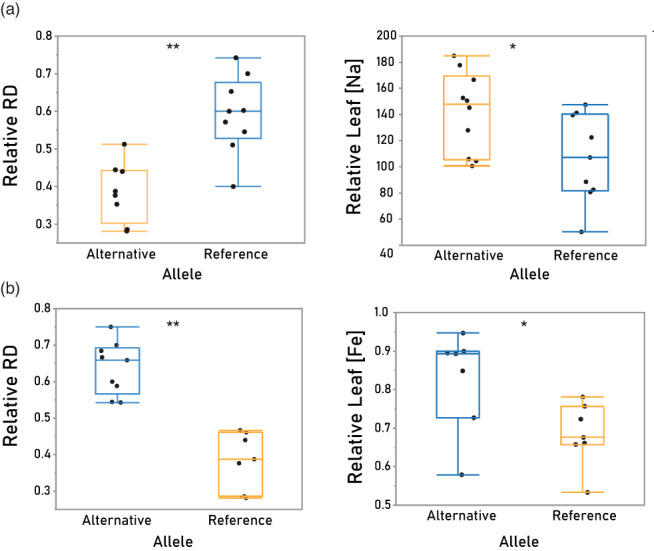
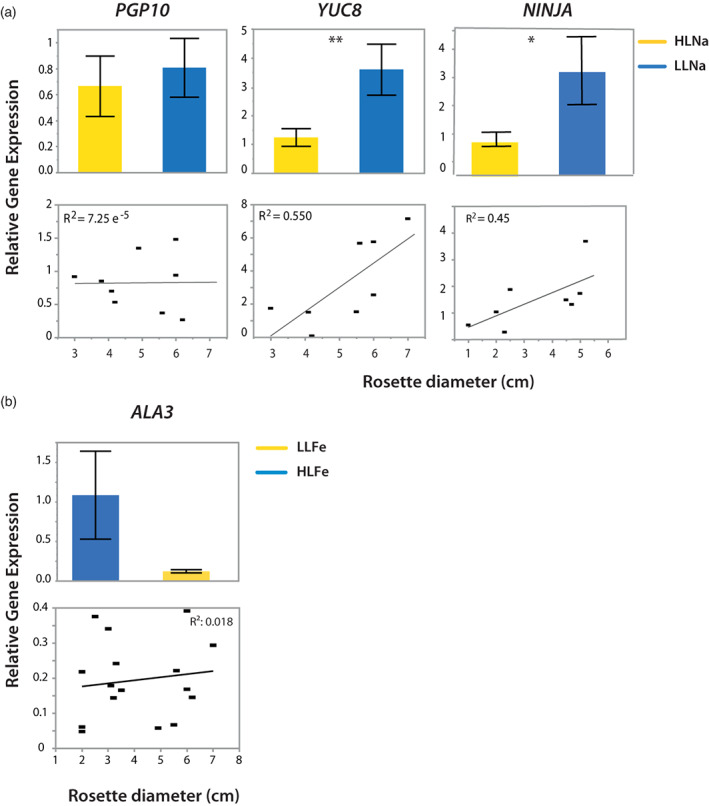
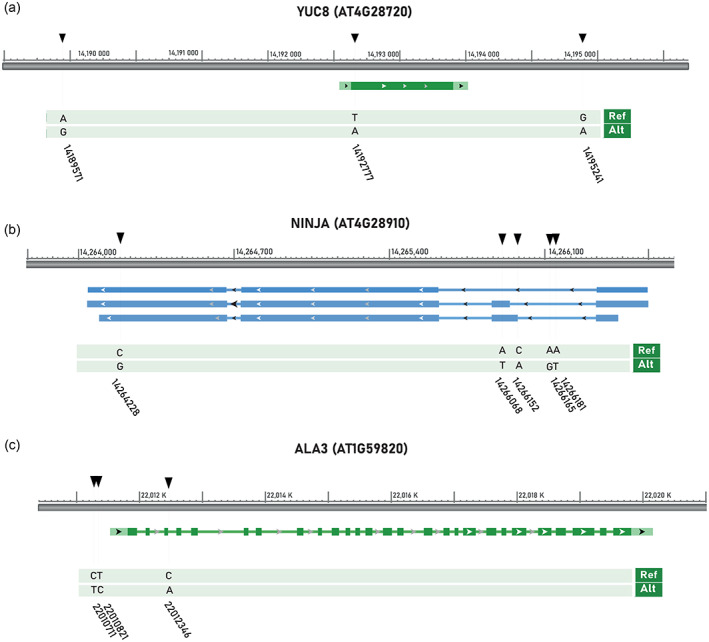
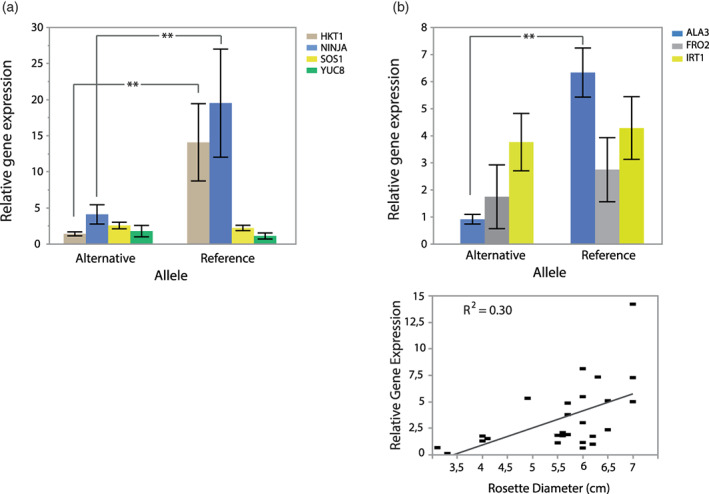
In nature, multiple stress factors occur simultaneously. The screening of natural diversity panels and subsequent Genome-Wide Association Studies (GWAS) is a powerful approach to identify genetic components of various stress responses. Here, the nutritional status variation of a set of 270 natural accessions of Arabidopsis thaliana grown on a natural saline-carbonated soil is evaluated. We report significant natural variation on leaf Na (LNa) and Fe (LFe) concentrations in the studied accessions. Allelic variation in the NINJA and YUC8 genes is associated with LNa diversity, and variation in the ALA3 is associated with LFe diversity. The allelic variation detected in these three genes leads to changes in their mRNA expression and correlates with plant differential growth performance when plants are exposed to alkaline salinity treatment under hydroponic conditions. We propose that YUC8 and NINJA expression patters regulate auxin and jasmonic signaling pathways affecting plant tolerance to alkaline salinity. Finally, we describe an impairment in growth and leaf Fe acquisition associated with differences in root expression of ALA3, encoding a phospholipid translocase active in plasma membrane and the trans Golgi network which directly interacts with proteins essential for the trafficking of PIN auxin transporters, reinforcing the role of phytohormonal processes in regulating ion homeostasis under alkaline salinity.

Keywords: Arabidopsis; GWAS; alkaline-salinity; ionome; natural variation.


Conflict of interest statement

The authors declare no conflicts of interest.

Figures

Figure 1
Figure 1
Plant material and soil of study. (a) Distribution of saline and calcareous soils in Europe. Green dots indicate the location of origin of the 360 accessions of the HapMap collection. Red area is categorized as saline (>50% surface), and CaCO3 content (mg kg−1) is shown (gray‐scale legend). Frame shows the map of Catalunya, indicating the location of the saline calcareous soil (SCS) used in the experiment; (b) physico‐chemical characterization of SCS.
Figure 2
Figure 2
Phenotypic analysis of the studied accessions grown on saline calcareous soil (SCS). (a) Scatter plot of the rosette diameter (cm) of all accessions grown on SCS. Each dot represents an accession. Growth categories were established by selecting accessions on the 10% top (blue) and 10% lowest (yellow) rosette diameter. HD: High Diameter group; LD: Low Diameter group; (b) Radial plot with the Z‐values of the studied elements in leaves of HD and LD accessions. Axes display Z‐scores calculated per element and asterisks show significant differences among the two extreme groups (Student t‐Test, P < 0.05); (c) Chart pie of nutrient content in the native soil of HD (blue) and LD (red) accessions. Asterisks and histograms show the two elements displaying significant differences among the two groups (Student t‐Test, P < 0.05). Plants were grown on SCS for 8 weeks (n = 4). (d) Pairwise correlation of leaf mineral nutrients and growth performance (Leaf Na and RD, leaf S and RD, expressed as μg g−1 DW and cm, respectively); (e) Pairwise correlation of Leaf nutrient concentrations (Na and Fe, Fe and S, Fe and Mn, expressed as μg g−1 DW); (f) Pairwise correlation of leaf mineral nutrients and SCS soil element concentrations (Leaf Na and soil Mg and Ca, expressed as μg g−1 DW and g Kg−1 respectively); (g) Pairwise correlation of SCS soil element concentrations (Ca and Mg, Fe and Mg, Ca and Mn, expressed as g Kg−1). The lines represent the result of linear regression. R 2: Squared Pearson correlation's coefficient.
Figure 3
Figure 3
Genome wide association studies (GWAS) for leaf ionome traits of HapMap accessions grown on SCS. Manhattan plots displaying the GWAS results for (a) leaf Na concentration and (b) leaf Fe concentration in the studied accessions. The horizontal gray dash‐line line corresponds to a nominal 0.05 significance threshold after Benjamini Hochberg (False Discovery Rate) correction. Numbers, red dots and arrows indicate the regions containing the significantly associated locus. Peak of SNPs centered on HKT1 is circled and labeled. Blue arrow indicates SNP included independently from SNP 3 in the analysis. x‐axis: chromosomal position of SNP; y‐axis: ‐log10(P‐value). Plants were grown on SCS for 8 weeks (n = 4).
Figure 4
Figure 4
Phenotyping of T‐DNA insertion mutants for the identified candidate genes. (a) Seed germination on plates under control and treatment conditions. Germination rate [(% Germination − Treatment)/(% Germination − Control)] of T‐DNA and Col‐0 lines. Plants were grown on agar plates for 1 week in control (½ MS at pH 5.9) or bicarbonate (½ MS at pH 8.3 and 10 mm NaHCO3) treatment conditions. n = 10 plants per accession and treatment. Mean ± SE of leaf Na (b), and leaf Fe concentration (μg g−1 DW) (c) and Rosette Diameter (cm) (d). Asterisks indicate significant differences between mutant and Col‐0 wild type (*P < 0.05; **P < 0.01, Dunnet's test). Plants were grown on SCS for 8 weeks (n = up to 6 plants per accession and treatment).
Figure 5
Figure 5
Phenotyping of selected accessions displaying extreme phenotypes and contrasted alleles for each SNP of interest under hydroponic conditions. From left to right, mean ± SE of relative rosette diameter (Relative RD) per allele variant and relative leaf element concentration per allele variant for all LNa (a) and LFe (b) SNPs. Each dot represents 1 individual. Color boxes indicate advantageous (blue) and detrimental (yellow) alleles for each SNP. Plants treated with 0 or 40 mm NaCl + 10 mm NaHCO3 (pH 8.3) for 2 weeks. Three populations with up to 3 plants per population were pooled per each group. Asterisks indicate significant differences (*P < 0.05; **P < 0.01, Student t‐ Test).
Figure 6
Figure 6
Effects of allelic variation of selected candidate genes in gene expression levels. From left to right, gene expression of PGP10, YUC8 and NINJA (a) and ALA3 (b) in selected natural populations displaying extreme LNa and LFe phenotypes and contrasted alleles (ExtP). Scatter plots of relative gene expression (y‐axis) and plant rosette diameter (x‐axis) are represented below each gene expression plot. The lines represent the result of linear regression. R 2: Squared Pearson correlation's coefficient. Expression levels were normalized to expression in Col‐0. Error bars: SE Leaf and root samples of 3 populations with 3 plants per population were pooled per each group. Populations used are listed in Table S5. Data from three independent biological replicates each with two technical replicates are analyzed. Asterisks indicate significant differences (*P < 0.05; **P < 0.01, Student t‐ Test).
Figure 7
Figure 7
SNP polymorphisms surrounding the NINJA, YUC8 and ALA3 locus. Black triangles and orange lines: most likely candidate SNPs underlying the allelic effects. Gene orientation is indicated with an arrow on the right (a, c) and left (b). Exons are indicated with yellow boxes and introns with lines connecting them. Splice variants are shown when present. Reference and alternative allele nucleotydic changes and SNP position are marked below; chromosome positions are indicated at the top (picture from https://www.arabidopsis.org/index.jsp).
Figure 8
Figure 8
Expression pattern of major players in salinity and iron deficiency in roots of ExtP accessions. Gene expression of NINJA, YUC8, HKT1 and SOS1 (a) and ALA3, IRT1 and FRO2 (b) in roots of ExtP accessions. Scatter plots of relative gene expression (y‐axis) and plant rosette diameter (x‐axis) are represented below ALA3 gene expression plot. The lines represent the result of linear regression. R2: Squared Pearson correlation’s coefficient. Expression levels were normalized to expression in Col‐0. Error bars: SE Root samples of three accessions with three plants per accession were pooled per each group. Populations used are listed in Table S5. Data from three independent biological replicates each with two technical replicates are analyzed. Letters a and b indicate significant differences between mRNA expression levels (P < 0.05, HSD Tukey).

Similar articles

Cited by

References

    1. Akhtar, M. , Yousaf, S. , Sarwar, N. & Hussain, S. (2019) Zinc biofortification of cereals—role of phosphorus and other impediments in alkaline calcareous soils. Environmental Geochemistry and Health, 41(5), 2365–2379. Available from: 10.1007/s10653-019-00279-6 - DOI - PubMed
    1. Alloway, B.J. (2013) Molybdenum. In: Heavy metals in soils. Dordrecht: Springer, pp. 527–534.
    1. Arouisse, B. , Korte, A. , van Eeuwijk, F. & Kruijer, W. (2020) Imputation of 3 million SNPs in the Arabidopsis regional mapping population. The Plant Journal, 102(4), 872–882. Available from: 10.1111/tpj.14659 - DOI - PMC - PubMed
    1. Assefa, T. , Zhang, J. , Chowda‐Reddy, R.V. , Moran Lauter, A.N. , Singh, A. , O'Rourke, J.A. et al. (2020) Deconstructing the genetic architecture of iron deficiency chlorosis in soybean using genome‐wide approaches. BMC Plant Biology, 20(1), 1–13. Available from: 10.1186/s12870-020-2237-5 - DOI - PMC - PubMed
    1. Atwell, S. , Huang, Y.S. , Vilhjálmsson, B.J. , Willems, G. , Horton, M. , Li, Y. et al. (2010) Genome‐wide association study of 107 phenotypes in Arabidopsis thaliana inbred lines. Nature, 465(7298), 627–631. Available from: 10.1038/nature08800 - DOI - PMC - PubMed

Publication types