. 2023 Mar;71(3):775-794.
doi: 10.1002/glia.24310. Epub 2022 Nov 26.

Elevated granulocyte colony stimulating factor (CSF) causes cerebellar deficits and anxiety in a model of CSF-1 receptor related leukodystrophy

Affiliations

Elevated granulocyte colony stimulating factor (CSF) causes cerebellar deficits and anxiety in a model of CSF-1 receptor related leukodystrophy

Fabrizio Biundo et al. Glia. 2023 Mar.

Abstract

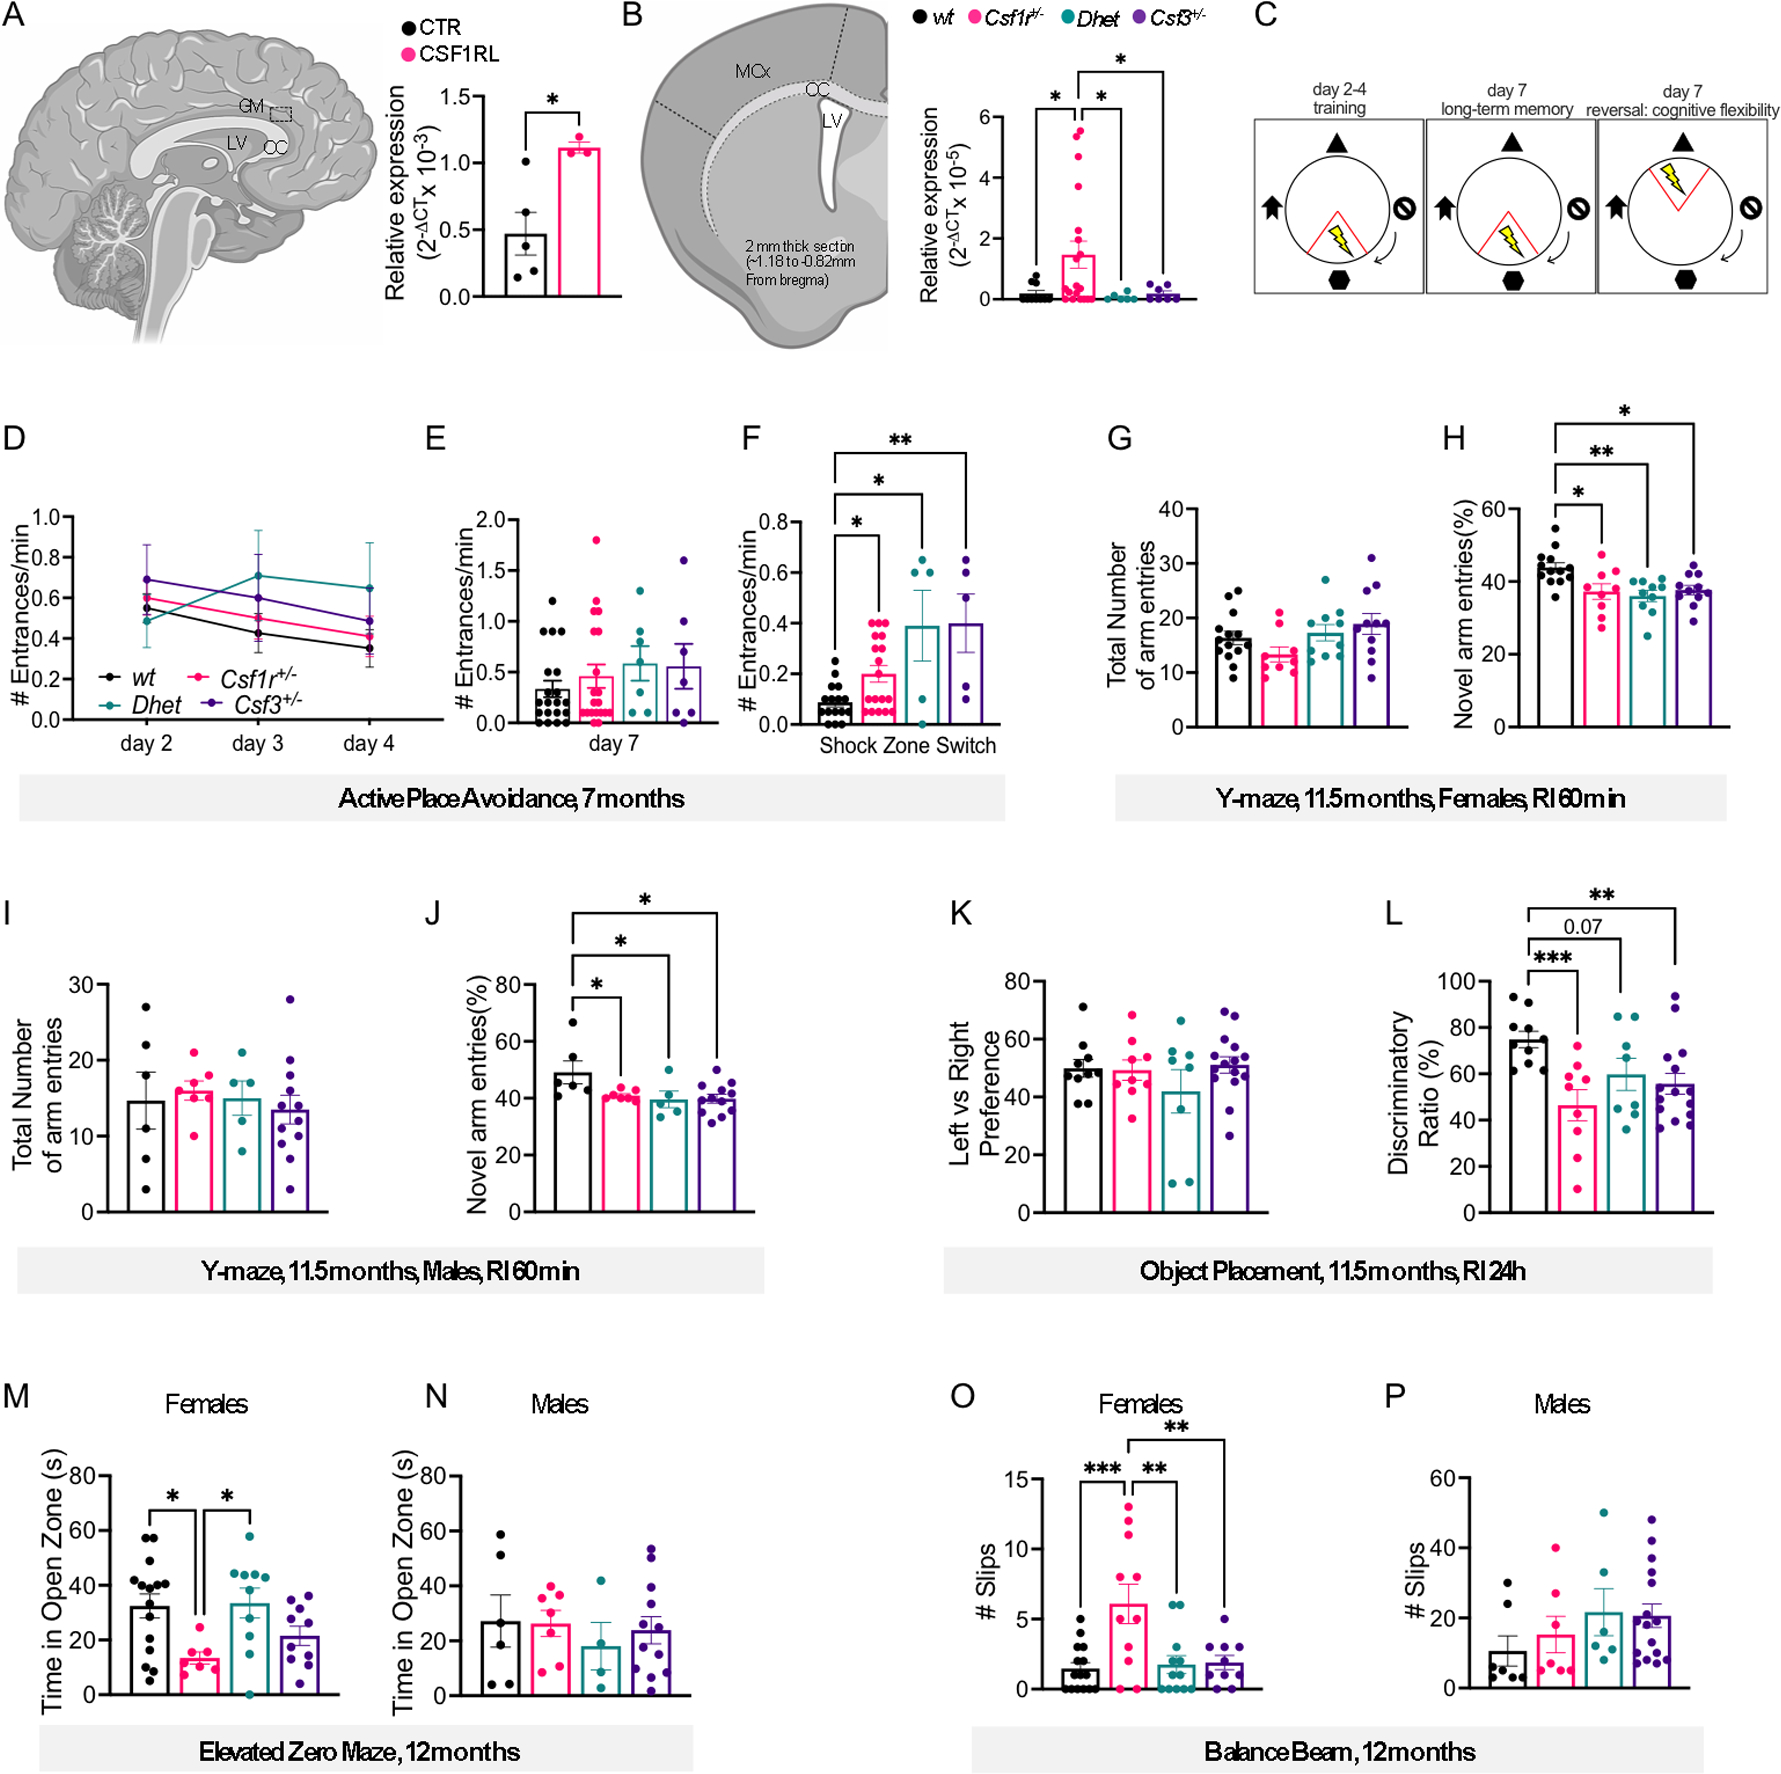
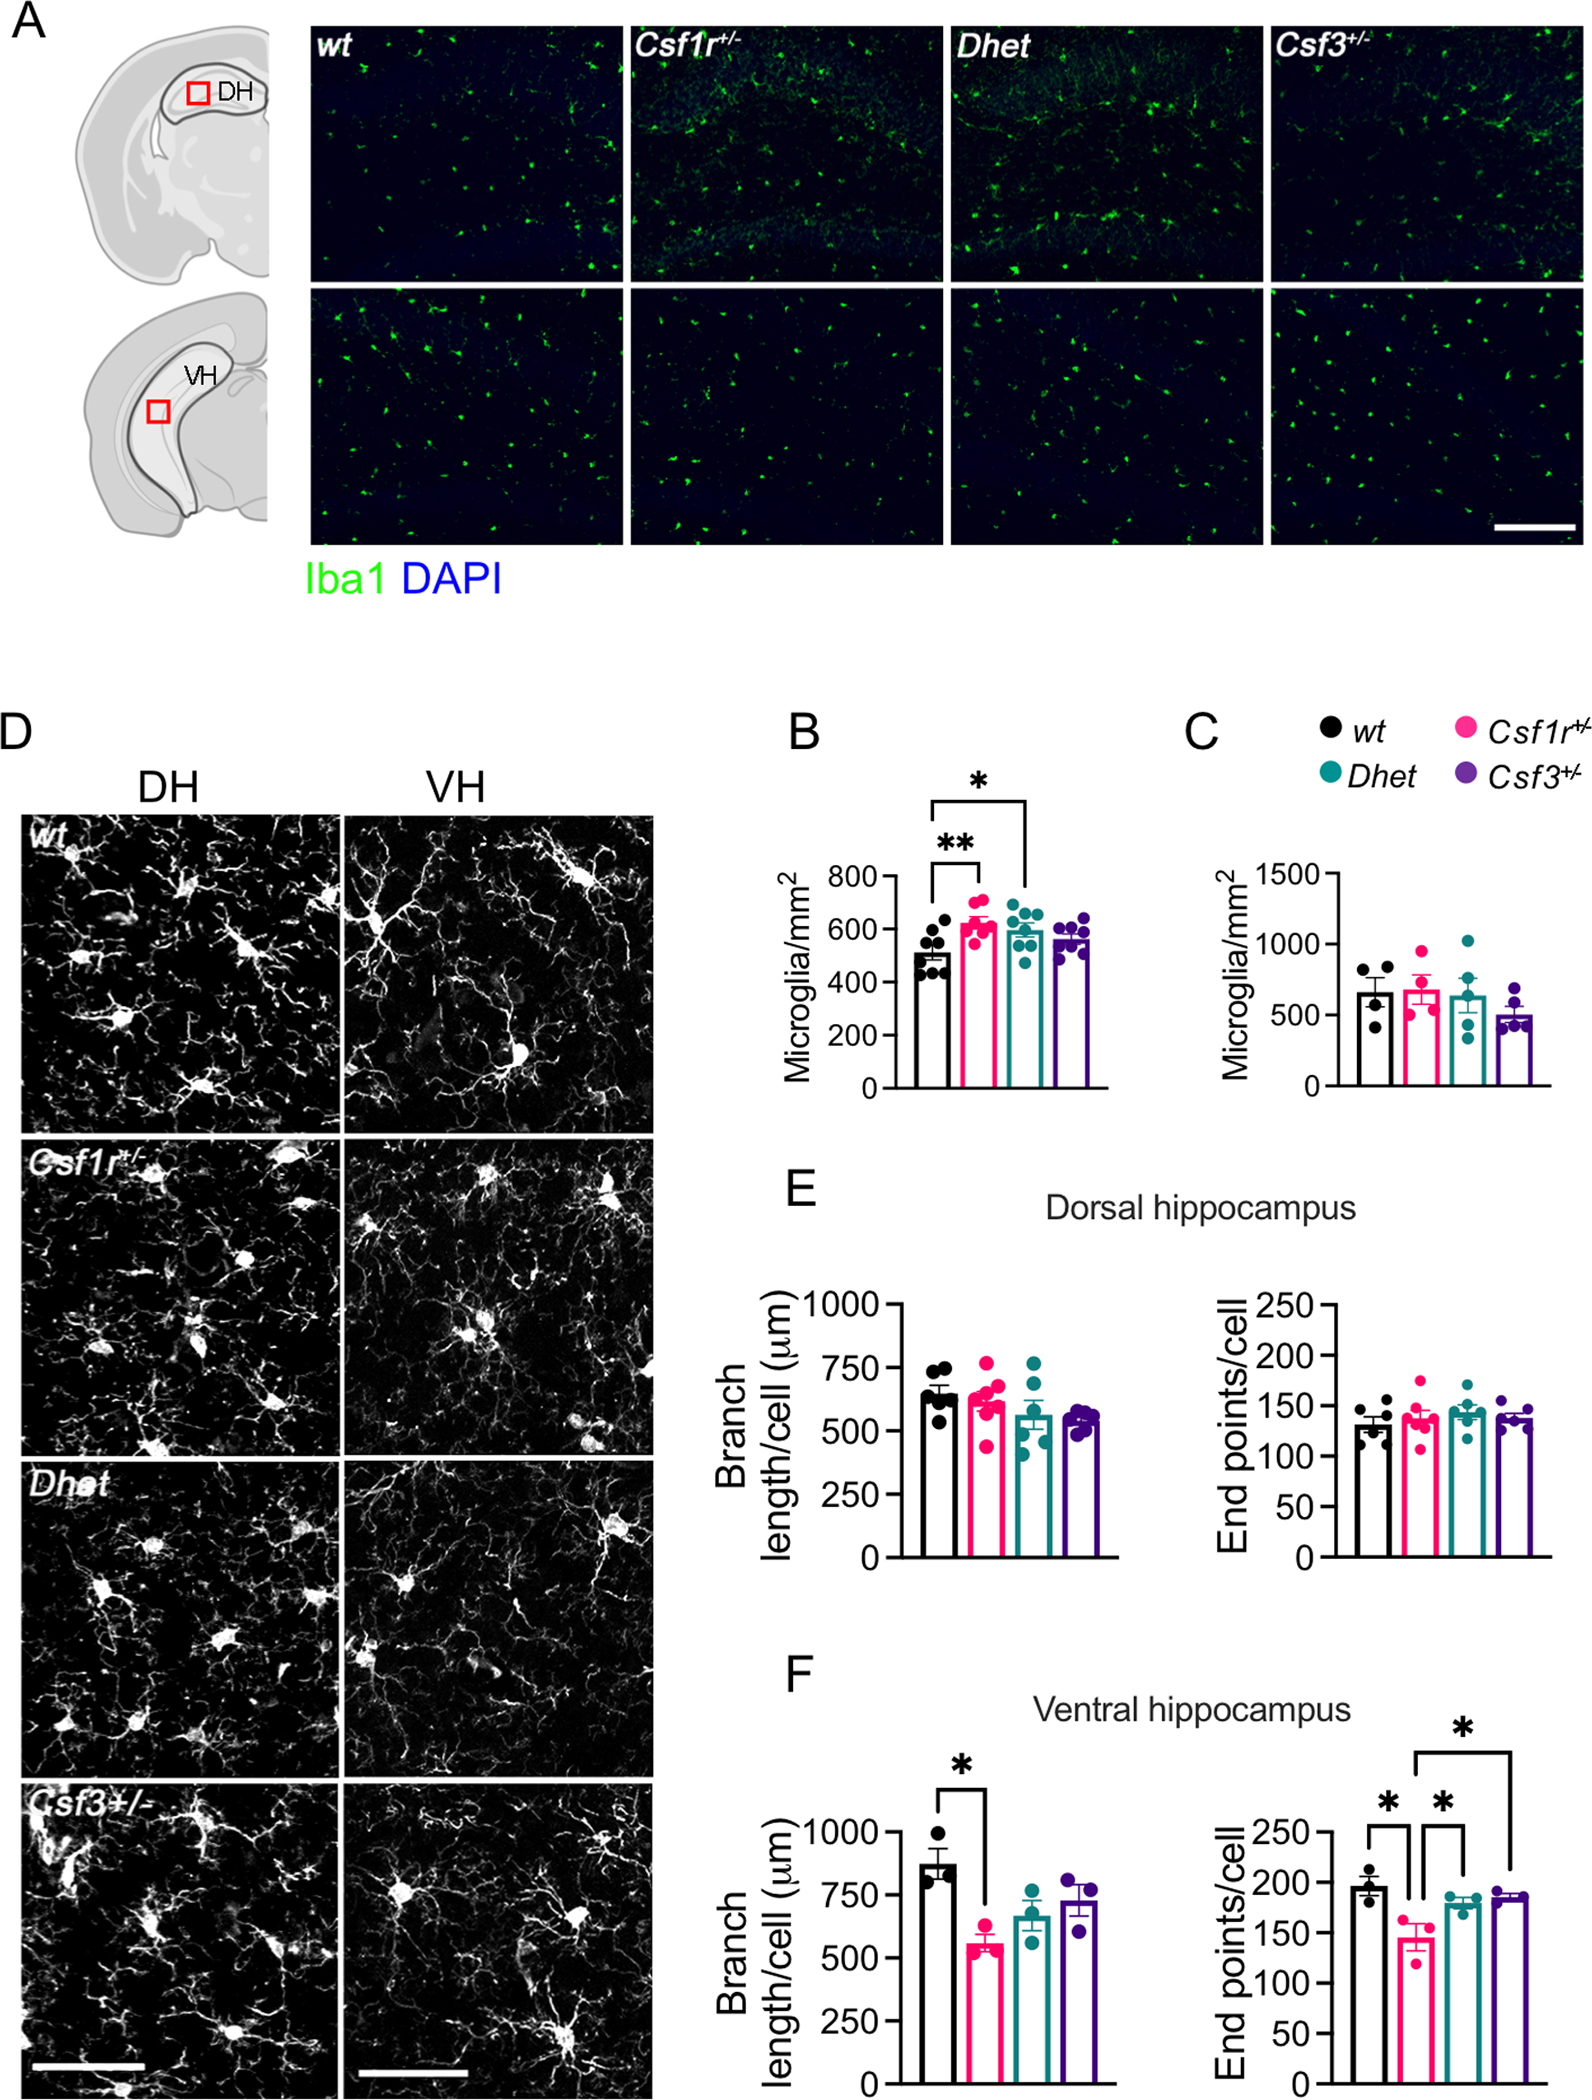
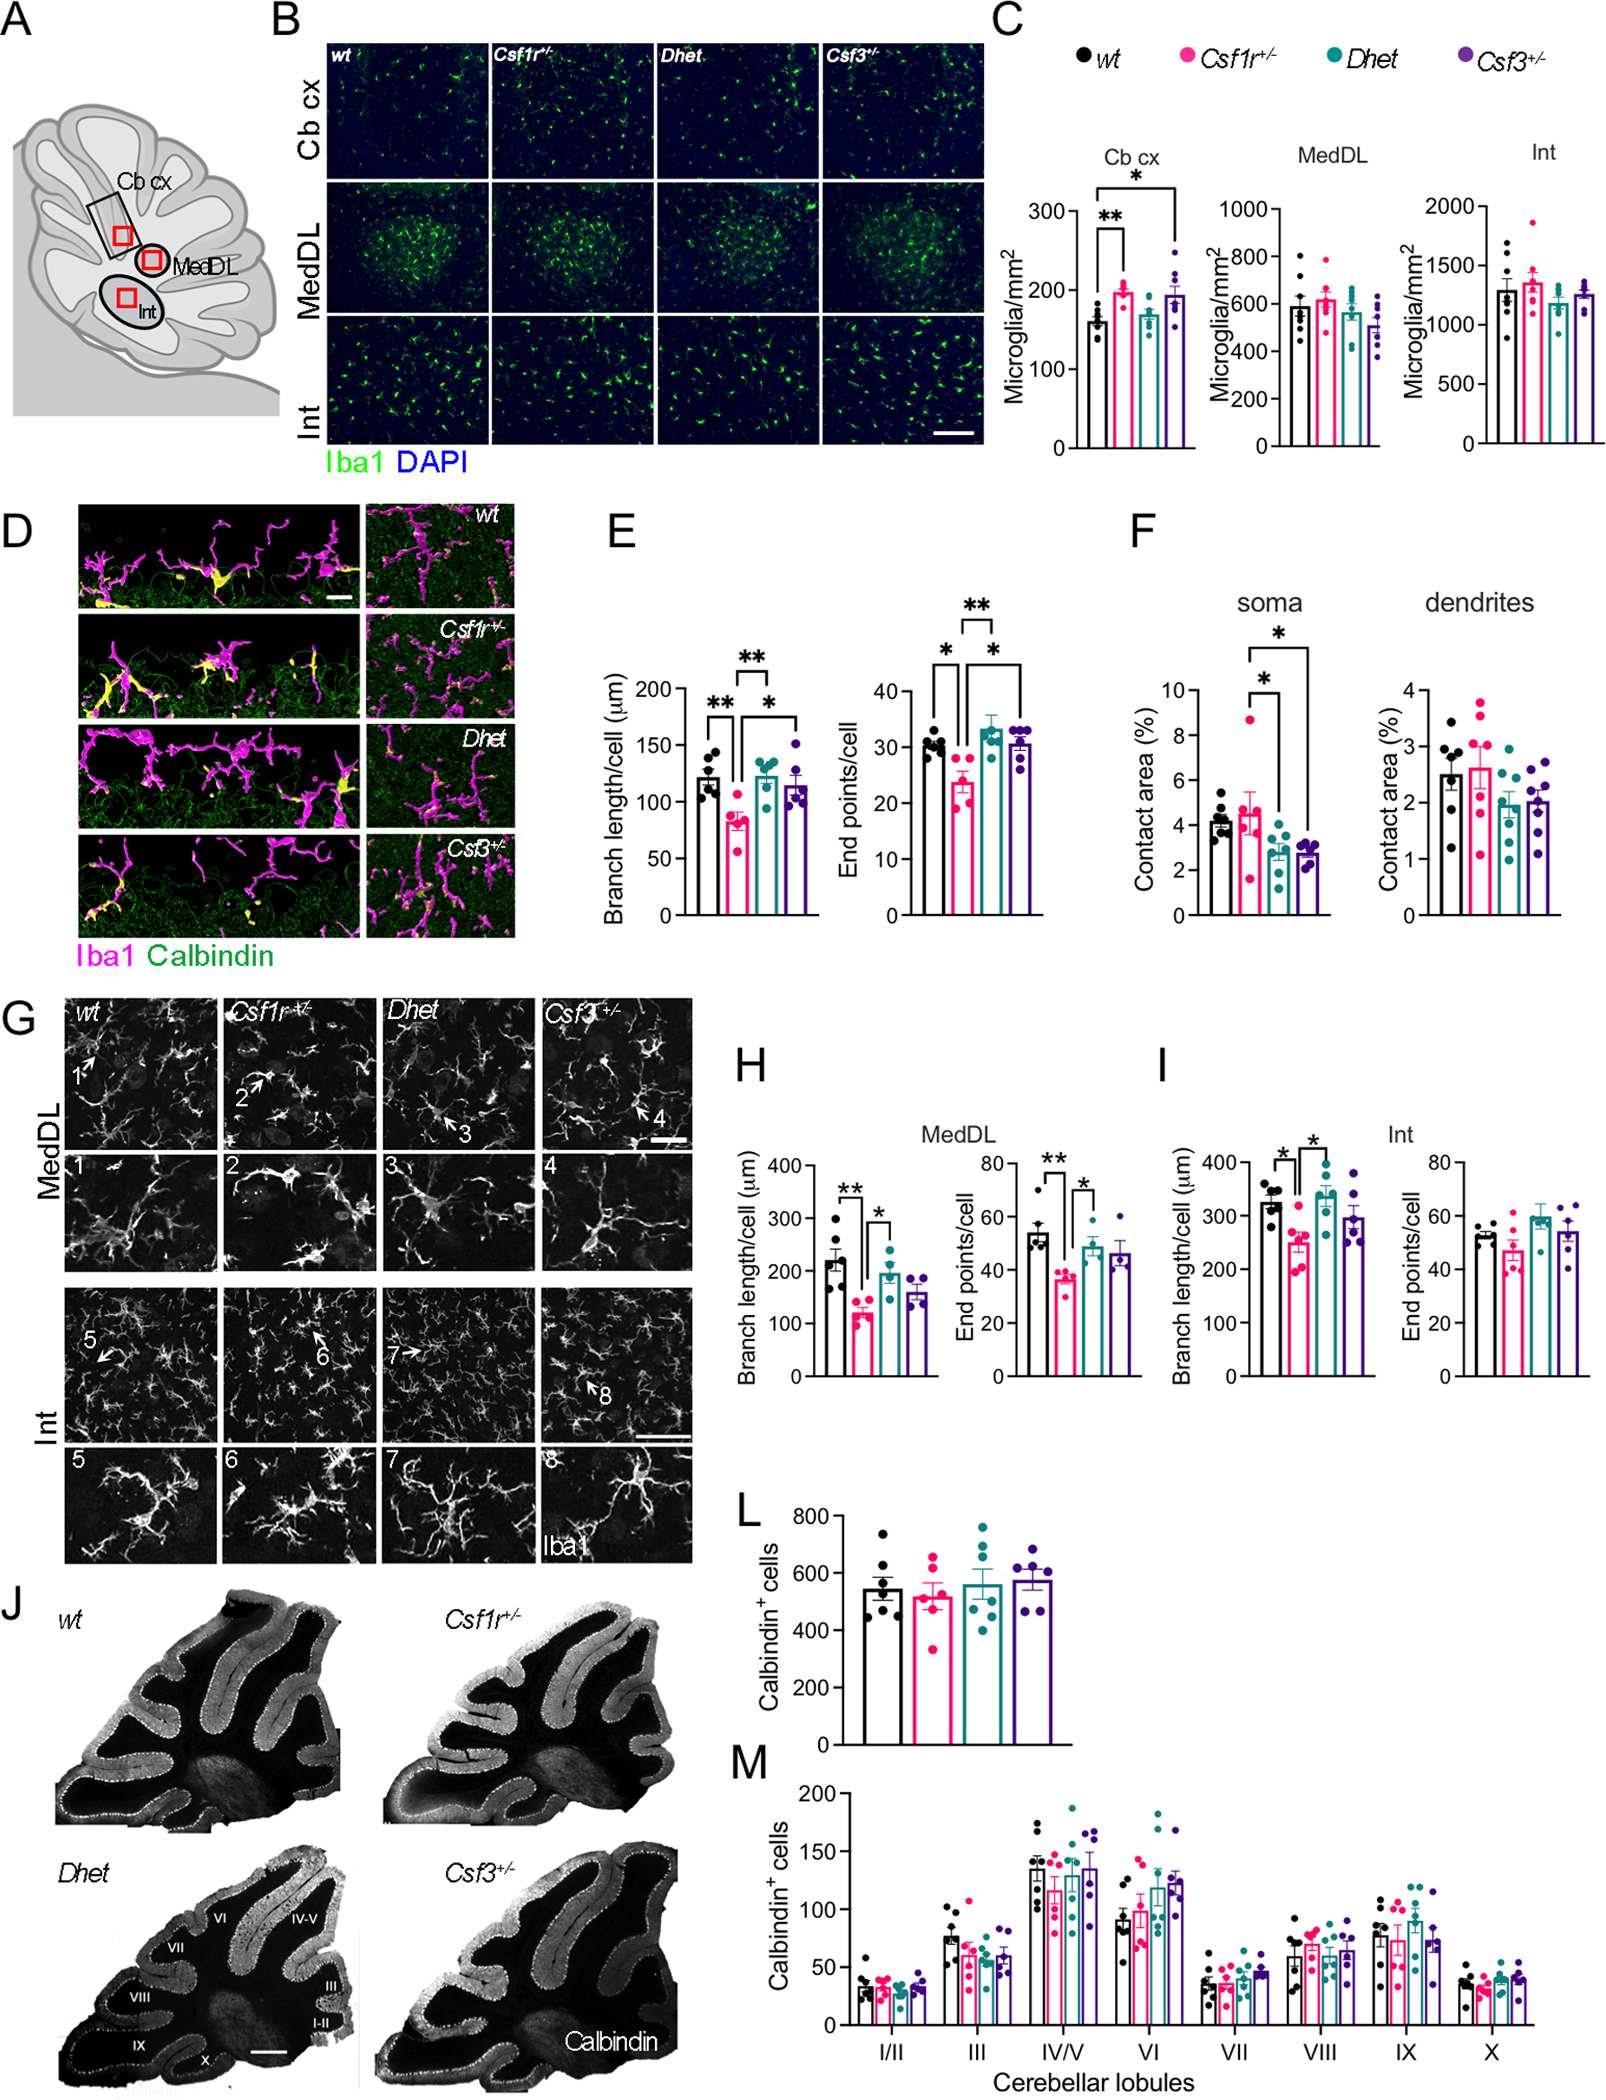
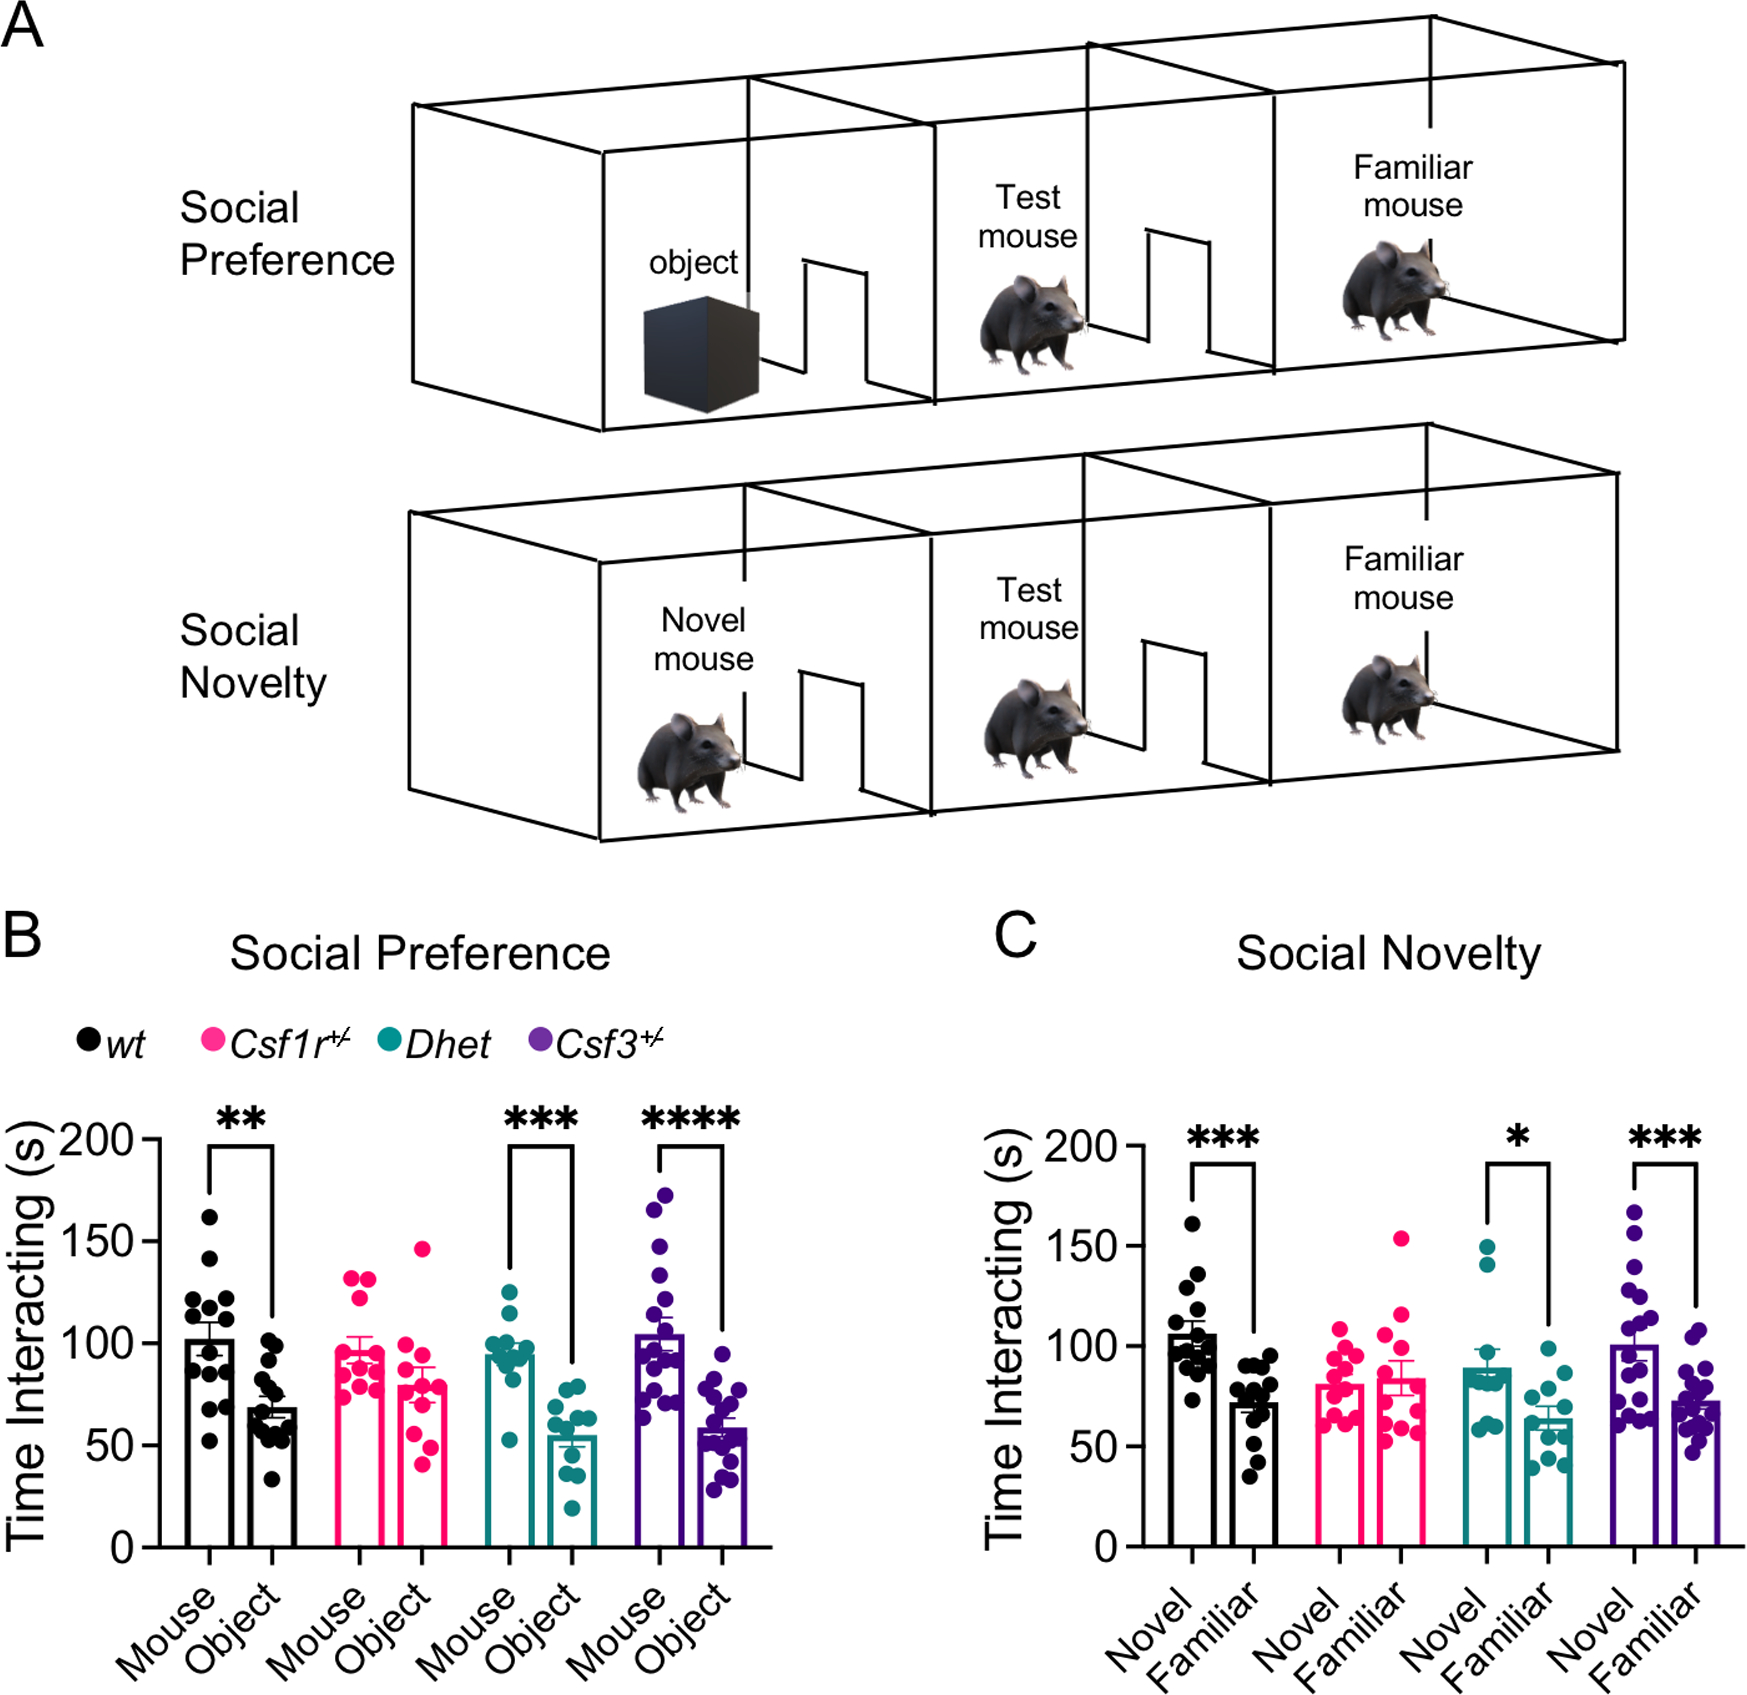
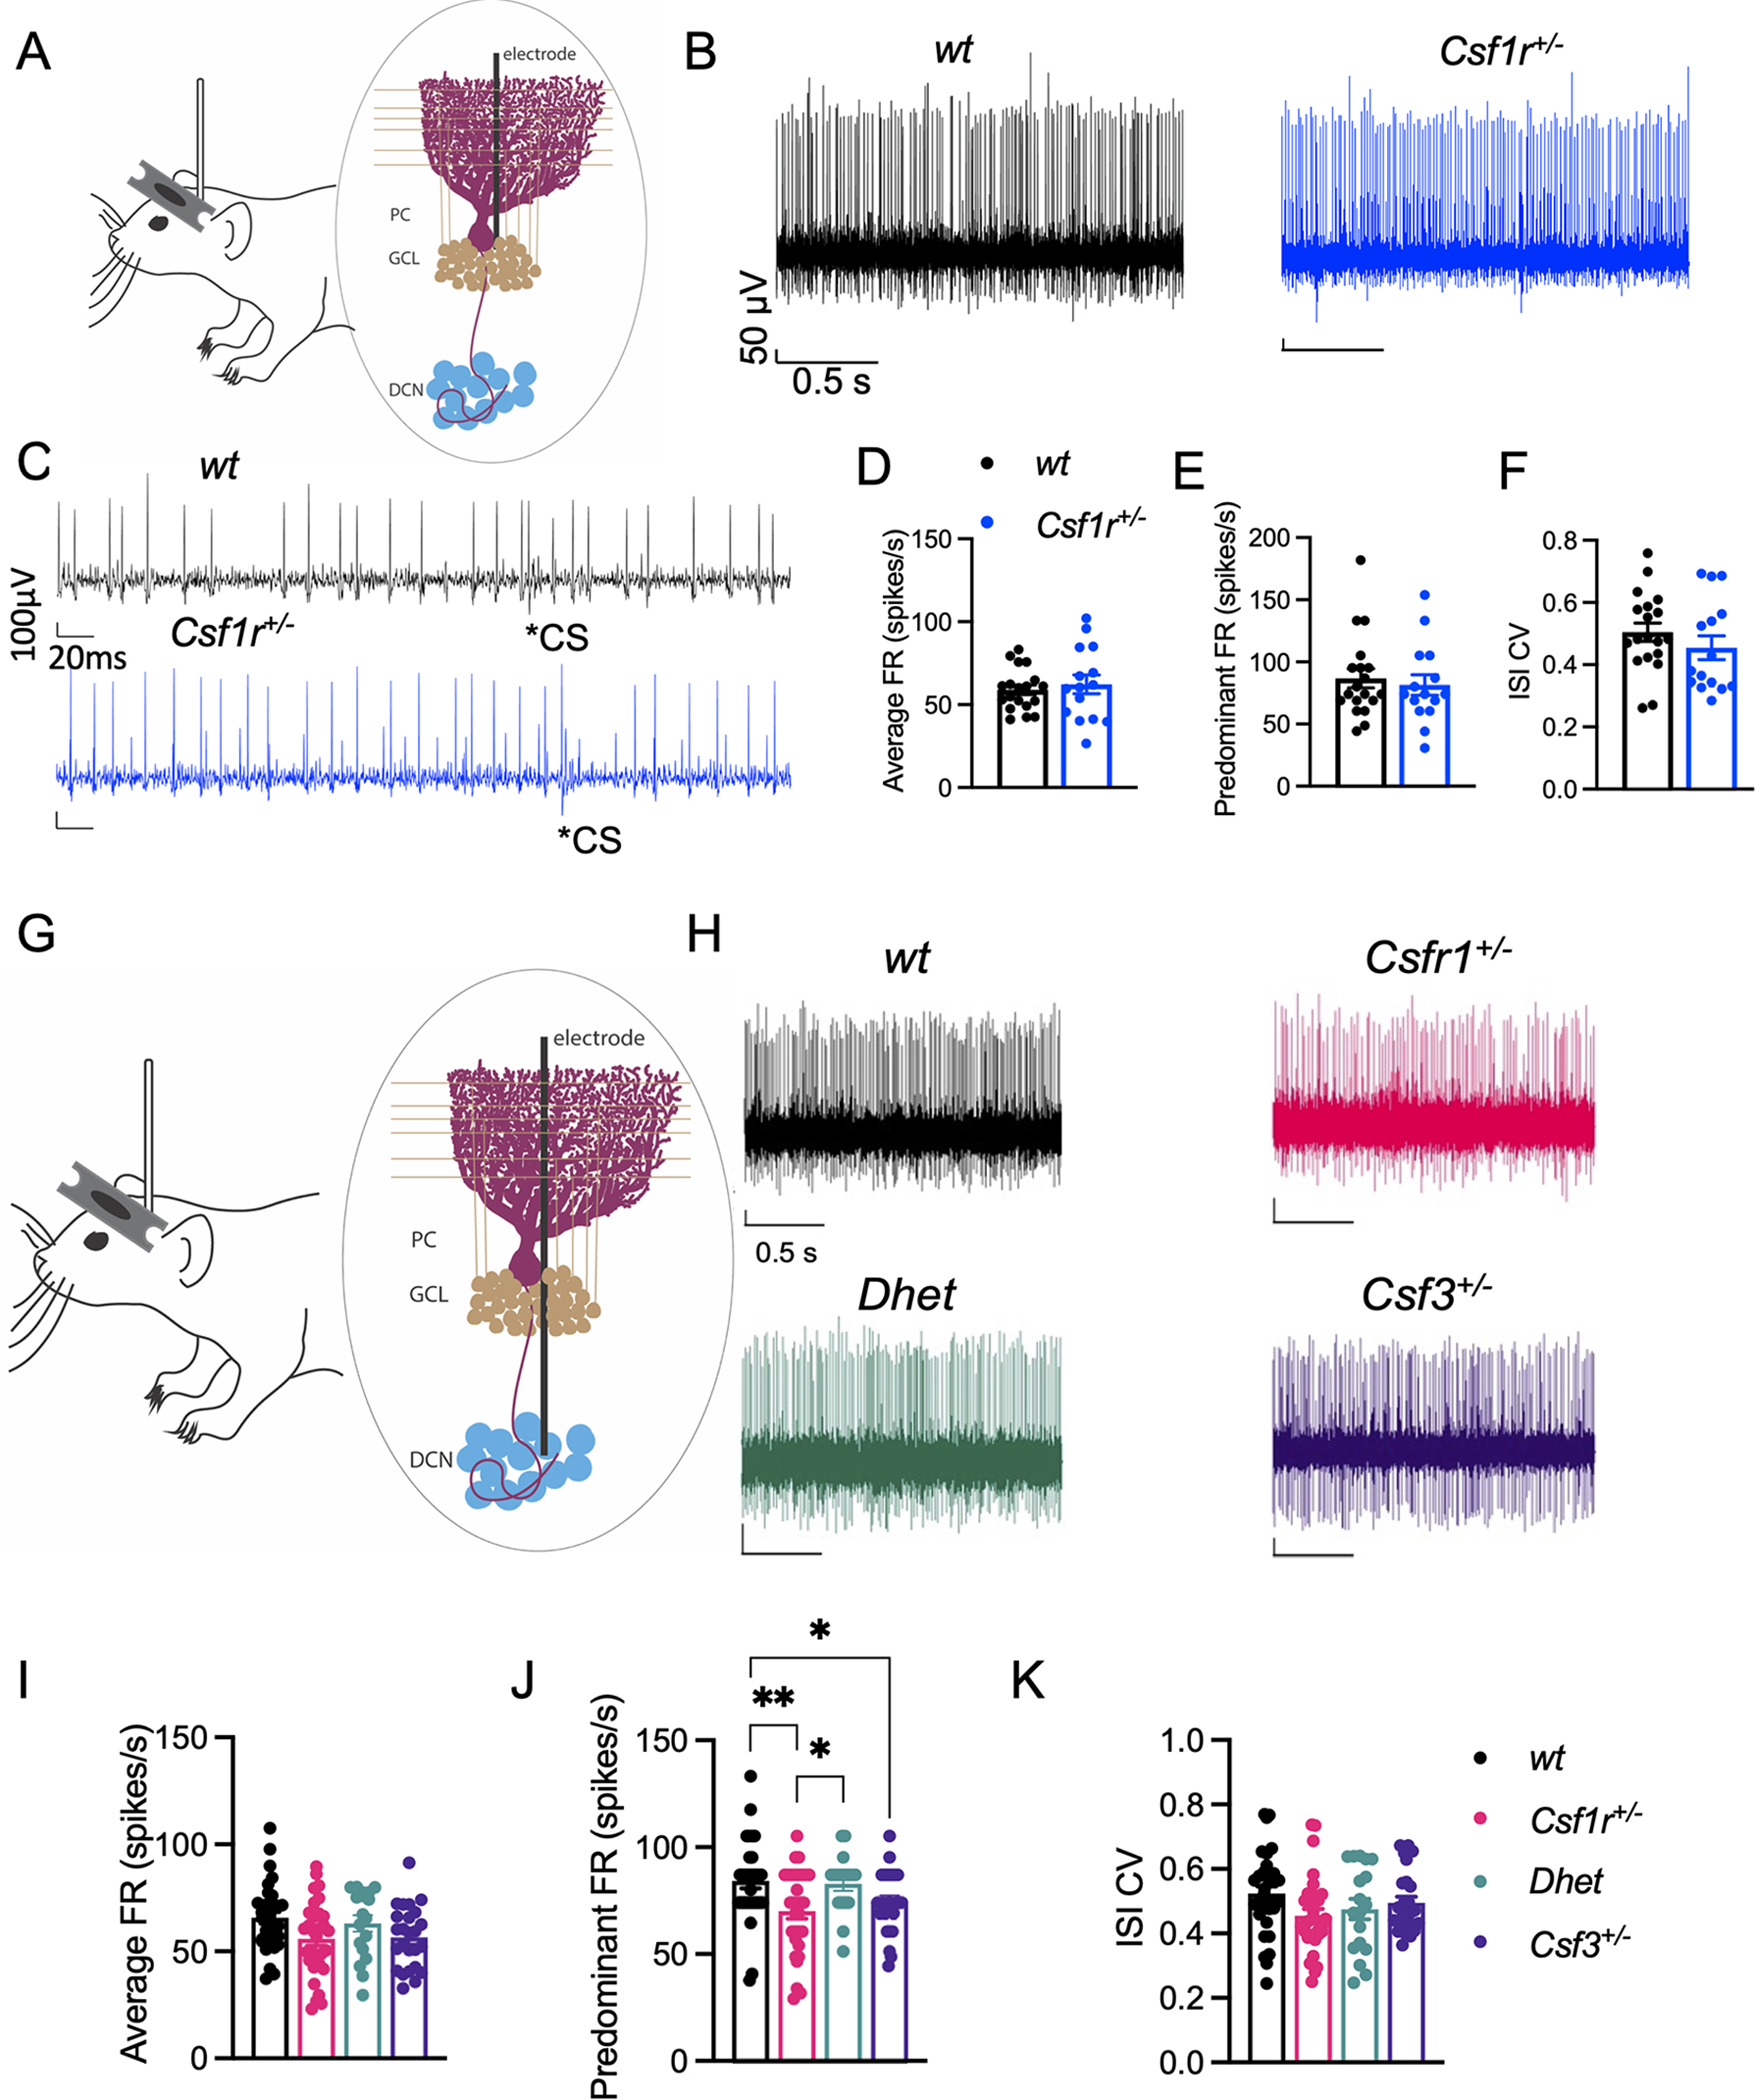
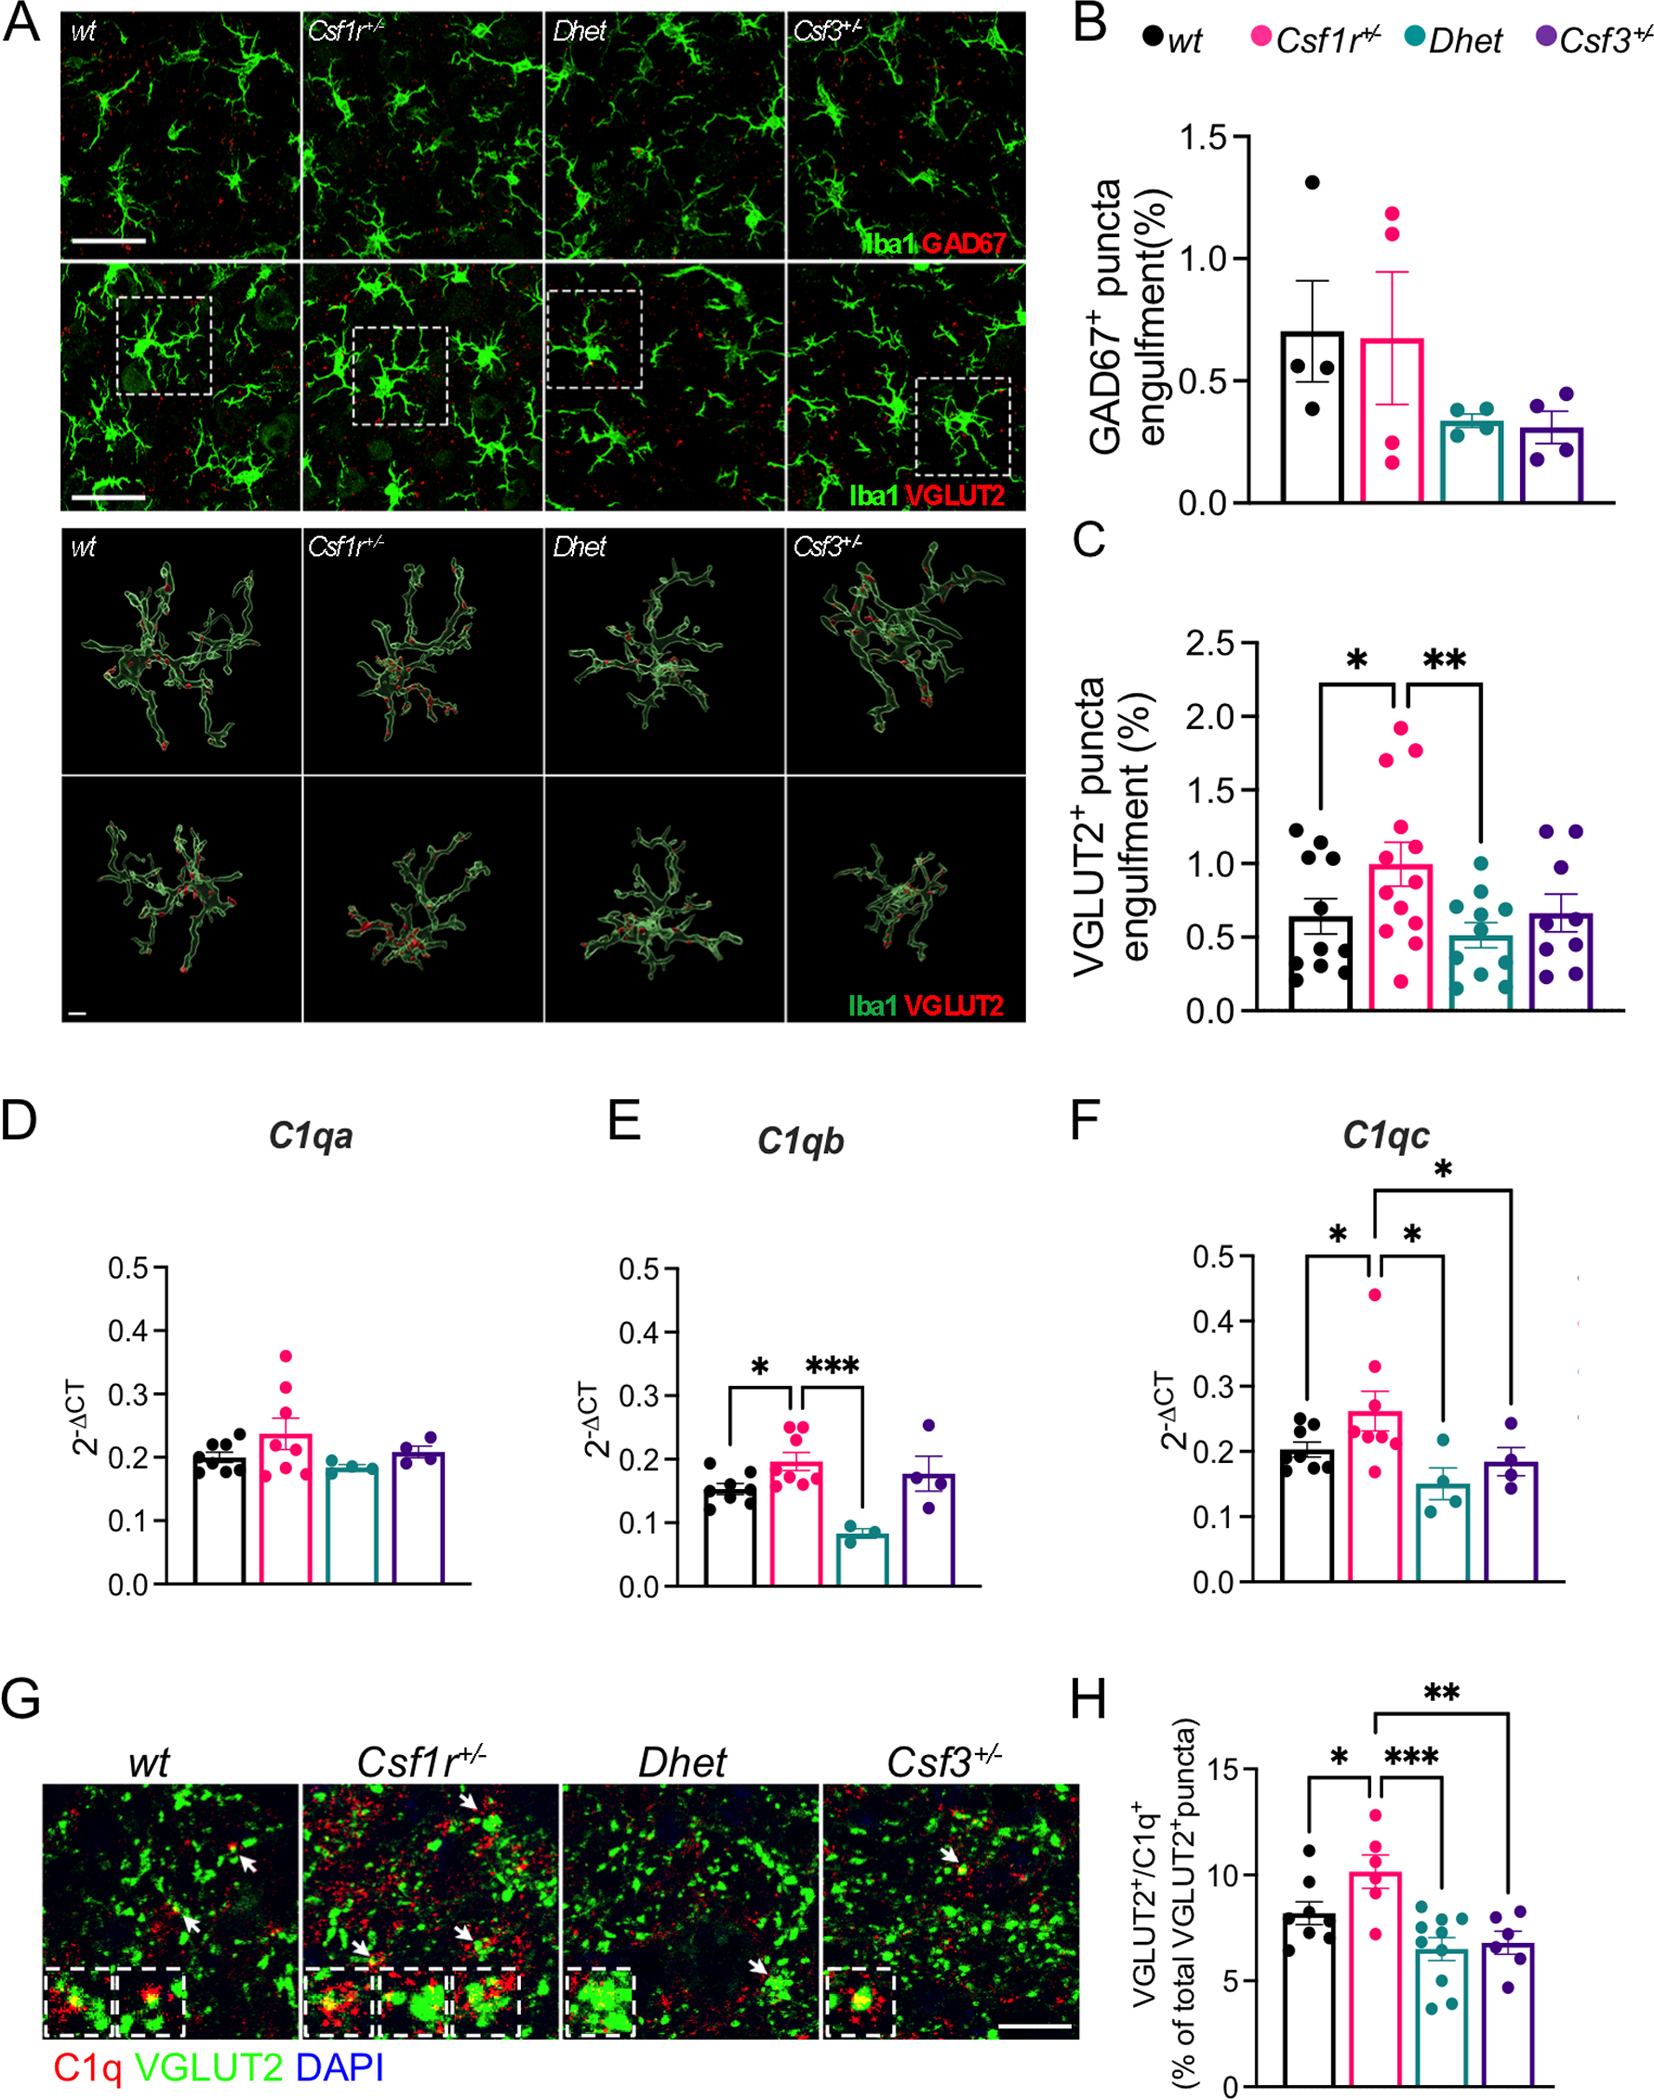
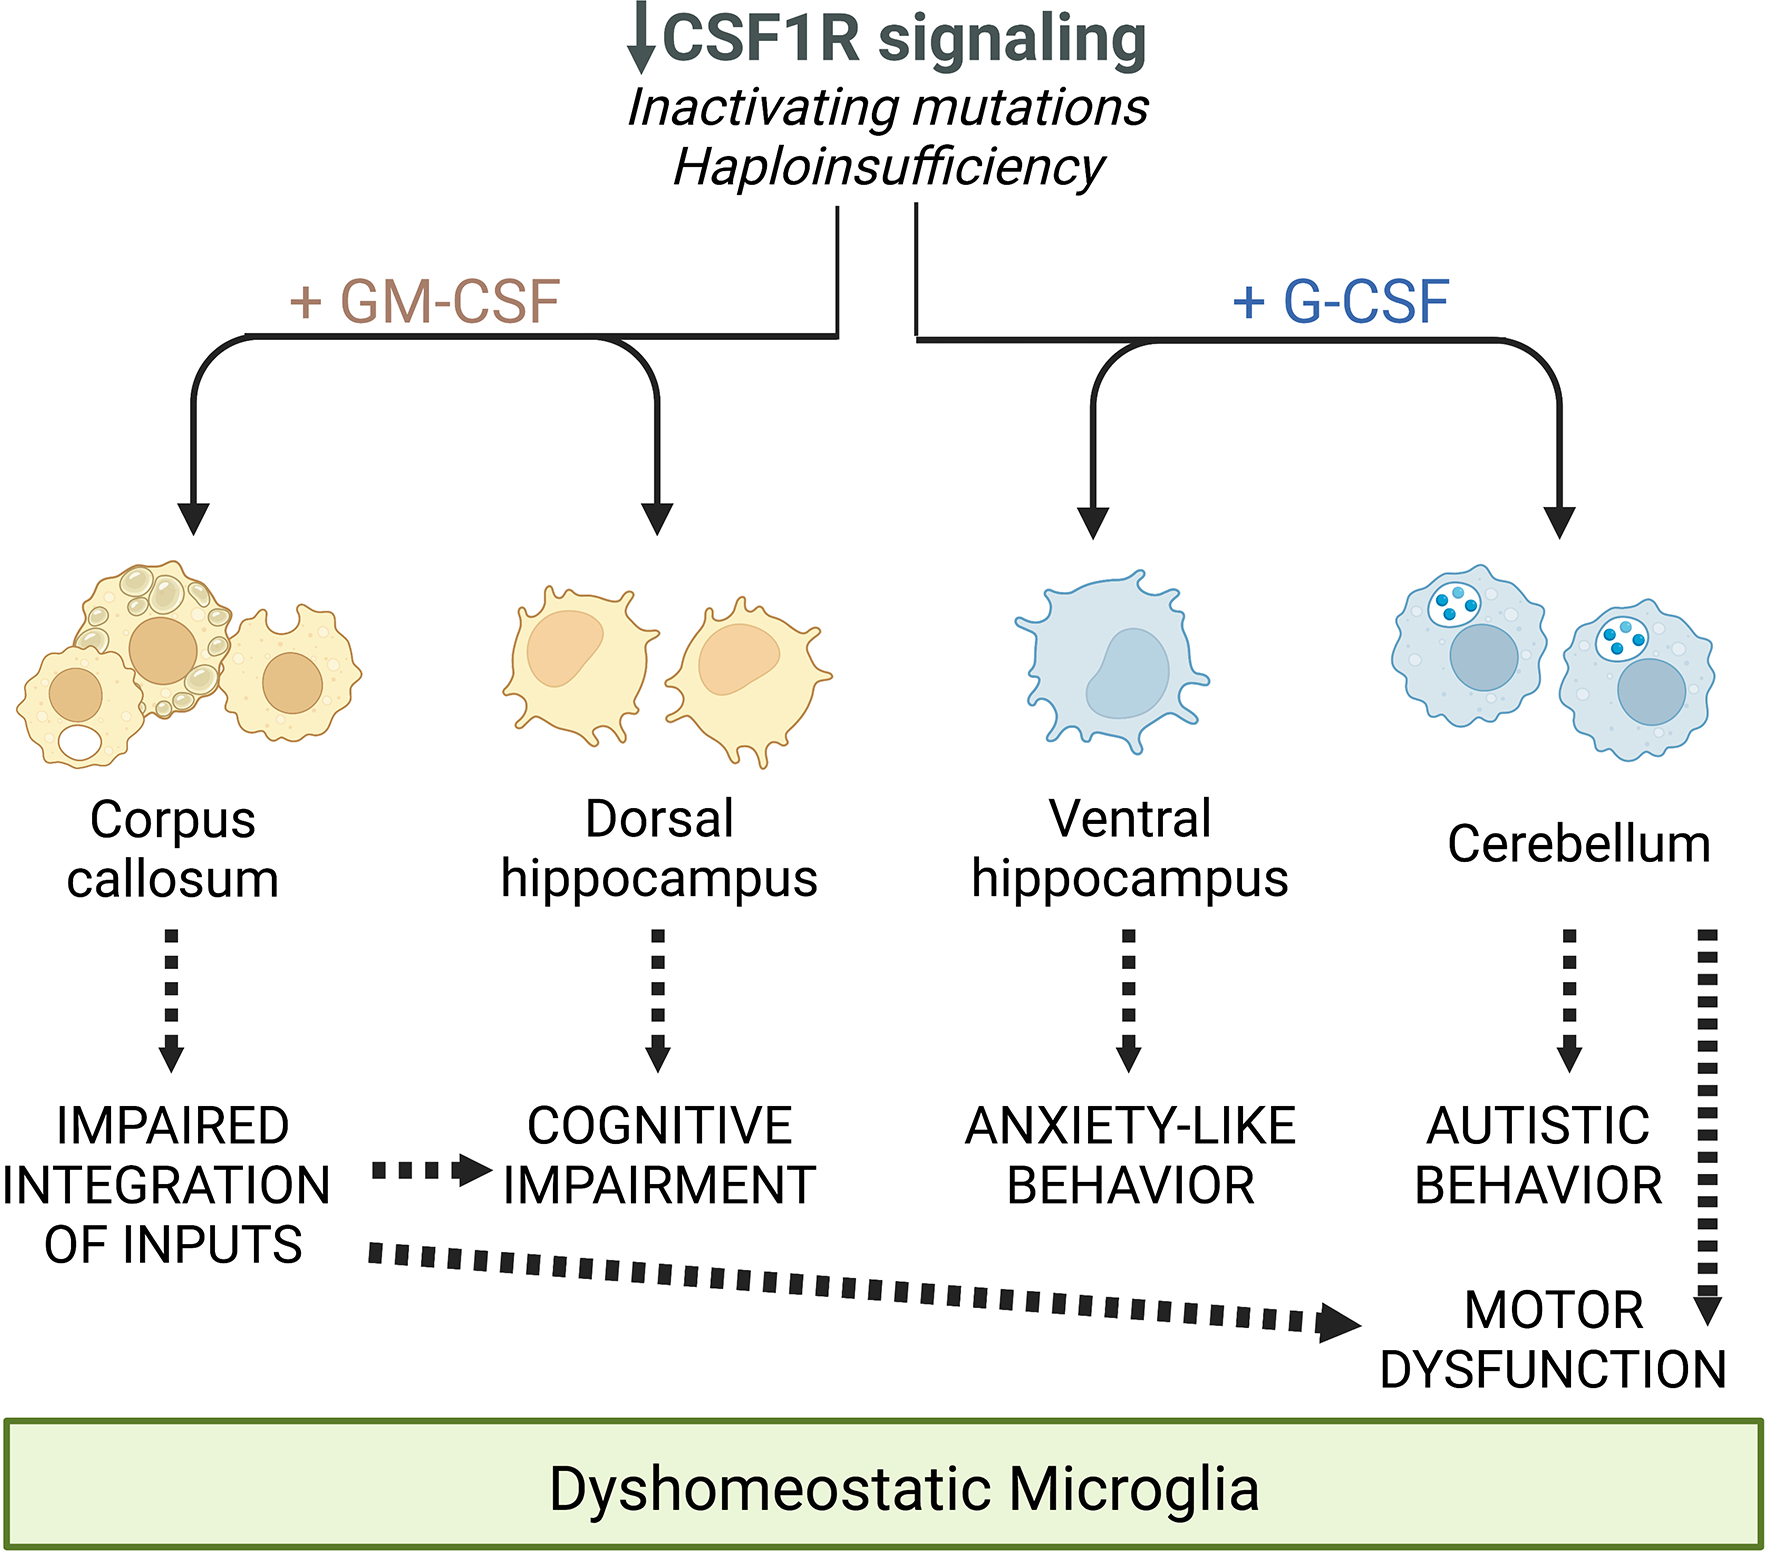
Colony stimulating factor (CSF) receptor-1 (CSF-1R)-related leukoencephalopathy (CRL) is an adult-onset, demyelinating and neurodegenerative disease caused by autosomal dominant mutations in CSF1R, modeled by the Csf1r+/- mouse. The expression of Csf2, encoding granulocyte-macrophage CSF (GM-CSF) and of Csf3, encoding granulocyte CSF (G-CSF), are elevated in both mouse and human CRL brains. While monoallelic targeting of Csf2 has been shown to attenuate many behavioral and histological deficits of Csf1r+/- mice, including cognitive dysfunction and demyelination, the contribution of Csf3 has not been explored. In the present study, we investigate the behavioral, electrophysiological and histopathological phenotypes of Csf1r+/- mice following monoallelic targeting of Csf3. We show that Csf3 heterozygosity normalized the Csf3 levels in Csf1r+/- mouse brains and ameliorated anxiety-like behavior, motor coordination and social interaction deficits, but not the cognitive impairment of Csf1r+/- mice. Csf3 heterozygosity failed to prevent callosal demyelination. However, consistent with its effects on behavior, Csf3 heterozygosity normalized microglial morphology in the cerebellum and in the ventral, but not in the dorsal hippocampus. Csf1r+/- mice exhibited altered firing activity in the deep cerebellar nuclei (DCN) associated with increased engulfment of glutamatergic synapses by DCN microglia and increased deposition of the complement factor C1q on glutamatergic synapses. These phenotypes were significantly ameliorated by monoallelic deletion of Csf3. Our current and earlier findings indicate that G-CSF and GM-CSF play largely non-overlapping roles in CRL-like disease development in Csf1r+/- mice.

Keywords: CRL; CSF-1 receptor; G-CSF; HDLS; cerebellum; leukoencephalopathy; microglia.


Conflict of interest statement

CONFLICT OF INTEREST

The authors declare that they have no competing interests.

Figures

Figure 1.
Figure 1.. Csf3 heterozygosity attenuates anxiety and motor coordination deficits in CRL mice but fails to improve cognition.
(A) Elevated expression of CSF3 (right panel) in the periventricular grey matter (GM) (left panel) of CRL patients versus healthy controls (Supplemental Table S1) (unpaired t test). LV, lateral ventricle; CC, corpus callosum. (B) Expression of Csf3 (right panel) in the anterior motor cortex (MCx) and corpus callosum (CC) (left panel) of 6-month-old wt and mutant mice (Mann-Whitney test: wt vs Csf1r+/−, Csf1r+/− vs Dhet, Csf1r+/− vs Csf3+/−). The areas marked by dotted lines indicate the region from which RNA was extracted. LV, lateral ventricle. (C-F) Evaluation of cognitive flexibility in 7- month-old mice (females plus males). (C) Schematic of the protocol used for active place avoidance testing. Day 1 (habituation) is not shown. (D) Days 2–4: Training to avoid the initial shock zone location (2-way ANOVA). (E) Evaluation of long-term memory three days after the last training trial. (F) Evaluation of cognitive flexibility after the location of the shock zone was switched at day 7 (E,F; Dunn’s test). (G-J) Assessment of short-term memory at 11.5 months of age in the Y-maze. (G, H), females; (I, J), males. (G, I) Comparable total exploratory activity among genotypes. (H, J) Exploratory preference for the novel arm (G-J; Tukey’s). (K, L) Assessment of long-term memory in the object placement test (females plus males). (K) Ratio of the time exploring the left vs right position of the objects during training. (L) Discriminatory ratio of the time exploring the displaced vs the non-displaced object during testing (K, L; Fisher’s LSD). (M, N) Assessment of anxiety-like behavior for females (M) and males (N) in the elevated zero maze (Bonferroni’s). (O, P) Measurement of motor coordination on the balance beam (Fisher’s). Means ± SEM, significantly different changes are marked by asterisks. Each point in the bar graphs represents an individual patient or mouse. *, p < 0.05; **, p < 0.01; ***, p < 0.001, ****, p < 0.0001. Absence of asterisks in this and all subsequent figures indicates p > 0.05 with reference to the specified post-hoc tests. The post-hoc test used in each panel is indicated in parenthesis in the corresponding description. RI, retention interval.
Figure 2.
Figure 2.. Csf3 heterozygosity reduces microglial morphological alterations in the ventral hippocampus of Csf1r+/− mice.
Examination of medial-lateral sagittal sections of dorsal hippocampus (DH) and coronal sections of ventral hippocampus (VH) of 16-month-old female mice. (A) Iba1+ cell densities in the DH and VH (green; scale bar, 100 μm). The areas in which microglia were counted are delineated by the grey outlines (left panels). Red squares indicate the positions of the microscopic fields subjected to morphometric analysis. (B, C) Quantification of microglial densities in the DH (B) and VH (C) (4–8 mice per genotype, 1 section per mouse, Fisher’s LSD). (D) Morphology of the microglial ramifications in the DH and VH (scale bar, 50 μm). (E, F) Quantitation of the ramifications in DH (E) and VH (F) (3–6 mice per genotype, 1 section per mouse, average cell numbers per DH section: wt: 26.83±1.48, Csf1r+/−: 23.43±1.39, Dhet: 26.17±3.56, Csf3+/−: 23.33±0.98 and per VH section: wt: 17.00±1.00, Csf1r+/−: 24.67±4.63, Dhet: 19.00±0.57, Csf3+/−: 19.67±1.86 (two-stage linear step-up procedure of Benjamini, Krieger and Yekutieli). Each point in the bar graphs represents a mouse. Means ± SEM, significantly different changes are marked by asterisks. *, p < 0.05; **, p < 0.01; ****, p < 0.0001.
Figure 3.
Figure 3.. Csf3 heterozygosity reduces microglial morphological alterations in the cerebella of 16-month-old female Csf1r+/− mice.
(A) Diagram of a sagittal section of mouse cerebellum. Outlined black regions indicate the areas examined for microglia density analysis. Outlined red squares indicate the subregions selected for morphometric analysis. (B) Iba1+ cell densities (green) in the cerebellar cortex (Cb cx) and in the deep cerebellar nuclei, the dorsal protuberance of the medial cerebellar nucleus (MedDL) and the interposed nucleus (Int) (scale bar, 100 μm). (C) Quantification of data in (B) (6–8 mice per genotype, 1 section per mouse, Bonferroni’s). (D) Imaging of microglia (magenta) and their contacts (yellow) with the Purkinje cell (green) somas (left panels) and dendrites (right panels). Scale bar, 15 μm. (E) Morphometry of microglia in the cerebellar cortex (4–5 mice per genotype, average cell number per Cb cx section: wt: 26.17±4.85, Csf1r+/−: 20.60±3.19, Dhet: 14.67±0.98, Csf3+/−: 14.33±2.15. Dunn’s). (F) Quantification of microglia contact with Purkinje cell somas and dendrites (% of total Calbindin+ area). (G) Morphology of microglia in the deep cerebellar nuclei (scale bars, 50 μm and 70 μm respectively). The arrows and numbers in each upper panel designate the cells shown 2x enlarged in the numbered panels below. (H, I) Morphometry of microglia in the deep cerebellar nuclei (4–5 mice per genotype, average cell number per MedDL section: wt: 25.17±1.17, Csf1r+/−: 24.40±2.11, Dhet: 22.25±2.14, Csf3+/−: 24.50±3.88; cell number per Int section: wt: 20.33±0.98, Csf1r+/−: 16.60±1.16, Dhet: 18.25±1.31, Csf3+/−: 24.00±1.83. Dunn’s, and Tukey’s). (J) Representative images of Calbindin+ Purkinje cells (PC) distributed in the cerebellar lobules (scale bar, 500 μm) (L) Quantification of the total number PC per section and (M) Quantification of the number of Calbindin+ PCs in each lobule (4–5 mice per genotype, 1 section per mouse). Each point in the bar graphs represents a mouse. Means ± SEM, significantly different changes are marked by asterisks. *, p < 0.05; **, p < 0.01.
Figure 4.
Figure 4.. Evaluation of social interaction in the three-chamber sociability paradigm.
(A) Schematic of the testing apparatus for in the three-chamber sociability paradigm. (B) Social preference. Preferential exploration of mouse compared to object. (C) Social novelty. Preference of novel mouse over familiar mouse. Combined female and male data from 13–16-month-old mice. Means ± SEM, significantly different changes are marked by asterisks. *, p < 0.05; ****, p < 0.0001, Fisher’s).
Figure 5.
Figure 5.. Csf3 heterozygosity rescues the altered firing of deep cerebellar nuclei (DCN) cells in Csf1r+/− mice.
(A-K) 16–22-month-old mice. (A) Schematic of awake head-restrained in vivo single unit electrophysiological recording of cerebellar Purkinje cell (PC) activity. (B) Example recordings of PCs, with (C) examples of complex spikes, from wt and Csf1r+/− mice. (D-F) Quantification of average firing rate (FR) (D), predominant FR (E) and inter-spike interval coefficient of variation (ISI CV) (F) of sorted single units from wt (n = 19 cells, 3 mice) and Csf1r+/− (15 cells, 4 mice). (G) Schematic of in vivo single unit electrophysiological recording of DCN cell activity. (H) Example recordings of DCN cells from wt, Csf1r+/−, Dhet and Csf3+/− mice. (I-K) Quantification of FR (I), predominant FR (J) and ISI CV (K) of sorted single units/cells from wt (n = 32 cells, 5 mice), Csf1r+/− (31 cells, 4 mice), Dhet (17 cells, 3 mice) and Csf3+/− (25 cells, 4 mice). Means ± SEM, significantly different changes are marked by asterisks. *, p < 0.05; **, p < 0.01 (Fisher’s).
Figure 6.
Figure 6.. G-CSF mediates excessive complement-mediated engulfment of DCN glutamatergic synapses by microglia in Csf1r+/− mice.
(A-C) 16-month-old female mice. (A) Upper panels, immunofluorescence staining showing the engulfment of GAD67+ and VGLUT2+ puncta (red) by Iba1+ microglia (green) in the DCN. Lower panels, 3D reconstruction with surface rendering showing VGLUT2+ puncta inside the branches and the cell bodies of single microglia, confirming the engulfment of synaptic material. Microglia are shown in their original position (top) and rotated 180 degrees along the z axis (bottom). Scale bars: 30 μm (upper panels), 5 μm (lower panels). (B-C) Quantification of the percentage of engulfment of GAD67+ and VGLUT2+ puncta by Iba1+ cells (4–8 mice per genotype, Newman-Keuls). (D-F) Quantification of the expression of transcripts of C1q genes C1qa, C1qb, and C1qc in the cerebella of 16–24-month-old male and female mice (4–8 mice per genotype; two-stage linear step-up procedure of Benjamini, Krieger and Yekutieli). (G) Co-localization of VGLUT2+ puncta (green) and C1q (red) indicated by the arrows in the DCN of 16-month-old female mice. Inserts show enlarged representative examples. (H) Quantification of data from G (2 sections per mouse, 3–5 mice per genotype; Holm-Sidak’s). Each point in the bar graphs represents a mouse. Means ± SEM, significant differences are marked by asterisks. *, p < .05; **, p < 0.01, ***, p < 0.001.
Figure 7.
Figure 7.. Schematic summarizing the differential and overlapping contributions of the increased expression of GM-CSF and G-CSF to the deficits observed in CRL mice, mediated through their regulation of microglia.

Similar articles

Cited by

References

    1. Albert MS (1996). Cognitive and neurobiologic markers of early Alzheimer disease. Proc Natl Acad Sci U S A, 93(24), 13547–13551. doi:10.1073/pnas.93.24.13547 - DOI - PMC - PubMed
    1. Amirzagar N, Nafissi S, Tafakhori A, Modabbernia A, Amirzargar A, Ghaffarpour M, … Harirchian MH. (2015). Granulocyte colony-stimulating factor for amyotrophic lateral sclerosis: a randomized, double-blind, placebo-controlled study of Iranian patients. J Clin Neurol, 11(2), 164–171. doi:10.3988/jcn.2015.11.2.164 - DOI - PMC - PubMed
    1. Armbruster DJ, Ueltzhoffer K, Basten U, & Fiebach CJ (2012). Prefrontal cortical mechanisms underlying individual differences in cognitive flexibility and stability. J Cogn Neurosci, 24(12), 2385–2399. doi:10.1162/jocn_a_00286 - DOI - PubMed
    1. Arreola MA, Soni N, Crapser JD, Hohsfield LA, Elmore MRP, Matheos DP, … Green KN. (2021). Microglial dyshomeostasis drives perineuronal net and synaptic loss in a CSF1R(+/−) mouse model of ALSP, which can be rescued via CSF1R inhibitors. Sci Adv, 7(35). doi:10.1126/sciadv.abg1601 - DOI - PMC - PubMed
    1. Basso L, Lapointe TK, Iftinca M, Marsters C, Hollenberg MD, Kurrasch DM, & Altier C (2017). Granulocyte-colony-stimulating factor (G-CSF) signaling in spinal microglia drives visceral sensitization following colitis. Proc Natl Acad Sci U S A, 114(42), 11235–11240. doi:10.1073/pnas.1706053114 - DOI - PMC - PubMed

MeSH terms

Substances