. 2022 Nov 25;13(11):997.
doi: 10.1038/s41419-022-05431-2.

Translational readthrough of nonsense mutant TP53 by mRNA incorporation of 5-Fluorouridine

Affiliations

Translational readthrough of nonsense mutant TP53 by mRNA incorporation of 5-Fluorouridine

Mireia Palomar-Siles et al. Cell Death Dis. .

Abstract

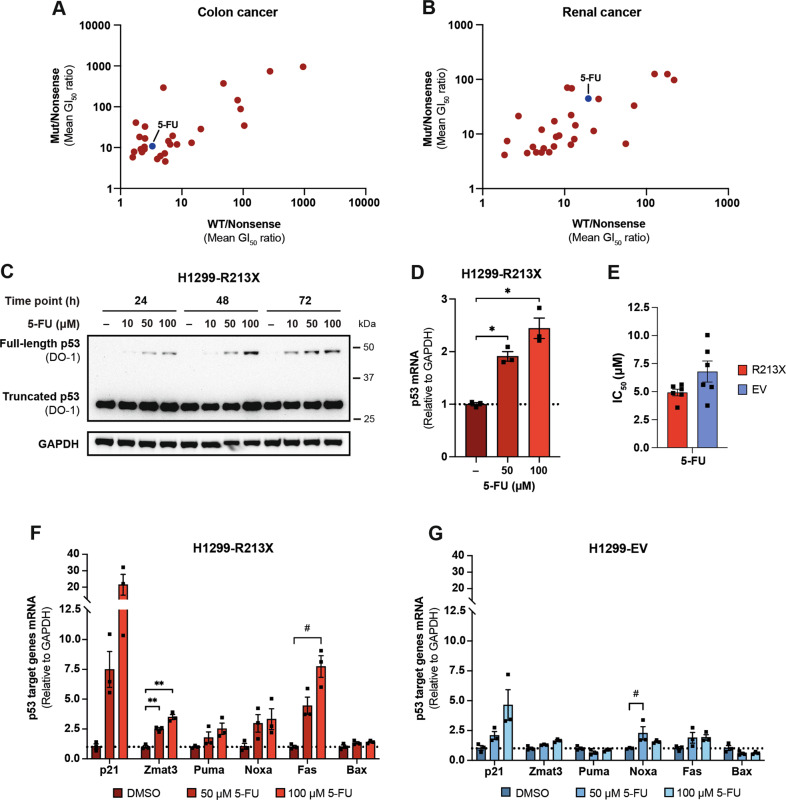
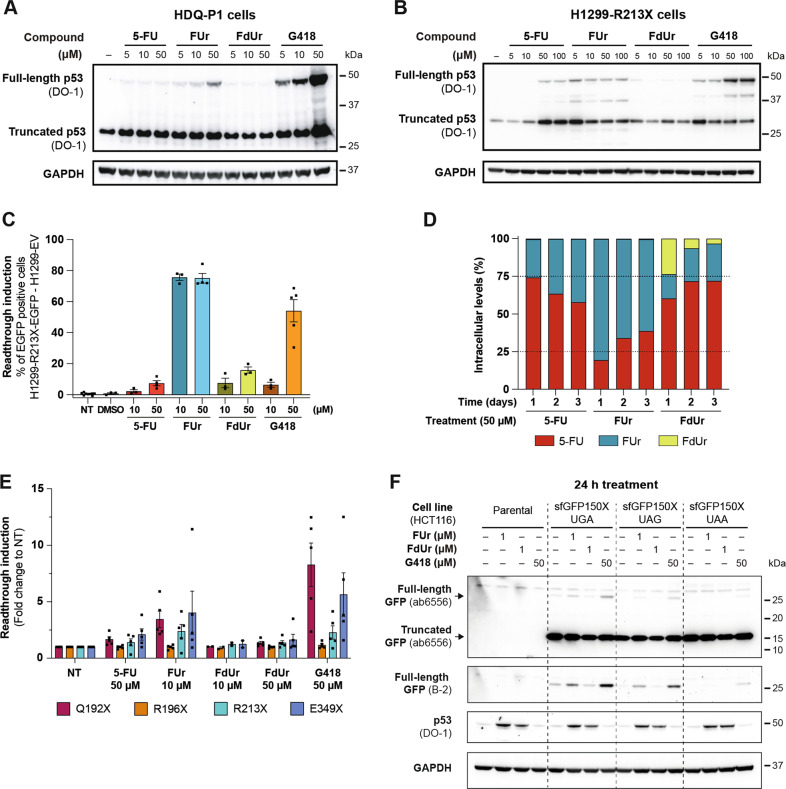
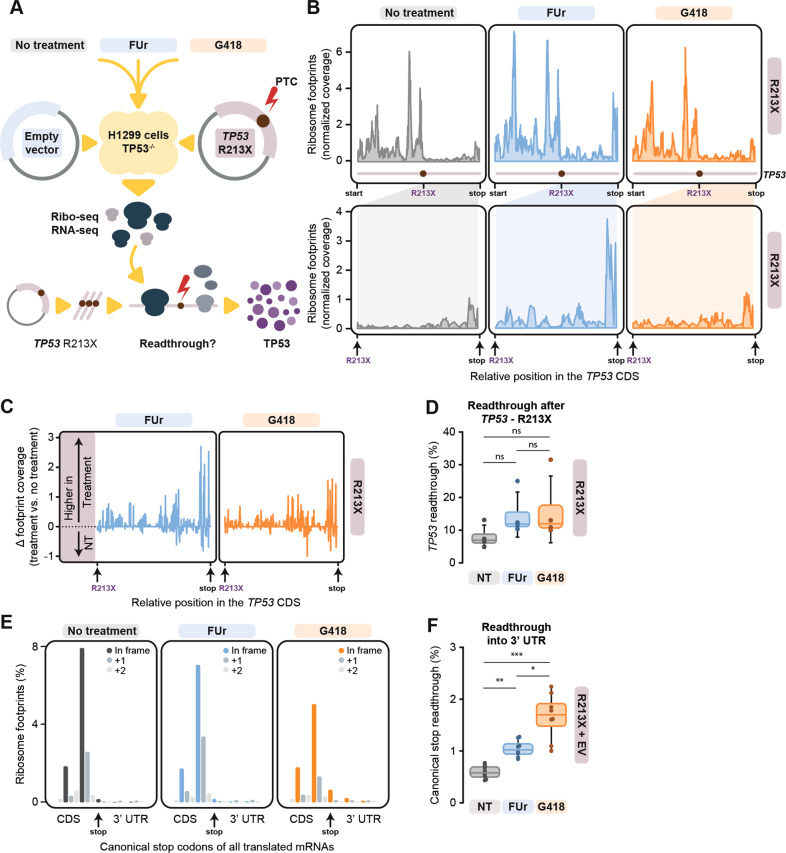
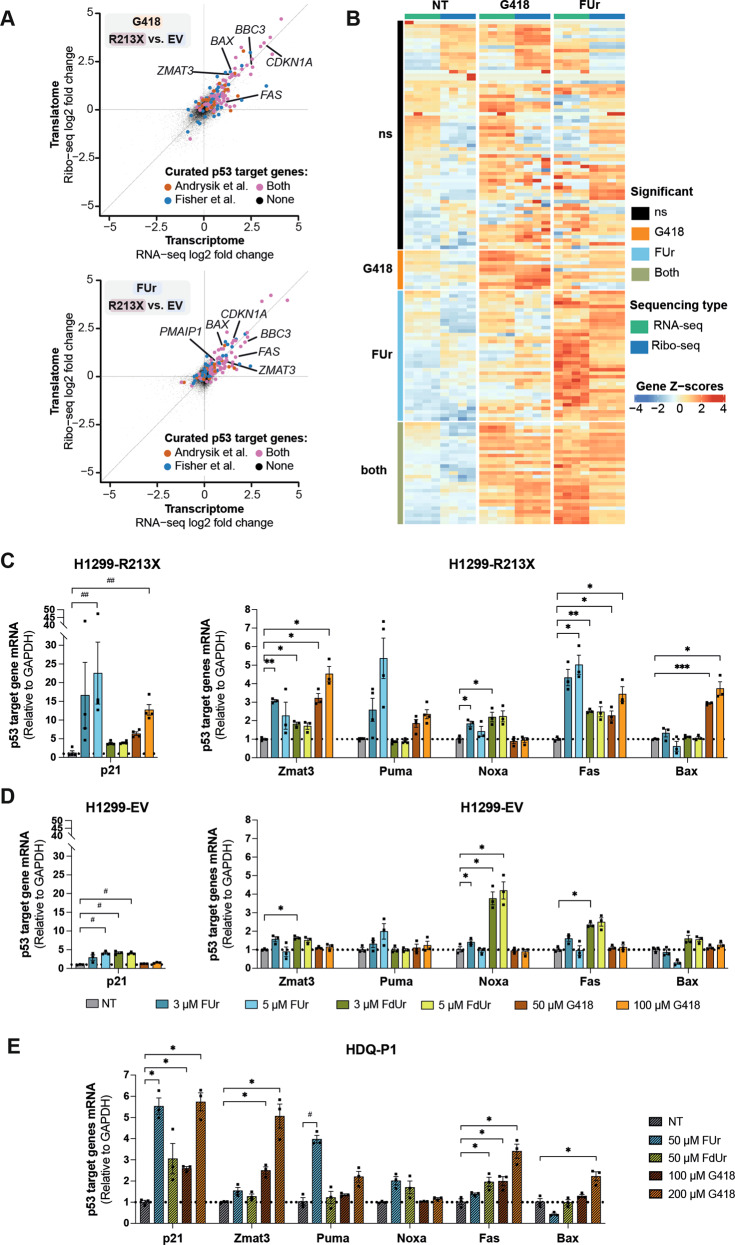
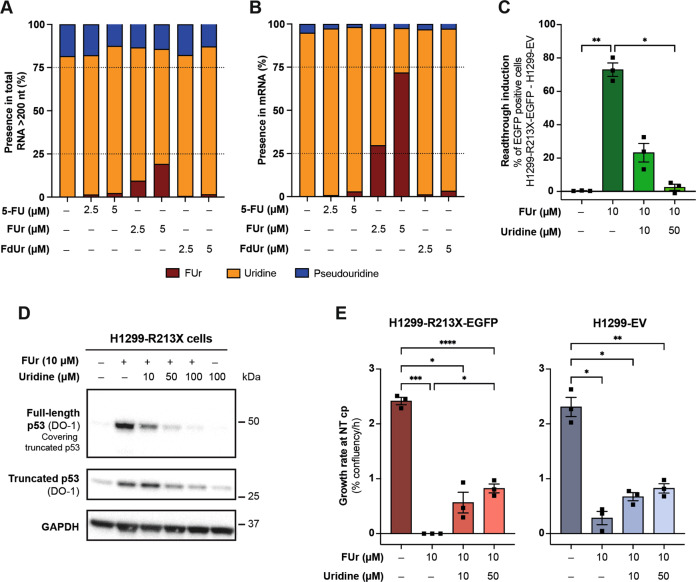
TP53 nonsense mutations in cancer produce truncated inactive p53 protein. We show that 5-FU metabolite 5-Fluorouridine (FUr) induces full-length p53 in human tumor cells carrying R213X nonsense mutant TP53. Ribosome profiling visualized translational readthrough at the R213X premature stop codon and demonstrated that FUr-induced readthrough is less permissive for canonical stop codon readthrough compared to aminoglycoside G418. FUr is incorporated into mRNA and can potentially base-pair with guanine, allowing insertion of Arg tRNA at the TP53 R213X UGA premature stop codon and translation of full-length wild-type p53. We confirmed that full-length p53 rescued by FUr triggers tumor cell death by apoptosis. FUr also restored full-length p53 in TP53 R213X mutant human tumor xenografts in vivo. Thus, we demonstrate a novel strategy for therapeutic rescue of nonsense mutant TP53 and suggest that FUr should be explored for treatment of patients with TP53 nonsense mutant tumors.


Conflict of interest statement

V.J.N.B. and K.G.W. are co-founders and shareholders of Aprea Therapeutics, a company that develops p53-based cancer therapy including APR-246. V.J.N.B. is employed by Aprea Therapeutics as data science consultant. K.G.W. is a member of its Clinical Advisory Board. Research in the K.G.W. lab has received financial support from Aprea Therapeutics. K.G.W. has received a salary from Aprea Therapeutics.

Figures

Fig. 1
Fig. 1. 5-FU induces full-length and transcriptionally active p53.
Ratios of mean 50% growth-inhibitory concentrations (GI50) for 28 top hit compounds between cancer cell lines carrying other TP53 mutations and cancer cell lines carrying nonsense TP53 mutations shown on the y-axis (Mut/Nonsense), and between cancer cell lines carrying WT TP53 and cancer cell lines carrying nonsense TP53 mutations shown on the x-axis (WT/Nonsense) in colon cancer cell lines (A) and renal cancer cell lines (B). Each dot represents one compound. C, Full-length p53 induction by 5-FU in H1299-R213X cells is dose-dependent after 24, 48 or 72 h treatment, according to Western blotting with p53 antibody DO-1. GAPDH was used as loading control and DMSO (-) was used as negative control. Full membrane was blotted with DO-1 antibody, washed and blotted with GAPDH antibody. D, qRT-PCR analysis showing induction of p53 mRNA levels after 50 or 100 µM 5-FU treatment for 72 h in H1299-R213X cells, N = 3. DMSO (-) was used as negative control. E, IC50 (µM) values of 5-FU treatment for 72 h in H1299-R213X and H1299-EV cells, N = 6. F, mRNA levels of p53 target genes p21, Zmat3, Puma, Noxa, Fas and Bax after 50 or 100 µM 5-FU treatment for 72 h measured by qRT-PCR in H1299-R213X cells and G, H1299-EV cells, N = 3. In D, F and G, expression of some genes was examined simultaneously in each cell line with a single GAPDH control; thus, same GAPDH value was used as control for several genes. Gene expression values were normalized to GAPDH expression and to the DMSO-treated sample as negative control. Statistical analyses for each gene were performed comparing each treatment to DMSO control treatment using repeated measures one-way ANOVA followed by Dunnett’s multiple comparisons test (*p ≤ 0.05, **p ≤ 0.01) or Friedman test followed by Dunn’s multiple comparisons test (#p ≤ 0.05) in genes with data not fitting normal distribution. In D, E, F and G, data are represented as mean ± SEM. Each dot represents an independent experiment.
Fig. 2
Fig. 2. 5-FU metabolite FUr rescues nonsense mutant TP53 and sfGFP150X.
A, Western blot analysis of HDQ-P1 cells treated with 5, 10 or 50 µM 5-FU, FUr, FdUr or G418 for 72 h. Full-length p53 is induced in a dose-dependent manner mainly by FUr and G418. B, Western blot analysis of H1299-R213X cells treated with 5, 10, 50 or 100 µM 5-FU, FUr, FdUr or G418 for 72 h. C, TP53 R213X readthrough induction measured by percentage of EGFP positive H1299-R213X-EGFP cells (the percentage of EGFP positive cells in H1299-EV control cells was subtracted). EGFP signal was detected by flow cytometry. Cells were treated with 10 or 50 µM 5-FU, FUr, FdUr or G418 for 72 h, N = 3-5. N = 3 for DMSO-treated control and N = 9 for non-treated control (NT). D, Intracellular levels of 5-FU, FUr or FdUr measured by LC-MS after treatment with 50 µM of each compound for 1, 2 or 3 days. Data are expressed as percentage of total levels of the three compounds per day. E, ELISA analysis of readthrough induction in H1299-R213X-ΔC-FLAG cells carrying TP53 nonsense mutations Q192X, R196X, R213X or E349X after 5-FU, FUr, FdUr or G418 treatment for 72 h. ELISA plates were coated with anti-FLAG antibody to capture full-length p53 and amount of p53 was quantified with DO-1 antibody. Fold change of each sample to non-treated (-) control was calculated for each independent experiment, N = 2-5. F, Western blot analysis of WT TP53 sfGFP150X HCT116 cells carrying a UGA, UAG or UAA PTC at sfGFP codon 150 after 24 h treatment with FUr, FdUr or G418. Full-length GFP was detected with GFP antibody B-2 and truncated GFP with GFP antibody ab6556, WT p53 stabilization was assessed with p53 antibody DO-1. GAPDH was used as loading control and untreated cells (-) as negative control. Membrane was blotted with GFP antibody ab6556, washed and blotted with GFP antibody B-2 to improve detection of the full-length GFP. Membrane was washed and blotted with DO-1 antibody, washed again and blotted with GAPDH antibody. In A and B, full-length and truncated p53 were detected with p53 antibody DO-1. GAPDH was used as loading control and DMSO (-) was used as negative control. Full membrane was blotted with DO-1 antibody, washed and blotted with GAPDH antibody. In C and E, each dot represents an independent experiment. Data are represented as mean ± SEM.
Fig. 3
Fig. 3. Ribosome profiling supports induction of translational readthrough by FUr.
A, Schematic overview of the Ribo-seq experiments. B, Line plots of normalised Ribo-seq read coverage across the entire TP53 CDS (top) and a zoomed view of the region between R213X and the canonical TP53 stop codon (bottom). Locations of start and stop positions and premature termination codon R213X are annotated. C, Segment plots of relative Ribo-seq read coverage of TP53 between the premature termination codon R213X and the canonical stop codon. Positive and negative values indicate coverage changes in H1299-R213X cells upon treatment with either FUr or G418 in comparison to untreated cells. D, Box plot of premature R213X stop codon readthrough ratios observed by Ribo-seq. Ratios were calculated by taking the sum of all in-frame reads after the R213X premature stop until the canonical stop codon and dividing it with the sum of all in-frame reads from the canonical start position until the premature stop codon, normalized for CDS codon length (see Methods), N = 4. Statistical analyses were performed comparing all conditions to each other using Friedman test followed by Dunn’s multiple comparisons test as data did not fit normal distribution (ns = not significant). E, Metagene bar plot showing footprint coverage around the stop codons of annotated reading frames of all translated protein-coding genes. F, Box plot of stop codon readthrough ratios on a metagene level, as determined by Ribo-seq per treatment condition. Ratios were calculated by taking the sums of in-frame reads after the stop codon and dividing these with the sums of in-frame reads before the stop codon, both normalised for feature length. Replicate experiments in H1299-EV and H1299-R213X cells were merged per treatment type for this visualization, N = 8. Statistical analyses were performed comparing all conditions to each other using repeated measures one-way ANOVA followed by Tukey’s multiple comparisons test (*p ≤ 0.05, **p ≤ 0.01, ***p ≤ 0.001). In D and F, each dot represents a replicate experiment. Data are represented as median ± 95% confidence interval, box limits represent the upper and lower quartiles.
Fig. 4
Fig. 4. FUr induces R213X p53-dependent cell death.
A, IC50 (µM) values of FUr, FdUr or G418 treatment for 72 h in H1299-R213X and H1299-EV cells. Each dot represents an independent experiment, N = 4-8. Differences between the two cell lines within each treatment group were compared using independent t-test, ****p ≤ 0.0001. B, Caspase 3/7 cleavage activity in H1299-R213X and H1299-EV cells after treatment with 10 µM FUr or FdUr up to 72 h, N = 3-4. Differences between FUr-treated H1299-R213X vs. H1299-EV cells (p = 0.0029) or between FdUr-treated H1299-R213X vs. H1299-EV cells at 72 h treatment time point were analyzed using independent t-test. C, Plots of a representative experiment of Annexin V staining and EGFP expression as assessed by flow cytometry in H1299-R213X-EGFP and H1299-R213X-ΔC-EGFP cells after 5 µM FUr or 100 µM G418 treatment for 72 h. See also Fig. S4D for the other two experiment replicates. D, Quantification of 3 independent experiments represented in Fig. 4C and Fig. S4D. Mean percentage of Annexin V negative and EGFP negative (grey bars), Annexin V negative and EGFP positive (green bars), Annexin V positive and EGFP negative (orange bars) and Annexin V positive and EGFP positive (blue bars) H1299-R213X-EGFP (FL) or H1299-R213X-ΔC-EGFP (ΔC) cells after treatment with 5 µM FUr or 100 µM G418 for 72 h. N = 3. In A and B, data are represented as mean ± SEM.
Fig. 5
Fig. 5. FUr-induced full-length p53 is transcriptionally active.
A, RNA-seq to Ribo-seq log2 fold-change/fold-change (FC/FC) plots showing differentially transcribed (x axis) and translated (y axis) genes for G418 (top) and FUr (bottom) treatments. Each dot on each graph represents a protein-coding gene. Curated TP53 target genes from Andrysik et al. [35] are coloured red and curated TP53 target genes from Fischer [36] are in blue. Genes found in both lists are coloured purple. Selected TP53 target genes validated by qRT-PCR in (C and D) are labelled by gene symbol, CDKN1A (p21), ZMAT3 (Zmat3), BBC3 (Puma), PMAIP1 (Noxa), FAS (Fas) and BAX (Bax). B, Heatmap showing gene expression of TP53 target gene lists as obtained from Andrysik et al. [35] and from Fischer [36], organized per treatment condition in H1299-R213X cells, as measured by RNA-seq (green, left) and ribo-seq (blue, right). Statistical analyses for each treatment were performed using DESeq2 (ref. [56]), i.e., a Wald test with Benjamin-Hochberg multiple test correction (adjusted p-value ≤ 0.05, log2 fold change ≥ 1) to test for significant genes in Ribo-seq data, colours indicate differentially expressed genes. Normalised counts were transformed to Z-scores for visualisation. C, mRNA levels of p53 target genes genes p21, Zmat3, Puma, Noxa, Fas and Bax after 3 or 5 µM FUr or FdUr, or 50 or 100 µM G418 treatment for 72 h measured by qRT-PCR in H1299-R213X cells and D, in H1299-EV cells. N = 3-4. E, mRNA levels of p53 target genes p21, Zmat3, Puma, Noxa, Fas and Bax after 50 µM FUr or FdUr, or 100 or 200 µM G418 treatment for 72 h measured by qRT-PCR in HDQ-P1 cells. N = 3. In C, D and E, data are represented as mean ± SEM. Values were normalized to GAPDH expression and to the non-treated sample (NT). Statistical analyses for each cell line and each gene were performed comparing each treatment to only each control non-treated (NT) sample using repeated measures one-way ANOVA followed by Dunnett’s multiple comparisons test (*p ≤ 0.05, **p ≤ 0.01, ***p ≤ 0.001) or Friedman test followed by Dunn’s multiple comparisons test (#p ≤ 0.05, ##p ≤ 0.01) in genes with data not fitting normal distribution. In C, D, E, Figure S2A and Figure S2B, expression of some genes was examined simultaneously in each cell line with a single GAPDH control; thus, same GAPDH value was used as control for several genes.
Fig. 6
Fig. 6. FUr is efficiently incorporated into mRNA.
A, Content of FUr, uridine and pseudouridine as percentage of total content of FUr, uridine and pseudouridine after 5-FU, FUr or FdUr treatment for 3 days in total RNA species longer than 200 nucleotides (nt) and B, in mRNA. C, Flow cytometry analysis of readthrough induction after 10 µM FUr treatment alone or in combination with 10 or 50 µM uridine for 72 h. Readthrough induction was assessed by percentage of EGFP positive H1299-R213X-EGFP cells (EGFP positive cells in H1299-EV control cells were subtracted), N = 3. Note that results were obtained in two of the experiments presented in Fig. S6A, so values for two non-treated samples (NT) are the same in both figures. D, Western blot analysis of H1299-R213X cells treated with 10 µM FUr alone or in combination with 10, 50 or 100 µM uridine or 100 µM uridine alone for 72 h. Full membrane was incubated with DO-1 antibody to visualize truncated p53. Truncated p53 was then covered and the membrane was exposed again to show full-length p53 bands. Membrane was cut and blotted with GAPDH, which was used as loading control. E, Cell growth rate of H1299-R213X-EGFP or H1299-EV cells untreated or treated with 10 µM FUr alone or in combination with 10 or 50 µM uridine was monitored up to 72 h with Incucyte® S3 system. Data are presented as cell growth rate in percentage of confluency per hour when growth rate of the non-treated cell population (-) reaches its maximum or critical point (cp), N = 3. Note that results were obtained in two of the experiments presented in Fig. S6B, and so values for two non-treated samples (NT) are the same in both figures. In C and E, data are represented as mean ± SEM. Statistical analyses for each panel were performed comparing all conditions to each other using repeated measures one-way ANOVA followed by Tukey’s multiple comparisons test (*p ≤ 0.05, **p ≤ 0.01, ***p ≤ 0.001, ****p ≤ 0.0001).
Fig. 7
Fig. 7. 5-FU and FUr induce full-length p53 in vivo.
A, Representative images of hematoxylin and eosin (H&E) staining and immunohistochemistry (IHC) of FLAG for full-length p53 detection in H1299-R213X-FLAG xenograft tumors from mice treated with 50 mg/kg of body weight (mg/kg bw) of 5-FU or 10 mg/kg bw of FUr for 5 days in one week. Scale bars = 250 µm. B, Quantification of FLAG staining in Fig. 7A. Data are presented as percentage of FLAG-positive area relative to all tumor area. N = 4 mice in each treatment group, and two sections from each mouse tumor were stained and quantified. Each dot corresponds to one section, data are represented as mean ± SEM. C, Western blot analysis of H1299-R213X-FLAG xenograft tumors from mice treated with 50 mg/kg bw of 5-FU or 10 mg/kg bw of FUr for 5 days in one week. Readthrough induction was detected with FLAG antibody and truncated p53 with p53 antibody DO-1. Cleaved PARP was included as an apoptotic marker and was detected with Cleaved PARP D214 antibody. The p53 target p21 was detected with p21 F-5 antibody. GAPDH was used as loading control. Membrane was cut at 75 and 25 kDa. Upper part was blotted with Cleaved PARP antibody. Middle part was blotted with FLAG antibody, then washed and blotted with DO-1 antibody, washed and blotted with GAPDH antibody. Bottom part was blotted with p21 antibody. Upper arrow indicates full-length p53 and lower arrow truncated p53. D, Western blot quantification of Fig. 7C. Data are presented as expression of each indicated protein relative to GAPDH expression. Each bar corresponds to one mouse.

References

    1. Mort M, Ivanov D, Cooper DN, Chuzhanova NA. A meta-analysis of nonsense mutations causing human genetic disease. Hum Mutat. 2008;29:1037–47. doi: 10.1002/humu.20763. - DOI - PubMed
    1. Linde L, Kerem B. Introducing sense into nonsense in treatments of human genetic diseases. Trends Genet. 2008;24:552–63. doi: 10.1016/j.tig.2008.08.010. - DOI - PubMed
    1. Vousden KH, Prives C. Blinded by the Light: The Growing Complexity of p53. Cell. 2009;137:413–31. doi: 10.1016/j.cell.2009.04.037. - DOI - PubMed
    1. Mello SS, Attardi LD. Deciphering p53 signaling in tumor suppression. Curr Opin Cell Biol. 2018;51:65–72. doi: 10.1016/j.ceb.2017.11.005. - DOI - PMC - PubMed
    1. Kandoth C, McLellan MD, Vandin F, Ye K, Niu B, Lu C, et al. Mutational landscape and significance across 12 major cancer types. Nature. 2013;502:333–9. doi: 10.1038/nature12634. - DOI - PMC - PubMed

Publication types

MeSH terms