. 2022 Nov 25;13(1):6816.
doi: 10.1038/s41467-022-34262-0.

Restoring cellular magnesium balance through Cyclin M4 protects against acetaminophen-induced liver damage

Affiliations

Restoring cellular magnesium balance through Cyclin M4 protects against acetaminophen-induced liver damage

Irene González-Recio et al. Nat Commun. .

Abstract

Acetaminophen overdose is one of the leading causes of acute liver failure and liver transplantation in the Western world. Magnesium is essential in several cellular processess. The Cyclin M family is involved in magnesium transport across cell membranes. Herein, we identify that among all magnesium transporters, only Cyclin M4 expression is upregulated in the liver of patients with acetaminophen overdose, with disturbances in magnesium serum levels. In the liver, acetaminophen interferes with the mitochondrial magnesium reservoir via Cyclin M4, affecting ATP production and reactive oxygen species generation, further boosting endoplasmic reticulum stress. Importantly, Cyclin M4 mutant T495I, which impairs magnesium flux, shows no effect. Finally, an accumulation of Cyclin M4 in endoplasmic reticulum is shown under hepatoxicity. Based on our studies in mice, silencing hepatic Cyclin M4 within the window of 6 to 24 h following acetaminophen overdose ingestion may represent a therapeutic target for acetaminophen overdose induced liver injury.


Conflict of interest statement

The rest of the authors declare no competing interest. U.S. is employed by Silence Therapeutics GmbH. This study is under the patent “Nucleic acids for inhibiting expression of Cnnm4 in a cell”. WO2021239825A1. Inventor: Ute Schaeper, Sibylle Dames, Steffen Schubert, Alfonso Martínez de la Cruz, Jorge Simón Espinosa, Irene González Recio, María Luz Martínez Chantar. (02/12/2021). The present patent previously described identifies the use of Galnac siRNA Cnnm4 for the treatment of liver disease. This article reinforces the validation of this therapeutic approach for the pathology of DILI due to paracetamol overdose.

Figures

Fig. 1
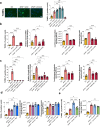
Fig. 1. Cyclin M4 (CNNM4) is overexpressed in DILI patients and preclinical animal models caused by APAP.
a Magnesium serum levels determination in a cohort of AILI patients (n = 24) compared to a group of healthy donors (n = 4). Data are shown as mean ± SEM. ***P < 0.001 (P = 0.001) (Student’s test, two-sided) b Magnesium serum levels was determined in a control group animals (n = 4). and those treated with a single dose of APAP 360 mg/kg for 48 h (n = 4). Data are shown as mean ± SEM. *P < 0.05 (P = 0.033) (Student’s test, two-sided). Changes in mRNA levels of Cnnm1, Cnnm2, Cnnm3, Cnnm4, Trpm6, Trpm7, Mrs2, Mmgt1, and Magt1 in (c) WT hepatocytes under APAP 10 mM compared to a control group (Ctrl) for 1 h, 3 h, and 6 h (d) THLE2 cell line (e) and the experimental groups of APAP 360 mg/kg (n = 4) mice compared to a healthy group (n = 4) at 48 h. Data are shown as mean. f Liver immunohistochemical staining and respective quantification of CNNM4 were determined in the experimental groups of APAP 360 mg/kg for 24 h (n = 4) and 48 h (n = 4) animal models compared to a healthy group (n = 4). Scale bar correspond to 50 µm. Data are shown as mean ± SEM. **P < 0.01, **P < 0.001 (P = 0.01 APAP 24 h vs Ctrl; P = 0.001 APAP 48 h vs Ctrl) (Student’s test, two-sided) g mRNA levels Cnnm4. Data are shown as mean ± SEM. **P < 0.01 (P = 0.0024 APAP 24 h vs Ctrl; P = 0.0059 APAP 48 h vs Ctrl) (Student’s test, two-sided) and h protein expression levels of CNNM4 in a animals treated with a single dose of APAP 360 mg/kg for 24 h (n = 4) and 48 h (n = 4) compared to a healthy group (n = 4), β-ACTIN was used as a loading control. Data are shown as mean ± SEM. ***P < 0.001 (P = 0.00098 APAP 24 h vs Ctrl; P = 0.0009 APAP 48 h vs Ctrl) (Student’s test, two-sided) i Liver immunohistochemical staining and respective quantification of CNNM4 were determined in a cohort of AILI (n = 13) patients compared to a healthy group (n = 3). Scale bar corresponds to 100 µm. Values are represented as mean ± SEM. *P < 0.05 (P = 0.038) (Student’s test, two-sided). Source data are provided as a Source Data file. The image was created with BioRender.com.
Fig. 2
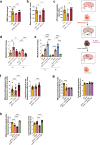
Fig. 2. Silencing Cnnm4 protects against APAP toxicity in primary and human hepatocytes.
a Cell death was evaluated using TUNEL in WT hepatocytes under APAP overdose for 3 h and treated with a siRNA Cnnm1, Cnnm2, Cnnm3, and Cnnm4 or an unrelated control (siCtrl) compared to a control group (Ctrl). Scale bar correspond to 50 µm. Values are represented as mean ± SEM. **P < 0.01 (P = 0.002 APAP vs Ctrl; P = 0.005 APAP + siCnnm2 vs APAP; P = 0.01 APAP + siCnnm3 vs APAP; P = 0.000074 APAP + siCnnm4 vs APAP) (Student’s test, two-sided) b Cell death, apoptosis and necrosis reponse were evaluated using TUNEL and Annexin V Apoptosis and necrosis assay respectively in THLE2 cell line under APAP overdose for 3 h and treated with two different siRNA sequences of Cnnm4 and compared to a control group (Ctrl). Values are represented as mean ± SEM. *P < 0.05, **P < 0.01, ***P < 0.001 (TUNEL P = 0.00001 APAP vs Ctrl; P = 0.00000067 APAP + siCnnm4#1 vs APAP; P = 0.000019 APAP + siCnnm4#2 vs APAP) (mRNA P = 0.00069 APAP vs Ctrl; P = 0.00022 APAP + siCnnm4#1 vs APAP; P = 0.0042 APAP + siCnnm4#2 vs APAP) (Apoptosis P = 0.00000048 APAP vs Ctrl; P = 0.00000002 APAP + siCnnm4#1 vs APAP; P = 0.0000028 APAP + siCnnm4#2 vs APAP) (Necrosis P = 0.0000012 APAP vs Ctrl; P = 0.000014 APAP + siCnnm4#1 vs APAP; P = 0.000023 APAP + siCnnm4#2 vs APAP) (Student’s test, two-sided). c Cell death, apoptosis, and necrosis reponse were evaluated using TUNEL and Annexin V Apoptosis and necrosis assay respectively were evaluated in primary murine hepatocytes treated with different GalNAc Cnnm4 siRNAs (GalNAc#1 and GalNAc#2) at different concentrations 1 nM and 10 nM and exposed to APAP for 3 h compared to untreated control group (Ctrl). Values are represented as mean ± SEM. *P < 0.05, **P < 0.01, ***P < 0.001 (TUNEL P = 0.000055 APAP vs Ctrl; P = 0.000055 APAP + GalNAc#1 1 nM vs APAP; P = 0.000055 APAP + GalNAc#1 10 nM vs APAP; P = 0.000055 APAP + GalNAc#2 1 nM vs APAP; P = 0.000055 APAP + GalNAc#2 10 nM vs APAP) (mRNA P = 0.0039 APAP vs Ctrl; P = 0.00055 APAP + GalNAc#1 1 nM vs APAP; P = 0.00051 APAP + GalNAc#1 10 nM vs APAP; P = 0.0081 APAP + GalNAc#2 1 nM vs APAP; P = 0.00042 APAP + GalNAc#2 10 nM vs APAP) (Apoptosis P = 0.0004 APAP vs Ctrl; P = 0.005 APAP + GalNAc#1 1 nM vs APAP; P = 0.01 APAP + GalNAc#2 1 nM vs APAP) (Necrosis P = 0.027 APAP vs Ctrl; P = 0.0021 APAP + GalNAc#1 1 nM vs APAP; P = 0.0014 APAP + GalNAc#2 1 nM vs APAP) (Student’s test, two-sided). d Cell death, apoptosis, and necrosis response were evaluated using TUNEL and Annexin V Apoptosis and necrosis assay in WT hepatocytes under APAP overdose for 3 h with and without 5 mM of Mg2+, overexpressing Cnnm4 and overexpressing Cnnm4 with Mg2+ compared to a control group (Ctrl). Values are represented as mean ± SEM. *P < 0.05, **P < 0.01, ***P < 0.001 (TUNEL P = 0.000055 APAP vs Ctrl; P = 0.0038 APAP + Cnnm4 vs APAP; P = 0.012 APAP + Cnnm4 + Mg2+ vs APAP) (Apoptosis P = 0.00000088 APAP vs Ctrl) (Necrosis P = 0.0062 APAP vs Ctrl) (Student’s test, two-sided). e Cell death, apoptosis, and necrosis response were evaluated using TUNEL and Annexin V Apoptosis and necrosis assay in WT hepatocytes under APAP overdose for overexpressing Cnnm4 and overexpressing the mutant Cnnm4 T495I and compared to a control group (Ctrl). Values are represented as mean ± SEM. *P < 0.05***P < 0.001 (TUNEL P = 0.000046 APAP vs Ctrl; P = 0.00007 APAP + Cnnm4 vs APAP; P = 0.044 APAP + Cnnm4 T495I vs APAP) (Student’s test, two-sided). Quadrupled were used for experimental conditions. Source data are provided as a Source Data file.
Fig. 3
Fig. 3. Silencing Cnnm4 in hepatocytes reduces mitochondrial dysfunction under APAP toxicity.
a The mitochondrial membrane potential was determined in WT hepatocytes upon 3 h of APAP overdose and treated with a siRNA Cnnm4 or an unrelated control. Values are represented as mean ± SEM. **P < 0.01, ***P < 0.001 (P = 0.011 APAP vs Ctrl; P = 0.0037 APAP + siCnnm4 vs APAP) (Student’s test, two-sided). b Basal respiration using seahorse assay in primary hepatocytes and after 3 h of APAP administration. Values are represented as mean ± SEM. *P < 0.05 (P = 0.043 APAP vs Ctrl; P = 0.02 APAP + siCnnm4 vs APAP) (Student’s test, two-sided). c Mitochondrial ATP production and linked respiration in primary hepatocytes under APAP overdose for 3 h. Values are represented as mean ± SEM. *P < 0.05, **P < 0.01, ***P < 0.001 (P = 0.019 APAP + siCnnm4 vs APAP) (Student’s test, two-sided). The mitochondrial Reactive Oxygen Species was determined in WT hepatocytes upon 1 h and 3 h of APAP treatment using MitoSOX staining and treated with d. siRNA Cnnm4 or an unrelated control. Values are represented as mean ± SEM. *P < 0.05, **P < 0.01, ***P < 0.001 (1 h P = 0.01 APAP vs Ctrl; P = 0.04 APAP + siCnnm4 vs APAP) (3 h P = 0.00089 APAP vs Ctrl; P = 0.000033 APAP + siCnnm4 vs APAP) and e Cnnm4 and Cnnm4 T495I overexpression. Values are represented as mean ± SEM. *P < 0.05, **P < 0.01, ***P < 0.001 (1 h P = 0.0001 APAP vs Ctrl; P = 0.00082 APAP + Cnnm4 vs APAP; P = 0.0000056 APAP + Cnnm4 T495I vs APAP) (3 h P = 0.000014 APAP vs Ctrl; P = 0.0069 APAP + Cnnm4 vs APAP; P = 0.00002 APAP + Cnnm4 T495I vs APAP) (Student’s test, two-sided). Relative intracellular Mg2+ determination by mitochondrial-specific labeling and cytosolic-specific labeling in primary hepatocytes under APAP overdose for 3 h and treated with f. a siRNA Cnnm4 or an unrelated control (siCtrl) compared to a control group (Ctrl). Values are represented as mean ± SEM. ***P < 0.001 (Mitochondrial P = 0.0000000000004 APAP vs Ctrl; P = 0.000000000000026 APAP + siCnnm4 vs APAP) (Cytosolic P = 0.0000000044 APAP + siCnnm4 vs APAP) (Student’s test) g 5 mM and 20 mM Mg2+ supplementation. Values are represented as mean ± SEM. ***P < 0.001 (Mitochondrial P = 0.0000000000000059 APAP vs Ctrl) (Student’s test, two-sided). h Cnnm4 and Cnnm4 T495I overexpression compared to a control group (Ctrl). Quadrupled were used for experimental condition. Values are represented as mean ± SEM. ***P < 0.001 (Mitochondrial P = 1.2E-39 APAP vs Ctrl; P = 2.5E-08 APAP + Cnnm4 WT vs APAP; P = 3.61E-45 APAP + Cnnm4 T495I vs APAP) (Cytosolic P = 2.18E-24 APAP + Cnnm4 WT vs APAP; P = 8.15E-22 APAP + Cnnm4 T495I vs APAP) (Student’s test, two-sided). Source data are provided as a Source Data file. The image was created with BioRender.com.
Fig. 4
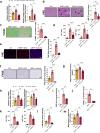
Fig. 4. Silencing Cnnm4 in hepatocytes reduces endoplasmic reticulum stress under APAP toxicity.
a Calcium (Ca2+) release capacity by ER with thapsigargin and ATP upon time under APAP overdose for 3 h treated with a siRNA Cnnm4 or an unrelated control (siCtrl) compared to a healthy group (Ctrl). Triplicates were used for experimental condition. Values are represented as mean ± SEM. ***P < 0.001 (Thapsigargin P = 6E-08 APAP vs Ctrl; P = 1.23E-07 APAP + siCnnm4 vs APAP) (ATP P = 1.3E-10 APAP vs Ctrl; P = 1.24E-11 APAP + siCnnm4 vs APAP) (Student’s test, two-sided). b Western blot analysis of phospho-JNK1/JNK2 (Thr183, Tyr185) (pJNK) and SAPK/JNK (Thr183, Tyr185) ratio, β-ACTIN was used as a loading control under APAP overdose for 1 h. c mRNA levels of Atf-6, Chop, X-box binding protein 1 (Xbp1s/Xbp1u) and binding immunoglobulin protein (Grp78) for 6 h under APAP overdose and treated with a a siRNA Cnnm4 or an unrelated control (siCtrl) compared to a control group (Ctrl). b Cnnm4 and Cnnm4 T495I overexpression compared to a control group (Ctrl). Values are represented as mean ± SEM. ***P < 0.001 (Atf6 P = 0.0003 APAP vs Ctrl; P = 0.00035 APAP + siCnnm4 vs APAP) (Chop P = 3.83E-05 APAP vs Ctrl; P = 0.00024 APAP + siCnnm4 vs Ctrl) (Xbp1 P = 4.95E-06 APAP vs Ctrl; P = 0.00063 APAP + siCnnm4 vs APAP) (Grp78 P = 0.0003 APAP vs Ctrl; P = 0.00057 APAP + siCnnm4 vs APAP) *P < 0.05; **P < 0.01; ***P < 0.001 (Atf6 P = 0.03 APAP vs Ctrl; P = 4.64E-06 APAP + Cnnm4 vs APAP) (Chop P = 8.38E-06 APAP vs Ctrl; P = 0.0022 APAP + Cnnm4 vs APAP; P = 0.0037 APAP + Cnnm4 T495I vs APAP) (Xbp1 P = 7.96E-07 APAP vs Ctrl; P = 8.17E-05 APAP + Cnnm4 vs APAP; P = 8.19E-05 APAP + Cnnm4 T495I vs APAP) (Grp78 P = 0.016 APAP vs Ctrl; P = 0.015 APAP + Cnnm4 T495I vs APAP) (Student’s test, two-sided). d ER tracker red staining with respective quantification in primary hepatocytes for 3 h under APAP overdose and treated with a siRNA Cnnm4 or an unrelated control (siCtrl) compared to a control group (Ctrl). Values are represented as mean ± SEM. ***P < 0.001 (P = 0.00032 APAP vs Ctrl; P = 1.73E-05 APAP + siCnnm4 vs APAP) (Student’s test, two-sided) and e ER tracker red staining with respective quantification in primary hepatocytes for 3 h under APAP overdose and treated with Cnnm4 and Cnnm4 T495I overexpression. Scale bar correspond to 100 µm. Quadrupled were used for experimental condition. Values are represented as mean ± SEM. ***P < 0.001 (P = 0.00013 APAP vs Ctrl; P = 0.00013 APAP + Cnnm4 T495I vs APAP) (Student’s test, two-sided). Source data are provided as a Source Data file.
Fig. 5
Fig. 5. Silencing Cnnm4 prevents hepatotoxicity mediated by APAP overdose in in vivo models.
WT mice were treated with a single dose of APAP 360 mg/kg by intraperitoneal injection and 24 h after siRNA Cnnm4 (n = 5) or an unrelated control (siCtrl) (n = 5) were injected via tail vein injection and compared to control group (n = 5). a mRNA levels and protein expression levels of CNNM4. Values are represented as mean ± SEM. *P < 0.05; ***P < 0.001 (mRNA P = 0.0042 APAP vs Ctrl; P = 9.98E-05 APAP + siCnnm4 vs APAP) (protein P = 0.0068 APAP vs Ctrl; P = 0.036 APAP + siCnnm4 vs APAP) (Student’s test, two-sided). b Liver necrosis was assessed by H&E staining. Scale bar correspond to 100 µm. Values are represented as mean ± SEM. **P < 0.01; ***P < 0.001 (P = 4.88E-05 APAP vs Ctrl; P = 0.0055 APAP + siCnnm4 vs APAP) (Student’s test, two-sided). c Cell death was determined by TUNEL assay in liver tissue. Scale bar correspond to 100 µm. Values are represented as mean ± SEM. ***P < 0.001 (P = 7.37E-05 APAP + siCnnm4 vs APAP) (Student’s test, two-sided). d Transaminases ALT and AST levels were determined in mice serum. Values are represented as mean ± SEM. ***P < 0.001 (ALT P = 1.61E-06 APAP vs Ctrl; P = 0.00084 APAP + siCnnm4 vs APAP) (AST P = 4.9E-05 APAP vs Ctrl; P = 0.0095 APAP + siCnnm4 vs APAP) (Student’s test, two-sided). e ROS in vivo measured by DHE staining in liver sections. Scale bar correspond to 100 µm. Values are represented as mean ± SEM. ***P < 0.001 (P = 5.61E-06 APAP vs Ctrl; P = 2.06E-07 APAP + siCnnm4 vs APAP) (Student’s test, two-sided). f Inflammation assessed by F4/80 staining in liver. Scale bar correspond to 100 µm. Values are represented as mean ± SEM. ***P < 0.001 (P = 5.28E-05 APAP vs Ctrl; P = 3.02E-07 APAP + siCnnm4 vs APAP) (Student’s test, two-sided). g Magnesium levels were determined in mice serum (n = 5). Values are represented as mean ± SEM. **P > 0.01; ***P < 0.001 (P = 0.0087 APAP vs Ctrl; P = 0.001 APAP + siCnnm4 vs APAP) (Student’s test, two-sided). WT mice were treated with a single dose of APAP 360 mg/kg by intraperitoneal injection and 24 h thereafter with 3 mg/kg GalNAc Cnnm4 siRNA (n = 4) or a nontargeting GalNAc conjugated control siRNA (n = 4) were injected via subcutaneous injection. Mice were sacrificed 48 h after APAP overdose. h mRNA levels and protein expression of CNNM4 was determined. Values are represented as mean ± SEM. *P < 0.05; **P < 0.001 (mRNA P = 0.02 APAP + GalNAc vs APAP) (protein P = 0.055 APAP vs Ctrl; P = 0.004 APAP + GalNAc vs APAP) (Student’s test, two-sided). i Liver necrosis was assessed by H&E staining at 48 h after APAP overdose. Values are represented as mean ± SEM. *P < 0.01; ***P < 0.001 (P = 0.0004 APAP vs Ctrl; P = 0.01 APAP + GalNAc vs APAP) (Student’s test, two-sided). j Cell death was assessed by TUNEL assay. Values are represented as mean ± SEM. **P < 0.001 (P = 0.0031 APAP + GalNAc vs APAP) (Student’s test, two-sided). k Transaminases ALT and AST levels were determined in mice serum at 48 h after APAP overdose. Values are represented as mean ± SEM. **P < 0.01; ***P < 0.001 (ALT P = 0.0001 APAP vs Ctrl; P = 0.0017 APAP + GalNAc vs APAP) (AST P = 8.42E-05 APAP vs Ctrl; P = 0.01 APAP + GalNAc vs APAP) (Student’s test, two-sided). l Inflammation assessed by F4/80 staining in liver at 48 h after APAP overdose. Values are represented as mean ± SEM. ***P < 0.001 (P = 0.0073 APAP vs Ctrl; P = 0.0025 APAP + GalNAc vs APAP (Student’s test, two-sided). m Magnesium levels were determined in mice serum at 48 h of APAP overdose. Respective quantifications are represented as mean ± SEM. *P < 0.05, **P < 0.01 (P = 0.04 APAP vs Ctrl; P = 0.0038 APAP + GalNAc vs APAP (Student’s test, two-sided). Source data are provided as a Source Data file.
Fig. 6
Fig. 6. Silencing Cnnm4 reduces ER stress induces by APAP overdose in in vivo models.
Proteomics analysis by LC-MS/MS was assessed in the liver of WT mice treated with a single dose of 360 mg/kg APAP and 24 h after APAP overdose mice were injected with siRNA Cnnm4 (n = 7) or an unrelated control (siCtrl) (n = 7). a Volcano plot of specific proteins regulated by the absence of Cnnm4 was shown. b GO process analysis for the regulated genes in APAP + siCtrl vs APAP + siCnnm4 labeled (APAP + siCtrl) and in APAP + siCnnm4 vs APAP + siCtrl labelled (APAP + siCnnm4). A two-sided Student’s-test was used to address the statistically significant differences between groups. No multiple testing correction procedure was applied. c mRNA levels of Atf-6, Chop, X-box binding protein 1 (Xbp1s/Xbp1u) and binding immunoglobulin protein (Grp78) in WT mice treated with a single dose of APAP 360 mg/kg and 24 h after siRNA Cnnm4 (n = 5) or an unrelated control (n = 5). Values are represented as mean ± SEM. *P < 0.05; **P < 0.01; ***P < 0.001 (Atf6 P = 0.000482 APAP vs Ctrl; P = 0.00079 APAP + siCnnm4 vs APAP) (Chop P = 0.005 APAP vs Ctrl; P = 0.033 APAP + siCnnm4 vs Ctrl) (Xbp1 P = 9.34E-06 APAP vs Ctrl; P = 0.00018 APAP + siCnnm4 vs APAP) (Grp78 P = 0.00016 APAP vs Ctrl; P = 2.61E-05 APAP + siCnnm4 vs APAP) (Student’s test, two-sided). d Western blot analysis of phospho-EIF2α Ser 51 (p-EIF2α) and EIF2α ratio, β-ACTIN was used as a loading control. Quadrupled were used for experimental conditions. Values are represented as mean ± SEM. **P < 0.01; ***P < 0.001 (P = 0.01 APAP vs Ctrl; P = 0.001 APAP + siCnnm4 vs APAP) (Student’s test, two-sided). e mRNA levels of Atf-6, Chop, X-box binding protein 1 (Xbp1s/Xbp1u) and binding immunoglobulin protein (Grp78) in WT mice treated with a single dose of APAP 360 mg/kg and 24 h after with a Cnnm4 GalNAc siRNA molecule (n = 4) or an unrelated control (n = 4). Values are represented as mean ± SEM. *P < 0.05; **P < 0.01; ***P < 0.001 (Atf6 P = 0.01 APAP + siCnnm4 vs APAP) (Chop P = 0.02 APAP vs Ctrl; P = 0.001 APAP + siCnnm4 vs Ctrl) (Xbp1 P = 0.05 APAP vs Ctrl; P = 0.01 APAP + siCnnm4 vs APAP) (Grp78 P = 0.0027 APAP + siCnnm4 vs APAP) (Student’s test, two-sided). f Western blot analysis of PERK, HSP90 was used as a loading control. Quadrupled were used for experimental conditions. Values are represented as mean ± SEM. **P < 0.01 (P = 0.0025 APAP vs Ctrl; P = 0.0059 APAP + siCnnm4 vs APAP) (Student’s test, two-sided). g Celular location of CNNM4 in WT mice liver tissue with an APAP overdose 360 mg/kg for 48 h and compared with a healthy mice. Protein expression was measured in membrane, mitochondria an ER location. CD36, voltage-dependent anion channel (VDAC), and Calnexin (CANX) were used as a loading controls. Triplicates were used for experimental conditions. Values are represented as mean ± SEM. **P < 0.01 (ER P = 0.0059 APAP vs Ctrl) (Student’s test, two-sided). h Basal respiration using seahorse assay in mitochondria extract from mice liver with and 360 mg/kg of APAP overdose and 24 h later, injected with 3 mg/kg GalNAc Cnnm4 or an unrelated control. Values are represented as mean ± SEM. **P < 0.01 (P = 0.0073 APAP + GalNAc vs APAP) (Student’s test, two-sided). Hepatocytes isolated from WT mice treated with a single dose of APAP 360 mg/kg and 24 h later, injected with 3 mg/kg GalNAc Cnnm4 or an unrelated control. i The mitochondrial Reactive Oxygen Species was determined using MitoSOX staining. Values are represented as mean ± SEM. ***P < 0.001 (P = 0.00038 APAP + GalNAc vs APAP) (Student’s test, two-sided) j ATP levels were measured. Values are represented as mean ± SEM. ***P < 0.001 (P = 2.21E-05 APAP + GalNAc vs APAP) (Student’s test, two-sided) k ER tracker red staining. Quadrupled were used for experimental conditions. Values are represented as mean ± SEM. ***P < 0.001 (P = 3.54E-05 APAP + GalNAc vs APAP) (Student’s test, two-sided). Source data are provided as a Source Data file.
Fig. 7
Fig. 7. Cnnm4 knockdown induced liver regeneration in preclinical APAP model.
a mRNA levels of Cyclin D1 and Cyclin D2. Values are represented as mean ± SEM. **P < 0.01; ***P < 0.001 (Cyclin D1 P = 0.01 APAP vs Ctrl; P = 1.31E-05 APAP + siCnnm4 vs APAP) (Cyclin D2 P = 0.042 APAP + siCnnm4 vs APAP) (Student’s test, two-sided). b PCNA expression by immunohistochemistry. Scale bar corresponds to 50 µm in WT mice treated for 48 h with APAP (n = 5) and silenced Cnnm4 by siRNA the last 24 h of the hepatotoxic (n = 5). Changes in mRNA levels of Hepatocyte Growth Factor(Hgf), Heparin Binding EGF Like Growth Factor (Hb-egf), Epidermal Growth Factor (Egf), Betacellulin (Btc), Betacellulin v2 (Btc2), Amphiregulin (Areg), Transforming Growth Factor Alpha (Tgfα), and Transforming Growth Factor Beta (Tgfβ) in c. WT mice treated with a single dose of APAP 360 mg/kg for 48 h (n = 5) and treated with a siCnnm4 for the last 24 h (n = 5) and d WT mice treated with a single dose of APAP 360 mg/kg for 36 h (n = 4) and treated with a Cnnm4 GalNAc siRNA molecule the last 12 h (n = 4). e mRNA expression levels of p21 were determined in WT mice with an APAP overdose for 36 h (n = 4) and treated with Cnnm4 GalNAc siRNA molecule for 12 h (n = 4). Values are represented as mean ± SEM. ***P < 0.001 (P = 0.001 APAP + GalNAc vs APAP) (Student’s test, two-sided). f Western blot analysis of Phospho cMET (Tyr 1230/ Tyr1234/ Tyr1235) in WT mice with an APAP overdose for 36 h (n = 4) and treated with Cnnm4 GalNAc siRNA molecule for 12 h (n = 4). β-ACTIN was used as a loading control. Values are represented as mean ± SEM. Values are represented as mean ± SEM. ***P < 0.001 (P = 0.01 APAP vs Ctrl; P = 0.001 APAP + GalNAc vs APAP) (Student’s test, two-sided). Source data are provided as a Source Data file.
Fig. 8
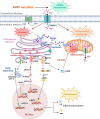
Fig. 8. Overall mechanisms involved in CNNM4 overexpression caused by APAP overdose.
In the liver, APAP overdose leads to increased expression of CNNM4 and an enrichment of its localization in the ER. Under these circumstances, reticulum stress and mitochondrial dysfunction are induced. The activity of CNNM4 is mainly influenced by its role as a magnesium effluxer. Therefore, increased CNNM4 expression reduces both mitochondrial and total cellular magnesium levels. When ER stress occurs, UPR markers, GRP78, ATF-6, PERK, pEIF2α, XBP1, and CHOP, are activated in order to solve the damage. Moreover, IRE1α pathway triggers pJNK activation in order to induce apoptosis. pJNK is translocated to mitochondria resulting in mitochondrial ROS, mitochondrial dysfunction, and consequently cell death. Another characteristic of ER stress is the Ca2+ released into the cytoplasm to induce apoptosis. Finally, inflammation markers such as TNF and IL6 are induced as a consequence of APAP overdose. Silencing of Cnnm4 in the liver was able to reduce mitochondrial dysfunction, ER stress and induce a regenerative response in the hepatocyte to overcome APAP overdose-induced necrosis. The image was created with BioRender.com.

References

    1. Cassidy A, et al. Plasma adiponectin concentrations are associated with body composition and plant-based dietary factors in female twins. J. Nutr. 2009;139:353–358. doi: 10.3945/jn.108.098681. - DOI - PubMed
    1. Grubbs RD. Intracellular magnesium and magnesium buffering. BioMetals. 2002;15:251–259. doi: 10.1023/A:1016026831789. - DOI - PubMed
    1. Shahi A, Aslani S, Ataollahi M, Mahmoudi M. The role of magnesium in different inflammatory diseases. Inflammopharmacology. 2019;27:649–661. doi: 10.1007/s10787-019-00603-7. - DOI - PubMed
    1. Li W, et al. Intakes of magnesium, calcium and risk of fatty liver disease and prediabetes. Vic. Lit. Cult. 2018;21:2088–2095. - PMC - PubMed
    1. Liu M, Yang H, Mao Y. Magnesium and liver disease. Ann. Transl. Med. 2019;7:578. doi: 10.21037/atm.2019.09.70. - DOI - PMC - PubMed

Publication types

MeSH terms