. 2022 Nov 24;13(1):7215.
doi: 10.1038/s41467-022-34747-y.

AMPK induces degradation of the transcriptional repressor PROX1 impairing branched amino acid metabolism and tumourigenesis

Affiliations

AMPK induces degradation of the transcriptional repressor PROX1 impairing branched amino acid metabolism and tumourigenesis

Yanan Wang et al. Nat Commun. .

Abstract

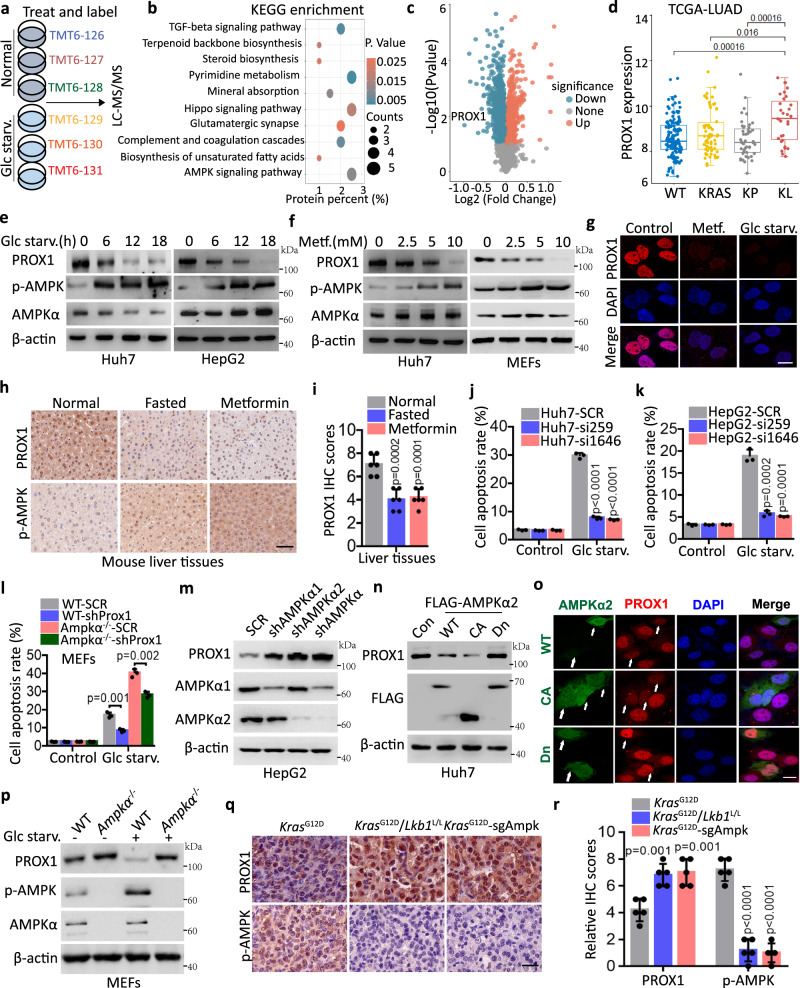
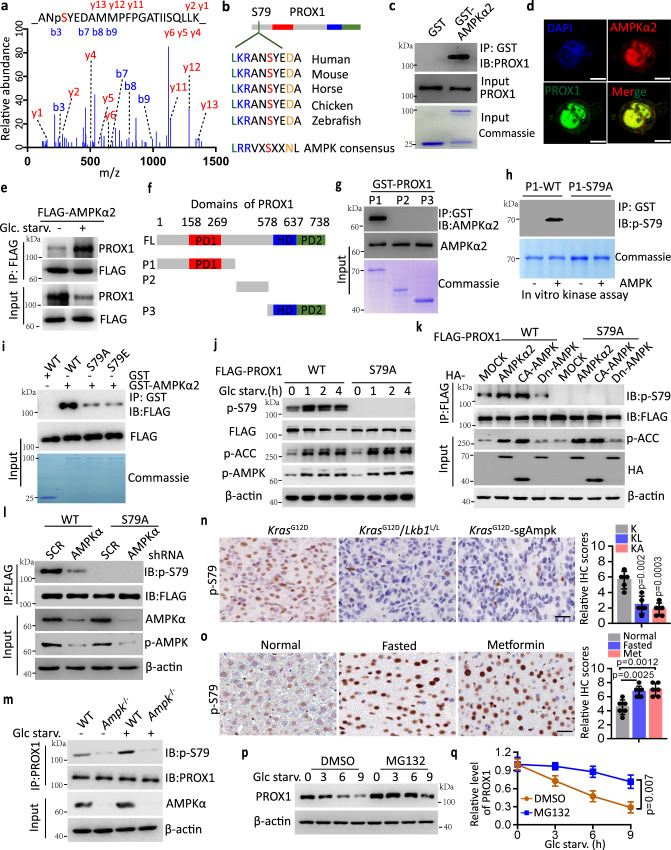
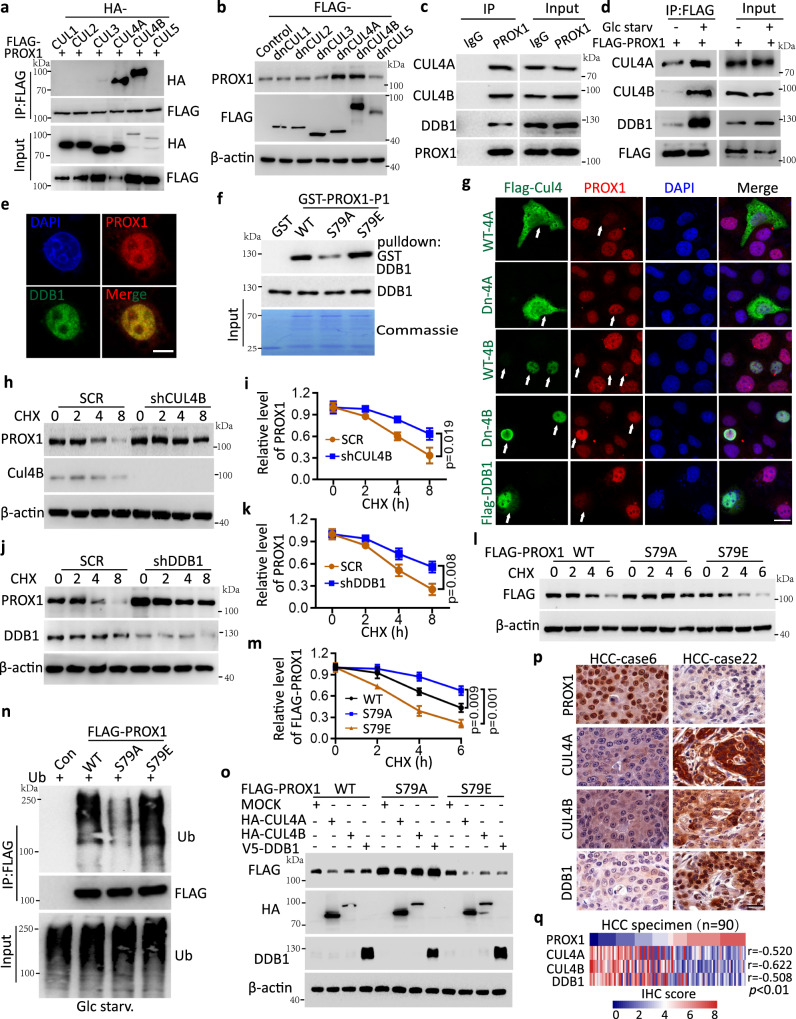
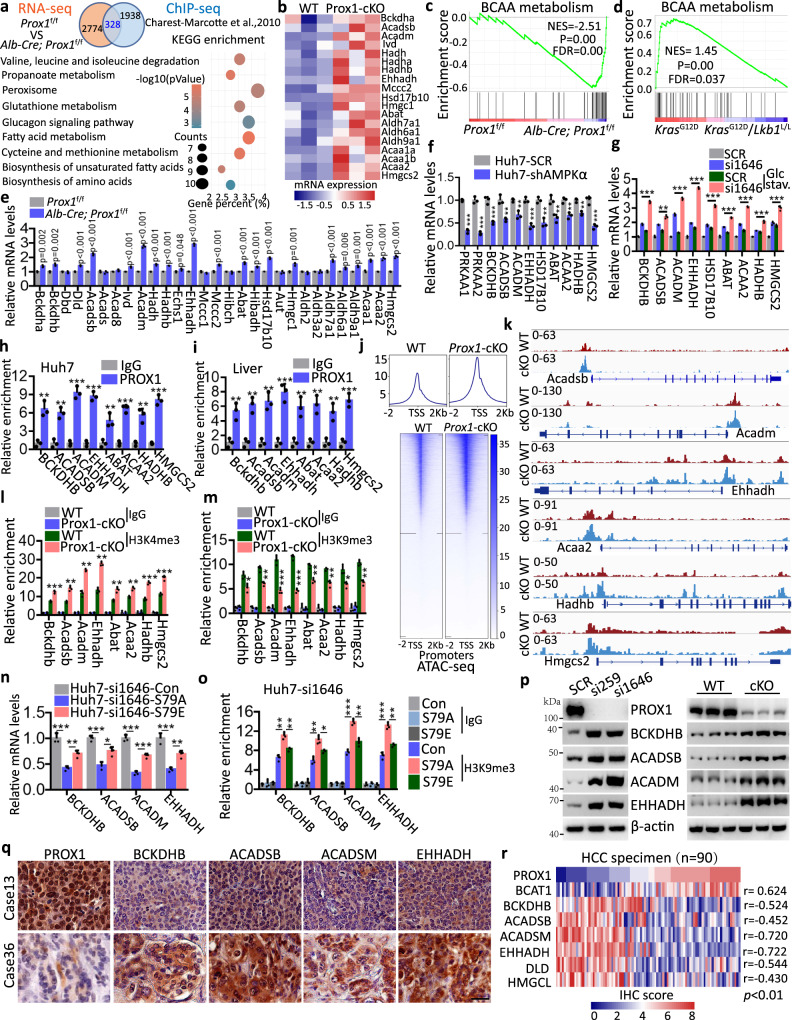
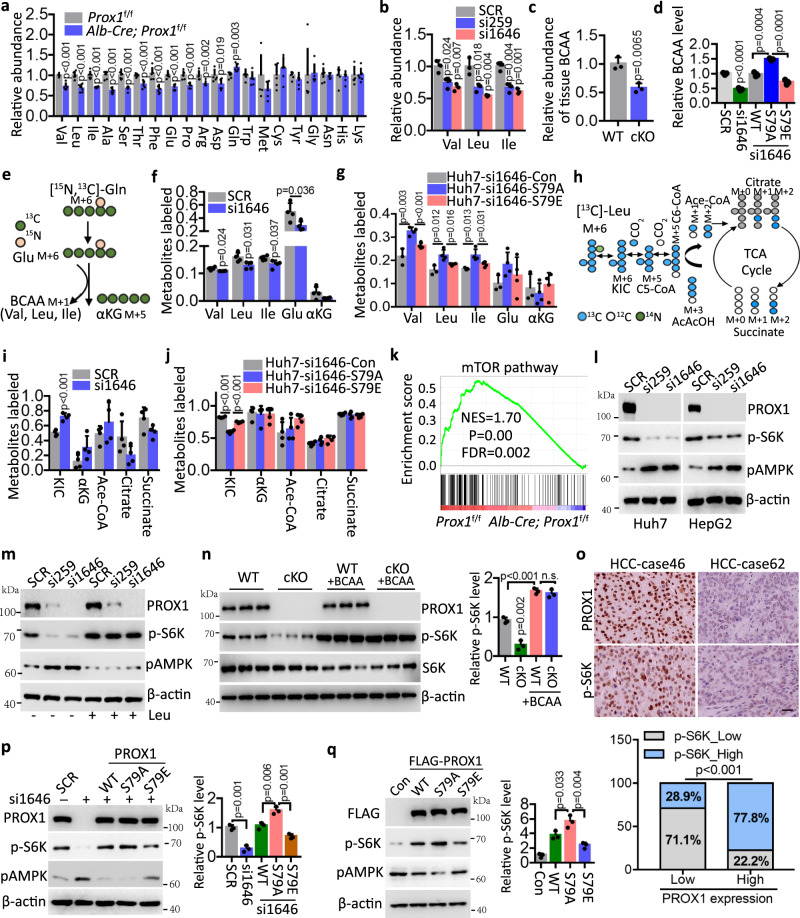
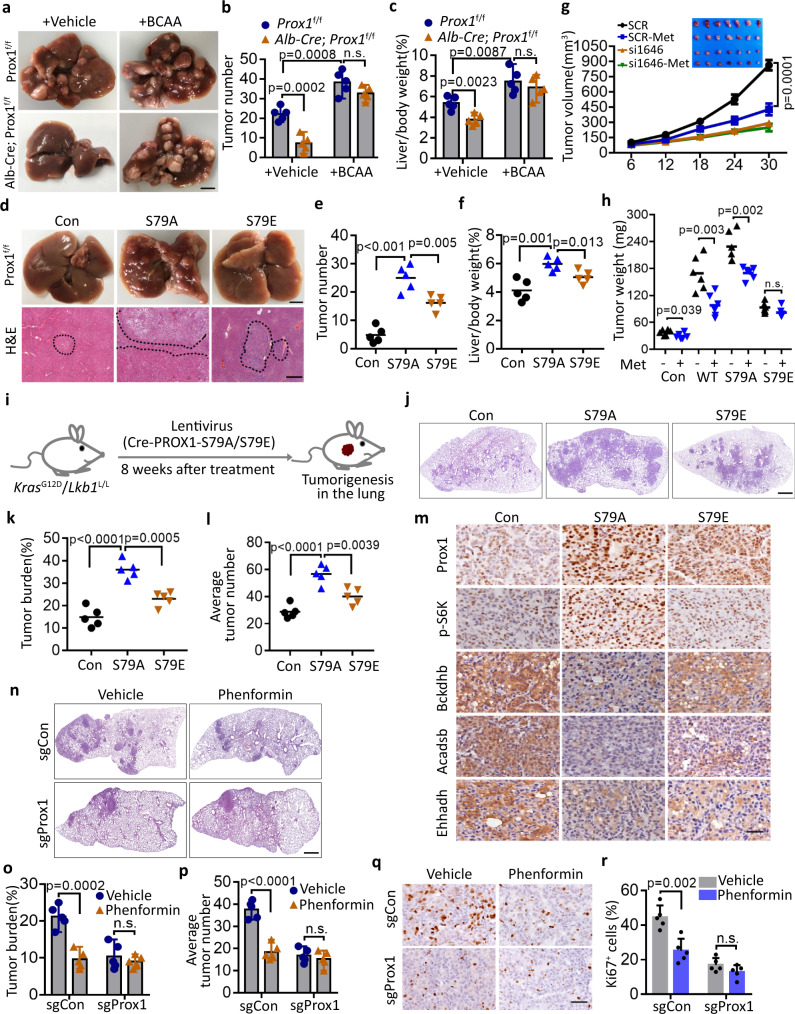
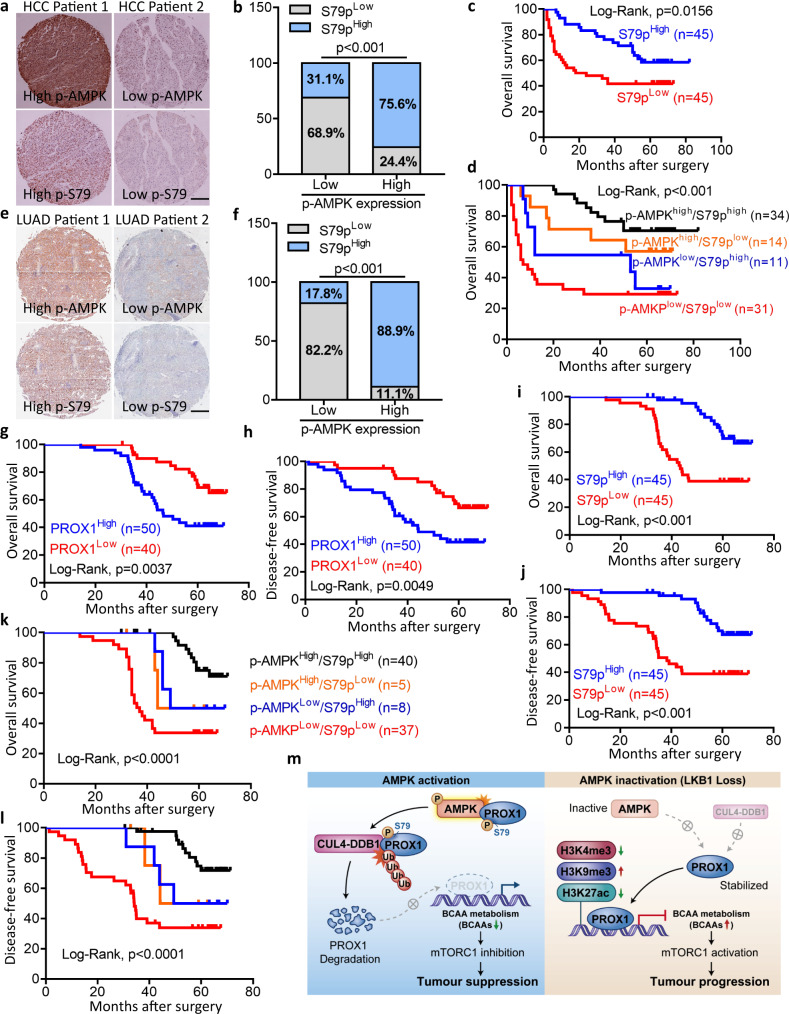
Tumour cell metabolic plasticity is essential for tumour progression and therapeutic responses, yet the underlying mechanisms remain poorly understood. Here, we identify Prospero-related homeobox 1 (PROX1) as a crucial factor for tumour metabolic plasticity. Notably, PROX1 is reduced by glucose starvation or AMP-activated protein kinase (AMPK) activation and is elevated in liver kinase B1 (LKB1)-deficient tumours. Furthermore, the Ser79 phosphorylation of PROX1 by AMPK enhances the recruitment of CUL4-DDB1 ubiquitin ligase to promote PROX1 degradation. Downregulation of PROX1 activates branched-chain amino acids (BCAA) degradation through mediating epigenetic modifications and inhibits mammalian target-of-rapamycin (mTOR) signalling. Importantly, PROX1 deficiency or Ser79 phosphorylation in liver tumour shows therapeutic resistance to metformin. Clinically, the AMPK-PROX1 axis in human cancers is important for patient clinical outcomes. Collectively, our results demonstrate that deficiency of the LKB1-AMPK axis in cancers reactivates PROX1 to sustain intracellular BCAA pools, resulting in enhanced mTOR signalling, and facilitating tumourigenesis and aggressiveness.


Conflict of interest statement

The authors declare no competing interests.

Figures

Fig. 1
Fig. 1. PROX1 functions as a feedback mechanism mediates tumour cell metabolic plasticity upon glucose starvation.
a, b TMT6 labelled quantitative proteomics (a) to investigate the mechanisms for tumour cell metabolic plasticity and KEGG pathway enrichment analysis (b) the differential protein in the Huh7 cells upon glucose starvation (Glc starv.) for 12 h. c Volcano plot shows the total proteins upon glucose starvation by LC-MS/MS. d Comparison of the PROX1 mRNA level between KRAS/TP53/LKB1 wild-type (WT), single KRAS mutation (KRAS), KRAS/TP53 both mutation and KRAS/LKB1both mutation in the lung adenocarcinoma (LUAD) from TCGA database. WT/KRAS/KP/KL: n = 138/66/47/31, maximum = 11.54/12.69/11.74/11.57, upper quartile = 8.95/9.11/8.76/10.28, median = 8.06/8.36/8.10/9.32, lower quartile = 7.63/7.64/7.47/8.17, minimum = 6.16/6.75/6.31/7.24. e, f Western blot analysis the cell lysates upon glucose starvation (e) and metformin treatment (f) as indicated. g Immunofluorescence analysis the Huh7 cells as indicated (n = 3 independent experiments). Scale bar, 10 µm. h, i Liver tissues from normal, fasted and metformin (500 mg/L) treatment mice (n = 6) are subjected to immunohistochemistry (h) and the corresponding quantified graph of liver tissues (i) are shown. Scale bar, 50 µm. j, k The apoptotic analysis of the Huh7 (j) and HepG2 (k) cells were infected with the lentivirus either expressing PROX1 siRNA (si259 or si1646) precursor or scrambled siRNA precursor (SCR) by flow cytometry (n = 3 independent experiments). l The apoptotic analysis of the wild-type (WT) and AMPKα knockout (Ampkα-/-) MEFs were infected as indicated (n = 3). m Immunoblot analysis the cell lysates as indicated. n Western blot analysis the cell lysates overexpression of the wild-type AMPKα2 (WT-AMPK), the constitutively active AMPK (CA-AMPK) and the dominant-negative AMPK (Dn-AMPK). o Representative confocal images of Huh7 cells transfected with WT-, CA- and Dn-AMPKα2 plasmids (n = 3 independent experiments). Scale bar, 10 µm. p Western blot analysis the cell lysates as indicated. q, r Representative IHC staining images (q) and statistical data (r) in the murine lung tumour tissues from KrasG12D/Lkb1L/L and KrasG12D-sgAmpk mouse (n = 5). Scale bar, 50 µm. The immunoblots are repeated independently with similar results at three times. For i–l and r, data represent the mean ± SD. Statistical significance was assessed using two-tailed unpaired Student’s t-test. Source data are provided as a Source Data file.
Fig. 2
Fig. 2. AMPK directly phosphorylates PROX1 at Ser79.
a The Ser79 phosphorylation modification of PROX1 peptides identified through liquid chromatography-tandem mass spectrometry. b The substrate motif of AMPK kinases is shown (lower), and the Ser79 site of PROX1 is conserved in vertebrate. c Coomassie blue staining of GST and GST-AMPKα2 incubated with in vitro translated PROX1, PROX1 was detected by anti-PROX1 antibody after GST-pulldown. d Endogenous PROX1 and AMPKα2 in the Huh7 cells were visualized under fluorescent microscopy (n = 3 independent experiments). Nuclei were stained with DAPI. Scale bar, 10 µm. e Western blot analysis Huh7 cell lysates as indicated. f The domain organization of PROX1 and the deletion constructs. PD1, prospero domain1; HD, homeodomain; PD2, prospero domain 2. g Input, coomassie blue staining of each GST-PROX1 fragment incubated with in vitro translated AMPKα2. AMPKα2 was detected by anti-AMPKα2 antibody after GST-pulldown. h The P1-WT and P1-S79A of PROX1 as indicated was detected using a phosphor-specific antibody against Ser79 of PROX1. i HEK293T-expressed wide type (WT) and replacement of S79 with Ala (A) or Glu (E) in the FLAG-PROX1 (S79A and S79E) incubated with GST-AMPKα2. j Western blot analysis HEK293T cell lysates as indicated. k Immunoblot analysis of HEK293T cell lysates transfected with the indicated PROX1 and HA-AMPKα2 plasmids. l Immunoblot analysis of the FLAG-IP and cell lysates from transfected with the indicated constructs. m Immunoblot analysis of MEFs cell lysates as indicated. n Representative IHC staining images and statistical data of the murine lung tumour tissues from KrasG12D (K), KrasG12D/Lkb1L/L (KL) and KrasG12D-sgAmpk (KA) mouse (n = 5). Scale bar, 50 µm. o Representative IHC staining images and statistical data of the liver tissues from normal, fasted and metformin (500 mg/L) treatment mice (n = 6). Scale bar, 50 µm. p, q Representative western blot (p) and the corresponding quantified graph (q) of Huh7 cell lysates are shown. n = 3 independent experiments. IB, immunoblot; IP, immunoprecipitation. The immunoblots are repeated independently with similar results at three times. For n, o and q, data represent the mean ± SD. Statistical significance was assessed using two-tailed unpaired Student’s t-test. Source data are provided as a Source Data file.
Fig. 3
Fig. 3. Ser79 phosphorylation destabilizes PROX1 in a CUL4-DDB1 E3 ligase-dependent manner.
a Interaction between PROX1 and CUL proteins were analyzed in the HEK293T cells. IP, immunoprecipitation. b Immunoblot analysis of the cell lysates from Huh7 cells transfected with the indicated dominant-negative CUL (dn-CUL1, 2, 3, 4 A, 4B and 5) constructs. c Endogenous PROX1 in the Huh7 cells treated with MG132 (4uM) was immunoprecipitated using anti-PROX1 antibody or isotype IgG control and subjected to immunoblot analysis. d HepG2 cells transfected with FLAG-PROX1 were deprived of glucose for 8 h in the presence of MG132. e Representative confocal images from Huh7 cells (n = 3 independent experiments). Scale bar, 10 µm. f Purified recombinant GST-PROX1 (P1-WT, S79A and S79E) was incubated with DDB1 individually. g Representative confocal images of PROX1 expression in the Huh7 cells transfected with WT- and Dn-CUL4A, 4B constructs, and Flag-DDB1 as the indicated (n = 3 independent experiments). Scale bar, 20 µm. h, i HepG2 cells infected with shRNA lentivirus encoding scramble (SCR) and shCUL4B were treated cycloheximide (CHX, 100 mg/mL). Representative western blot (h) and the corresponding quantified graph (i) are shown (n = 3 independent experiments). j, k HepG2 cells infected with the lentivirus as indicated. Representative western blot (j) and the corresponding quantified graph (k) are shown (n = 3 independent experiments). l, m HEK293T cells transfected with FLAG-PROX1 variants upon glucose starvation were subject to CHX (100 mg/mL) treatment. Representative western blot (l) and the corresponding quantified graph (m) are shown (n = 3 independent experiments). n Ubiquitination levels of FLAG-PROX1 variants in the HEK293T cells upon glucose starvation were immunoprecipitated using anti-FLAG mAb and subjected to immunoblot analysis. o Immunoblot analysis of the cell lysates from HEK293T cells co-transfected plasmids as indicated. p, q Representative IHC staining images (p) and the heatmap (q) of IHC score (by Pearson’s) between PROX1, CUL4A, CUL4B and DDB1 expression in HCC tissues (n = 90). Scale bar, 50 µm. The immunoblots are repeated independently with similar results at three times. For i, k and m, data represent the mean ± SD. Statistical significance was assessed using two-tailed unpaired Student’s t-test. Source data are provided as a Source Data file.
Fig. 4
Fig. 4. PROX1 inhibits BCAA metabolism via mediating an epigenetic modification.
a Venn diagram showing the number genes in the mouse liver with PROX1 binding and displaying expression changes in Prox1 liver specific knockout mice (Alb-Cre; Prox1f/f). KEGG pathway enrichment analysis the above overlapping genes as indicated. b Heatmap demonstration of the gene expression related to valine, leucine and isoleucine degradation (BCAA metabolism) from WT and Prox1-cKO mice (n = 3). c GSEA shows the enrichment of BCAA metabolism in Alb-Cre; Prox1f/f mice. d GSEA shows the enrichment of BCAA metabolism in KrasG12D mice compared with the KrasG12D/Lkb1L/L mice. Statistical significance was assessed using Permutation test. e Real-time PCR analysis the relative mRNA levels of BCAA metabolism genes from Prox1f/f and Alb-Cre; Prox1f/f mice (n = 3). f Real-time PCR analysis the relative mRNA levels from Huh7 cells as indicated (n = 3). g Real-time PCR analysis the relative mRNA levels of Huh7 cells as indicated (n = 3). h, i ChIP-qrtPCR was performed with sonicated chromatins immunoprecipitated from Huh7 cells (h) and mouse liver tissue (i) by anti-PROX1 antibody or preimmune IgG (n = 3). j Heatmap of the gene peaks by ATAC-seq from WT and Prox1-cKO mouse liver tissues. k Density maps for ATAC-seq in liver tissues from WT and Prox1-cKO mice. l, m ChIP analysis of H3K4me3 (l) and H3K9me3 (m) enrichment in mouse liver tissues as indicated (n = 3). n Real-time PCR analysis the relative mRNA levels as indicated (n = 3). o ChIP analysis of H3K9me3 enrichment at the BCAA embolism genes promoter as indicated (n = 3). p Immunoblot analysis cell lysates from Huh7 cells and liver tissues from WT and Alb-Cre; Prox1f/f (cKO) mice as indicated (n = 3). q, r Representative IHC staining images (q) and the heatmap of IHC score (by Pearson’s) (r) between PROX1 and several proteins as indicated in HCC tissues (n = 90). Scale bar, 50 µm. The immunoblots are repeated independently with similar results at three times. n was biological replicates for all experiments. For e–i and l–o, data represent the mean ± SD and *P < 0.05, **P < 0.01, ***P < 0.001. Statistical significance was assessed using two-tailed unpaired Student’s t-test. Source data are provided as a Source Data file.
Fig. 5
Fig. 5. PROX1 activates mTOR pathway via sustaining intracellular BCAA pools.
a Relative abundance of amino acids by LC/MS in liver tissues of Prox1f/f (WT) and Alb-Cre; Prox1f/f (Prox1-cKO) mice (n = 6). b Relative abundance of valine, leucine and isoleucine by LC/MS in Huh7 cells infected with the lentivirus either expressing PROX1 siRNA (si259 or si1646) precursor or scrambled siRNA precursor (SCR) (n = 3). c Relative abundance of BCAA in the liver tissues as indicated (n = 3). d Relative abundance of BCAA in the Huh7 cells as indicated (n = 3). e, f Schematic of isotope tracing in Huh7 cells were traced 24 h with [15N, 13C]-Gln (e), followed by LC/MS analysis of the labelled metabolites (f) (n = 4). g LC/MS analysis of the labelled metabolites in Huh7 cells upon glucose starvation were traced 24 h with [15N, 13C]-Gln (n = 4). h, i Schematic of isotope tracing in Huh7 cells were traced 24 h with [13C]-Leu (h), followed by LC/MS analysis of the labelled metabolites (i) (n = 4). j LC/MS analysis of the labelled metabolites in Huh7 cells as indicated upon glucose starvation were traced 24 h with [13C]-Leu (n = 4). k GSEA shows the enrichment of mTOR pathway in the Prox1f/f mice. Statistical significance was assessed using Permutation test. l Immunoblot analysis of the cell lysates as indicated. m Immunoblot analysis of Huh7 cells with or without Leu (200 µM) as indicated. n Immunoblot analysis of the lysates from the liver tissues with or without BCAA (200%) as indicated, and the relative p-S6K level are shown (n = 3). o Representative IHC staining images (upper) and statistical data (down) of p-S6K and PROX1 expression in HCC tissues (n = 90). Scale bar, 50 µm. p Immunoblot analysis of Huh7 cell lysates as indicated and the relative p-S6K level are shown (n = 3). q Immunoblot analysis of SMMC-7721 cell lysates as indicated and the relative p-S6K level are shown (n = 3). The immunoblots are repeated independently with similar results at three times. n was biological replicates for all experiments. For a–d, f–g, i–j, n and p–q, data represent the mean ± SD. Statistical significance was assessed using two-tailed unpaired Student’s t-test. Source data are provided as a Source Data file.
Fig. 6
Fig. 6. AMPK-PROX1 axis impairs tumourigenesis and dictates therapeutic response.
a–c Analysis of Prox1f/f (WT) and Alb-Cre; Prox1f/f (Prox1-cKO) mice with DEN-induced liver cancer with normal or high BCAA (200%) diets. Representative images of livers (a) and the number of tumours (b), and the Liver/body weight (c) of the mice (n = 5) as indicated. Scale bar, 1 cm. d–f Representative images and H&E staining of livers (d) and the number of tumours (e), and the Liver/body weight (f) of the mice (n = 5) as indicated. g Huh7 cells stably expressing the indicated siRNAs were subcutaneously injected into in nude mice respectively with or without metformin (500 mg/L) treatment. Shown are average tumour volumes over time (n = 7). Data are presented as mean ± SEM. h SMCC-7721 cells stably overexpressing the PROX1 variants were subcutaneously injected into nude mice respectively with or without metformin (500 mg/L) treatment as indicated, and the weights of tumours are shown (n = 6). i Schematic model of lung tumourigenesis from KrasG12D/Lkb1L/L mice treated with a lenti-Cre-PROX1 virus. Eight weeks after nasal inhalation, mice were killed and analysed. j–k Representative H&E image (j) of lung tumour are shown. Scale bar, 500 µm. The tumour burden (k) and average tumour numbers (l) were calculated and plotted (n = 5 mice for each group). m Immunohistochemistry analysis of the levels of Prox1, p-S6K, Bckdhb, Acadsb and Ehhadh in the above tissues as indicated. Scale bar, 50 µm. n–p Representative the H&E image (n) of lung tumour from KrasG12D/Lkb1L/L mice treated with a lenti-Cre-sgPROX1 and sgSCR virus as indicated with or without phenformin (1.5 g/L) treatment (n = 5 mice for each group). Scale bar, 500 µm. Statistical analysis of the tumour burden (o) and average tumour numbers (p) were shown. q, r Representative IHC staining images (q) and statistical data (r) of Ki67 expression in the above tissues (n = 5) as indicated. Scale bar, 50 µm. For b–c, e–f, h, k–l, o–p and r, data represent the mean ± SD. Statistical significance was assessed using two-tailed unpaired Student’s t-test. n.s. not significant. Source data are provided as a Source Data file.
Fig. 7
Fig. 7. AMPK-PROX1 axis in human cancers is associated with patient prognosis.
a, b Representative IHC staining images (a) and statistical data (b) of p-S79 and p-AMPK expression in HCC tissues (n = 90). Scale bar, 500 µm. c Kaplan–Meier analysis of overall survival probability of p-S79 levels in HCC patients. The statistical significance was assessed using log-rank test according to HCC patients with low or high expression of p-S79. d Kaplan–Meier analysis of overall survival in the HCC patients (n = 90) according to combined expression status of p-S79 and p-AMPK. e, f Representative IHC staining images (e) and statistical data (f) of p-S79 and p-AMPK expression in lung adenocarcinoma (LUAD) tissues (n = 90). Scale bar, 500 µm. g, h Kaplan–Meier analysis of overall survival (g) and disease-free survival (h) probability of PROX1 levels in LUAD patients (n = 90). i, j Kaplan–Meier analysis of overall survival (i) and disease-free survival (j) probability of p-S79 levels in LUAD patients. k, l Kaplan–Meier analysis of overall survival (k) and disease-free survival (l) in NSCLC patients according to combined expression status of p-S79 and p-AMPK. m Glucose deprivation activated AMPK directly phosphorylated PROX1 at Ser79, allowing a rapid recruitment of Cul4-DDB1 E3 ubiquitin ligase complex to promote PROX1 degradation, a critical event that activates BCAA metabolism to suppress mTOR signalling pathway. Conversely, the deficient-LKB1-AMPK axis in cancers reactivates PROX1 to dictate BCAA catabolism and mTOR signalling, facilitating tumourigenesis and aggressiveness. For b and f, statistical significance was assessed using two-sided Chi-square test. Source data are provided as a Source Data file.

References

    1. McGuirk S, Audet-Delage Y, St-Pierre J. Metabolic fitness and plasticity in cancer progression. Trends Cancer. 2020;6:49–61. doi: 10.1016/j.trecan.2019.11.009. - DOI - PubMed
    1. Hsu PP, Sabatini DM. Cancer cell metabolism: Warburg and beyond. Cell. 2008;134:703–707. doi: 10.1016/j.cell.2008.08.021. - DOI - PubMed
    1. Vander Heiden MG, Cantley LC, Thompson CB. Understanding the Warburg effect: the metabolic requirements of cell proliferation. Science. 2009;324:1029–1033. doi: 10.1126/science.1160809. - DOI - PMC - PubMed
    1. Schaffer BE, et al. Identification of AMPK phosphorylation sites reveals a network of proteins involved in cell invasion and facilitates large-scale substrate prediction. Cell Metab. 2015;22:907–921. doi: 10.1016/j.cmet.2015.09.009. - DOI - PMC - PubMed
    1. Hawley SA, et al. Characterization of the AMP-activated protein kinase kinase from rat liver and identification of threonine 172 as the major site at which it phosphorylates AMP-activated protein kinase. J. Biol. Chem. 1996;271:27879–27887. doi: 10.1074/jbc.271.44.27879. - DOI - PubMed

Publication types

MeSH terms

Substances