. 2022 Nov 25;13(1):7272.
doi: 10.1038/s41467-022-34935-w.

Alveolar macrophage metabolic programming via a C-type lectin receptor protects against lipo-toxicity and cell death

Affiliations

Alveolar macrophage metabolic programming via a C-type lectin receptor protects against lipo-toxicity and cell death

Michal Scur et al. Nat Commun. .

Abstract

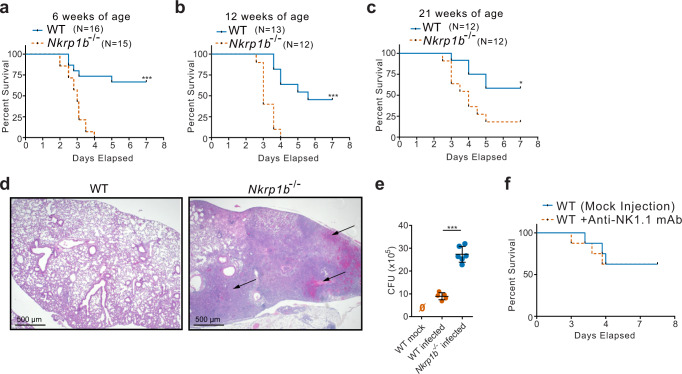
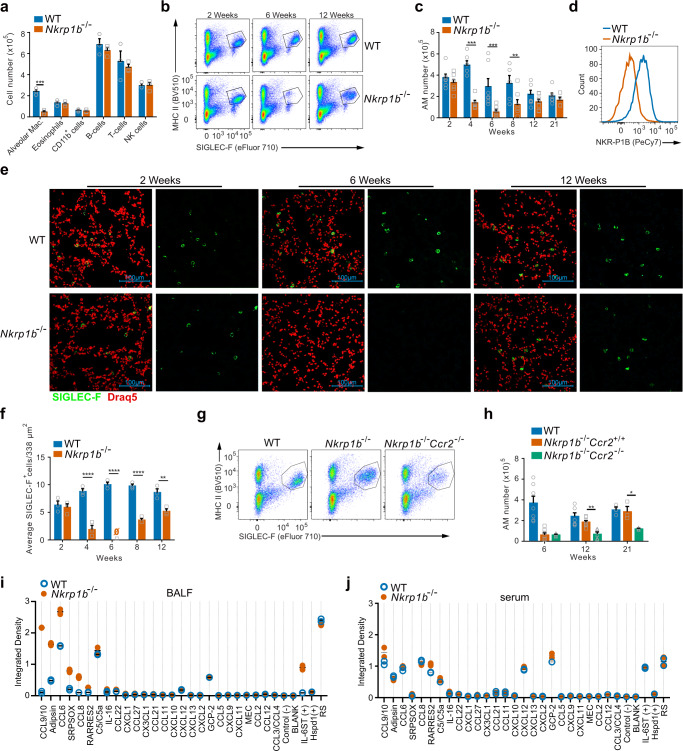
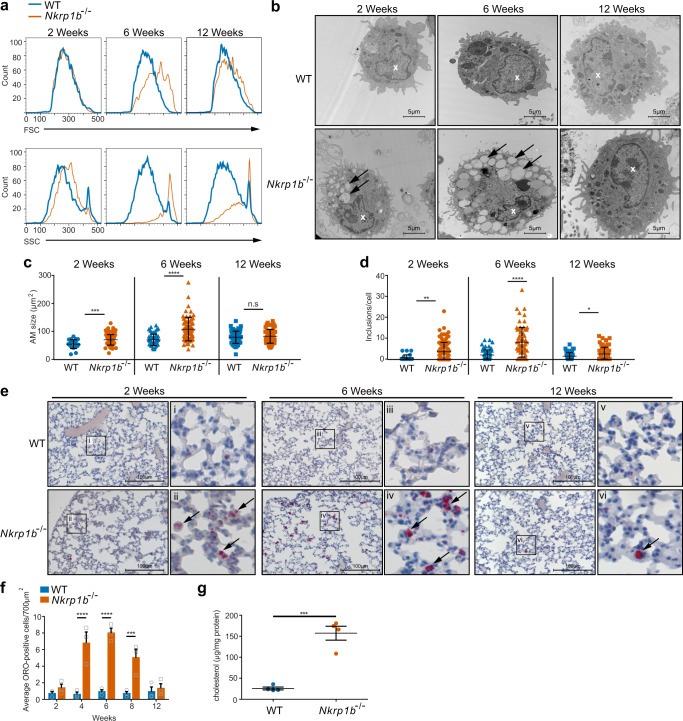
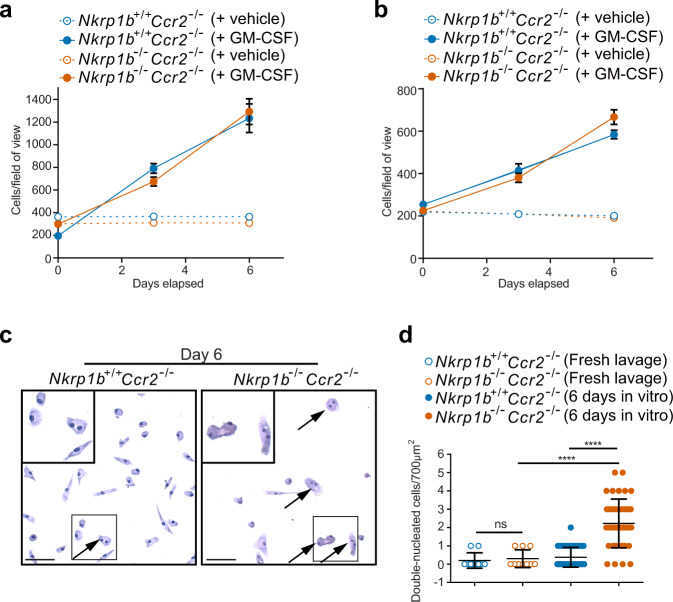
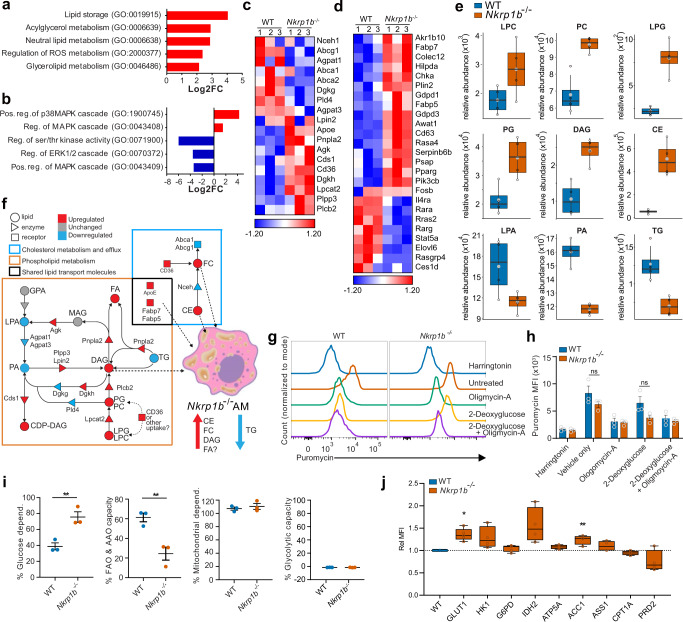
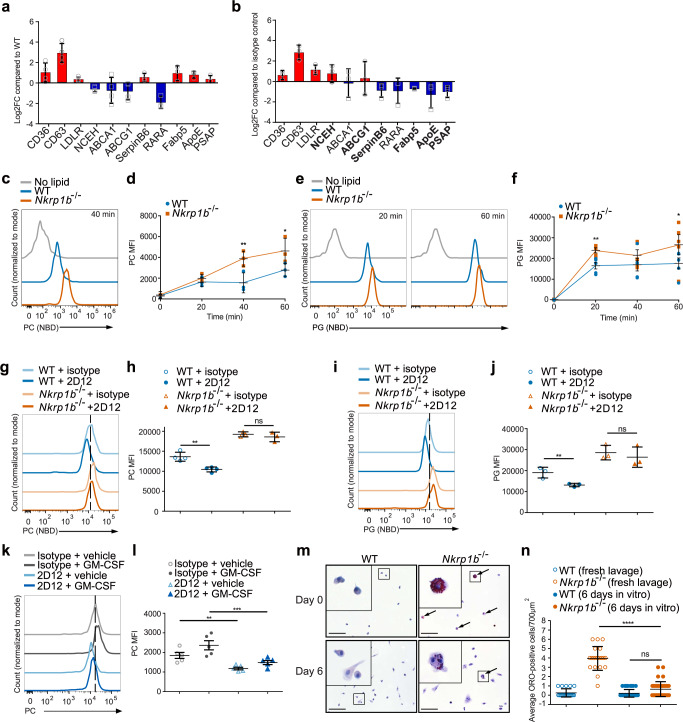
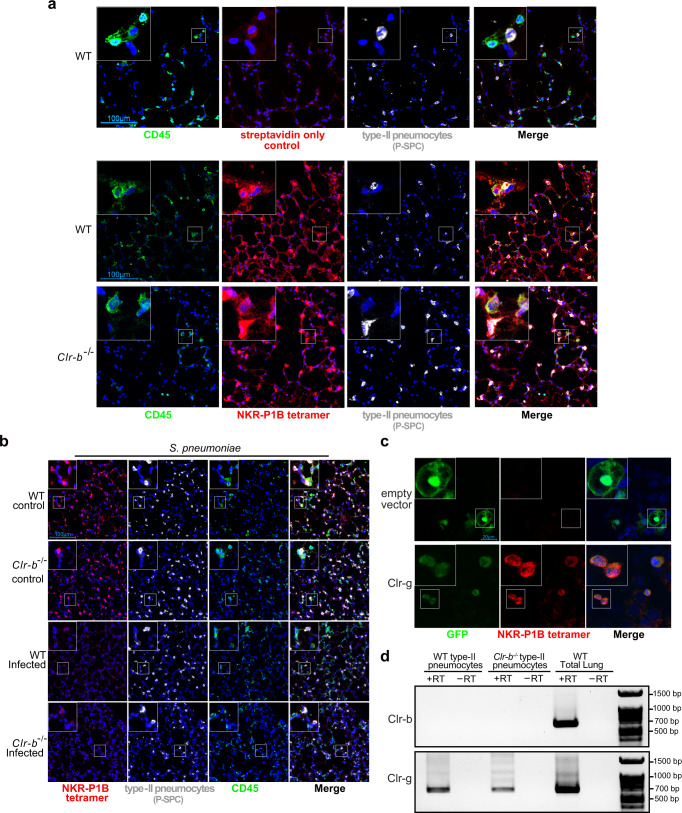
Alveolar macrophages (AM) hold lung homeostasis intact. In addition to the defense against inhaled pathogens and deleterious inflammation, AM also maintain pulmonary surfactant homeostasis, a vital lung function that prevents pulmonary alveolar proteinosis. Signals transmitted between AM and pneumocytes of the pulmonary niche coordinate these specialized functions. However, the mechanisms that guide the metabolic homeostasis of AM remain largely elusive. We show that the NK cell-associated receptor, NKR-P1B, is expressed by AM and is essential for metabolic programming. Nkrp1b-/- mice are vulnerable to pneumococcal infection due to an age-dependent collapse in the number of AM and the formation of lipid-laden AM. The AM of Nkrp1b-/- mice show increased uptake but defective metabolism of surfactant lipids. We identify a physical relay between AM and alveolar type-II pneumocytes that is dependent on pneumocyte Clr-g expression. These findings implicate the NKR-P1B:Clr-g signaling axis in AM-pneumocyte communication as being important for maintaining metabolism in AM.


Conflict of interest statement

The authors declare no competing interests.

Figures

Fig. 1
Fig. 1. NKR-P1B-deficient mice exhibit greater morbidity and mortality upon pneumococcal infection.
ac Kaplan–Meyer curves of WT versus Nkrp1b−/− mice susceptibility to S. pneumoniae at 6-, 12-, and 21 weeks of age, respectively. WT (n = 16, 13, and 12, respectively), Nkrp1b−/− (n = 15, 12, and 12, respectively). *p ≤ 0.005, ***p ≤ 0.001. d Images of mouse lungs stained with H/E, 3 days post-S. pneumoniae infection. Images are representative of three separate experiments. Arrows indicate areas of severe alveolar inflammation, bronchopneumonia, and obstructive changes compounded with the destruction of local vasculature causing bleeding to the alveolar space. 500 μm scale bars shown. e CFU counts of WT and Nkrp1b−/− mice 3 days post pneumococcal infections as determined by plating lavage fluid on blood agar plates. Data presented with mean ± SEM. Statistics represent an unpaired, two-tailed Student’s t-test. ***p < 0.001 (n = 5) for WT and (n = 6) for Nkrp1b−/− mice. f Kaplan–Meyer curves of WT mice susceptibility to S. pneumoniae after depletion of NK cells via anti-NK.1.1 mAb or a mock injection. (n = 8 per group). Source data are provided as a Source Data file.
Fig. 2
Fig. 2. AM express NKR-P1B and NKR-P1B-deficient mice show a gradual loss of AM followed by a CCR2-dependent recovery.
aNumber of various immune cells present in the lungs of WT and Nkrp1b−/− mice at 6 weeks of age as determined by flow cytometric phenotyping. Data presented as mean ± SEM. Significance determined by unpaired, two-tailed Student’s t-test. ***p < 0.001 (n = 3 biologically independent samples). b Flow cytometry dot plots of the numbers of AM from WT and Nkrp1b−/− mice at 2, 6, and 12 weeks of age. Images representative of 7 different experiments. c Quantifications of AM obtained by flow cytometric analysis from WT and Nkrp1b−/− mice at 2, 4, 6, 8, 12, and 21 weeks of age (n = 7 mice per age per genotype). Data presented as mean ± SEM. Statistical significance was determined by two-way ANOVA with Tukey’s correction where p = 0.0011, **p < 0.005, and ***p < 0.0005. d Histogram of NKR-P1B surface expression on WT and Nkrp1b−/− AM. e Compiled stack images of WT and Nkrp1b−/− lungs stained with anti-SIGLEC-F antibody (green) and the nuclear stain DRAQ5 (Red). 100 μm scale bars shown. Images are representative of 6 experiments. f Quantifications of AM present in the lungs of WT and Nkrp1b−/− mice as determined by confocal imaging of immunofluorescent stains in (e) (n = 6 mice per age per genotype). Data presented as mean ± SEM. Data presented as a number of SIGLEC-F positive cells/338 µm2. Statistics were determined by two-way ANOVA with Tukey’s correction where p = 0.0094, ***p < 0.001, and ****p < 0.0001. g Flow cytometry plots of AM found in the lungs of 12-week-old WT, Nkrp1b−/−, and Nkrp1b−/−Ccr2−/− mice. Images representative of five experiments. h Quantification of AM from 12-week-old WT, Nkrp1b−/− and Nkrp1b−/−Ccr2−/− mice. Data presented as mean ± SEM. n = 7. i and j Quantification of chemokine dot blot array performed on WT and Nkrp1b−/− lavage fluid (BALF) or serum derived from 6-week-old mice. In all graphs and histograms, WT is blue, Nkrp1b−/− is orange, and Nkrp1b−/−Ccr2−/− is green. Source data are provided as a Source Data file.
Fig. 3
Fig. 3. Nkrp1b/ AM accumulate intracellular lipids over time.
a FSC and SSC profiles of AM isolated from WT and Nkrp1b/ mice at 2, 6, and 12 weeks of age. b Images of AM as seen by TEM isolated from WT and Nkrp1b/ mice at 2, 6, and 12 weeks of age. Images are representative of three independent experiments. Inclusions are highlighted by arrows; the nucleus is highlighted with a white “x”. c and d Quantifications of AM surface area and a number of electron-poor inclusions, respectively, as seen by TEM. AM isolated from mice aged 2, 6, and 12 weeks. Data presented as mean ± SEM. Statistics in c and d were determined by an unpaired, two-tailed Student’s t-test where *p < 0.05, **p < 0.01, ***p < 0.001, and ****p < 0.0001. n = 3 with 55 AM examined per experiment. e Lung sections stained with ORO obtained from WT and Nkrp1b/ mice 2, 6, and 12 weeks of age at ×20 magnification. Boxed areas (i–vi) within each image are shown in magnified panels to the right. Arrows indicate ORO-positive staining. Images are representative of three independent experiments. f Quantifications of ORO-positive cells/700 μm2 in frozen lung sections stained with ORO obtained from WT and Nkrp1b/ mice at 2, 4, 6, 8, and 12 weeks of age. For WT and Nkrp1b/ n = 3 mice per age. Data presented as mean ± SEM. g Cholesterol content of WT and Nkrp1b/ lavaged AM as determined by amplex-red assays. Data presented as mean ± SEM. n = 4 WT and Nkrp1b/ mice. Statistics were determined by an unpaired, two-tailed Student’s t-test where ***p < 0.001. All graphs and histograms  indicate WT in blue and Nkrp1b/ in orange. Source data are provided as a Source Data file.
Fig. 4
Fig. 4. Nkrp1b/ AM show signs of cell cycle deficiency in vivo, but not in vitro.
a and b Quantification of a number of visible cells per field of view taken from Nkrp1b+/+Ccr2−/− and Nkrp1b/Ccr2/ mice at 2 and 6 weeks of age, respectively (n = 4 mice per treatment group of each age). Cell numbers were quantified on days 0, 3, and 6 post-plating. Data presented as mean ± SEM. c Images of AM isolated from Nkrp1b+/+Ccr2−/− and Nkrp1b/Ccr2/ mice after being kept in vitro for 6 days and stained with hematoxylin. Nkrp1b/Ccr2/ frame highlighting double nucleated cells (arrows). Select cells within inset boxes are shown magnified in the top left corner. Images are representative of three independent experiments. 50 μm scale bars are shown. d Quantifications of double-nucleated cells as seen in c from freshly lavaged AM from Nkrp1b+/+Ccr2/ and Nkrp1b/Ccr2/ (n = 2 mice per genotype) or AM lavaged from Nkrp1b+/+Ccr2/ and Nkrp1b/Ccr2/ and kept in vitro for 6 days (n = 4 mice per genotype). Data presented as mean ± SEM. Statistics were determined by an unpaired, two-tailed Student’s t-test where ****p < 0.0001. In all graphs, Nkrp1b+/+ is indicated in blue and Nkrp1b/ in orange. Source data are provided as a Source Data file.
Fig. 5
Fig. 5. RNA-Seq and lipidomics indicate a dysregulation of metabolism in Nkrp1b/ AM.
a and b Gene ontology pathways enriched (Log2 fold change) in Nkrp1b/ AM from 2-week-old mice as determined by RNA-Seq analysis. c and d Heatmaps of select lipid metabolic and general metabolic genes in AM. Log2 fold change enrichment presented as Z-scores (n = 3 replicates) for WT and Nkrp1b/ with a pool of five mice for every replicate. e Comparison between the abundance of an indicated lipid species and internal lipid standards from lipidomic analysis of AM from 6-week-old WT and Nkrp1b/ mice (n = 4 independent experiments per genotype). LPC (Lysophosphatidylcholine), PC (Phosphatidylcholine), LPG (Lysophosphatidylglycerol), PG (Phosphatidylglycerol), DAG (Diacylglyceride), CE (Cholesterol ester), LPA (Lysophosphatidic acid), PA (Phosphatidic acid), TG (Triglyceride). Boxplots indicate median, IQR, maximum, and minimum bars. Large and small data points represent average SD and individual experimental replicates, respectively. f Model combining RNA-seq (c) and lipidomics (e) data showing increased (red) or decreased (blue) lipid species and enzyme/receptor expression in Nkrp1b/ AM. Dashed arrows indicate lipid shuttling into droplets. g Representative histograms of puromycin incorporation into WT and Nkrp1b/ AM from 2-week-old mice exposed to Harringtonin, Vehicle/untreated control, Oligomycin-A, 2-Deoxyglucose, 2-Deoxyglucose + Oligomycin-A (n = 3 independent experiments). h MFI quantification of puromycin incorporation into AM as shown in (g). Data presented as mean ± SEM, each data point represents an independent experiment of 3 mice of each genotype pooled. Statistics represent two-way ANOVA with Sidak’s correction (n = 3). i Percent glucose dependence and FAO/AAO capacity in WT and Nkrp1b/ AM derived from MFIs in (h) (n = 3 independent experiments). See methods for equations. Data presented as mean ± SEM. Statistics in i represent unpaired, two-tailed Student’s t-test; *p < 0.05 and **p < 0.01. j Relative MFI of stained metabolic proteins in WT and Nkrp1b/ AM (n = 4 mice per genotype per stain). Boxplots indicate mean, IQR, and data minimum and maximum whiskers. Statistics represent unpaired, two-tailed Student’s t-test of data prior to normalization; *p < 0.05 and **p < 0.01. Source data are provided as a Source Data file.
Fig. 6
Fig. 6. NKR-P1B signaling correlates with the rate of surfactant lipid uptake by AM.
a RT-qPCR of select metabolic genes from WT and Nkrp1b/ AM from 2-week-old mice. Data normalized to WT levels. b RT-qPCR analysis of WT AM crosslinked with 2D12 or isotype antibody. Data normalized to isotype control. c Fluorescence of WT and Nkrp1b/ AM after 40 min NBD-PC incubation. d MFI of WT and Nkrp1b/ AM after 0, 20, 40, and 60 min NBD-PC incubation. e Fluorescence of WT and Nkrp1b/ AM after 20 and 60 min incubation with NBD-PG. f MFI of WT and Nkrp1b/ AM after 0, 20, 40, and 60 min NBD-PG incubation. g NBD-PC uptake in WT and Nkrp1b/ AM crosslinked with 2D12 or isotype control. h MFI of NBD-PC uptake in (g). i NBD-PG uptake in WT and Nkrp1b/ AM crosslinked with 2D12 or isotype control. j MFI of NBD-PG uptake in (i). k NBD-PC uptake in WT AM crosslinked with 2D12 or isotype control in the presence of GM-CSF or vehicle control. l MFI of NBD-PC uptake in (k). Data in ad, gj (n = 3 independent experiments). Data in e, f, k, l (n = 5 independent experiments). m Images of WT and Nkrp1b/ AM after 0 or 6 days of in vitro culture post-ORO staining. 100 μm scale bars shown. ORO-staining indicated (arrows). n Quantification of ORO-positive AM/700 µm2 shown in (m). Data in m and n represent (n = 2; day 0) or (n = 3; day 6) independent experiments. Data in a and b show mean ± SD and d, f, h, j, l, n show mean ± SEM. Statistics for d and f represent an unpaired, two-tailed Student’s t-test of data prior to normalization where *p < 0.05 and **p < 0.01. Statistics for h, j, l, and n represent a two-way ANOVA with Tukey’s correction where **p < 0.01, ***p < 0.001, and ****p < 0.0001. All graphs and histograms indicate WT in blue and Nkrp1b/ in orange. Source data are provided as a Source Data file.
Fig. 7
Fig. 7. Infection downregulates NKR-P1B ligand expression.
a Confocal image stacks of WT and Clr-b/ frozen lung sections stained with CD45 (Green), NKR-P1B tetramer (Red), DAPI (Blue), and pro-surfactant protein C (White). b Confocal image stacks of WT and Clr-b/ frozen lung sections post-infection with S. pneumoniae harvested 3 days post-infection. Sections are stained with CD45 (Green), NKR-P1B tetramer (Red), DAPI (Blue), and pro-surfactant protein C (White). c MLE-12 cells transiently transfected with either empty vector or Clr-g expressing vector. Vector contains a separate GFP message for verification of transfection. Cells were grown on coverslips and stained 48 h post-transfection. d RT-PCR amplification of Clr-b and Clr-g transcripts in type-II pneumocytes sorted from WT and Clr-b/ lungs. No reverse transcriptase (−RT) controls and WT total lung controls are shown. All data presented are representative of n = 3 independent experiments. Source data are provided as a Source Data file.

Similar articles

Cited by

References

    1. Epelman S, Lavine KJ, Randolph GJ. Origin and functions of tissue macrophages. Immunity. 2014;41:21–35. doi: 10.1016/j.immuni.2014.06.013. - DOI - PMC - PubMed
    1. Misharin AV, Morales-Nebreda L, Mutlu GM, Budinger GRS, Perlman H. Flow cytometric analysis of macrophages and dendritic cell subsets in the mouse lung. Am. J. Respir. Cell Mol. Biol. 2013;49:503–510. doi: 10.1165/rcmb.2013-0086MA. - DOI - PMC - PubMed
    1. Guilliams M, et al. Alveolar macrophages develop from fetal monocytes that differentiate into long-lived cells in the first week of life via GM-CSF. J. Exp. Med. 2013;210:1977–1992. doi: 10.1084/jem.20131199. - DOI - PMC - PubMed
    1. Shibata Y, et al. GM-CSF regulates alveolar macrophage differentiation and innate immunity in the lung through PU.1. Immunity. 2001;15:557–567. doi: 10.1016/S1074-7613(01)00218-7. - DOI - PubMed
    1. Hashimoto D, et al. Tissue-resident macrophages self-maintain locally throughout adult life with minimal contribution from circulating monocytes. Immunity. 2013;38:792–804. doi: 10.1016/j.immuni.2013.04.004. - DOI - PMC - PubMed

Publication types