. 2022 Nov 25;13(1):7260.
doi: 10.1038/s41467-022-34998-9.

GPSM1 impairs metabolic homeostasis by controlling a pro-inflammatory pathway in macrophages

Affiliations

GPSM1 impairs metabolic homeostasis by controlling a pro-inflammatory pathway in macrophages

Jing Yan et al. Nat Commun. .

Abstract

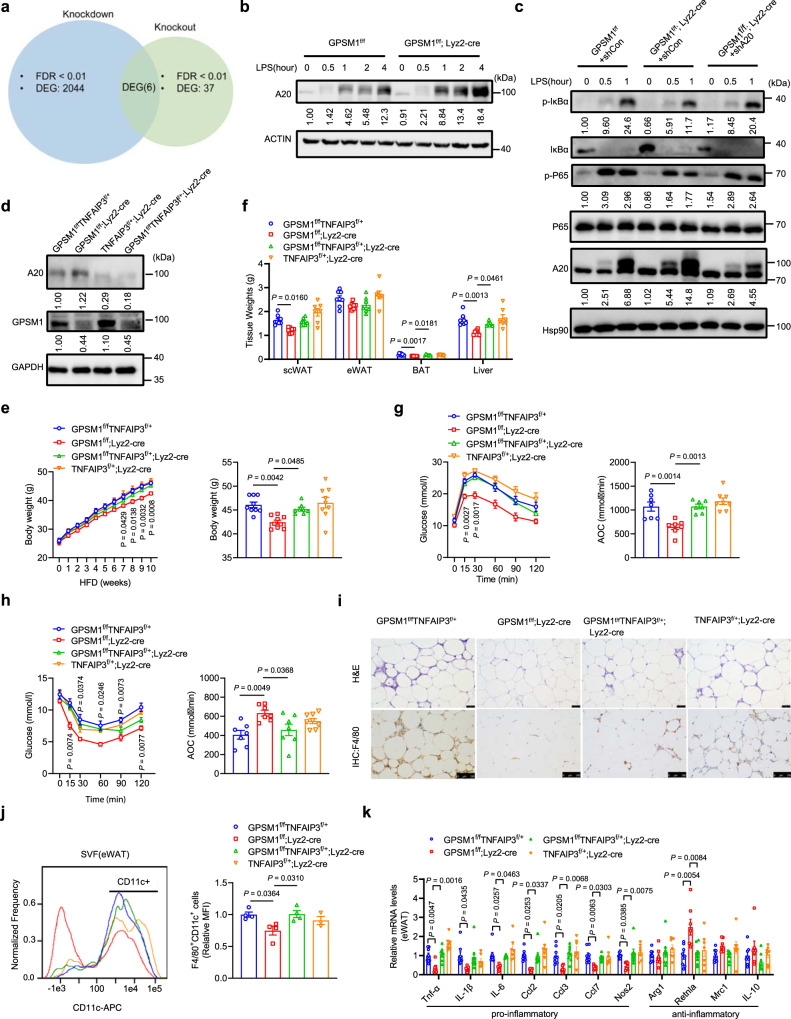
G-protein-signaling modulator 1 (GPSM1) exhibits strong genetic association with Type 2 diabetes (T2D) and Body Mass Index in population studies. However, how GPSM1 carries out such control and in which types of cells are poorly understood. Here, we demonstrate that myeloid GPSM1 promotes metabolic inflammation to accelerate T2D and obesity development. Mice with myeloid-specific GPSM1 ablation are protected against high fat diet-induced insulin resistance, glucose dysregulation, and liver steatosis via repression of adipose tissue pro-inflammatory states. Mechanistically, GPSM1 deficiency mainly promotes TNFAIP3 transcription via the Gαi3/cAMP/PKA/CREB axis, thus inhibiting TLR4-induced NF-κB signaling in macrophages. In addition, we identify a small-molecule compound, AN-465/42243987, which suppresses the pro-inflammatory phenotype by inhibiting GPSM1 function, which could make it a candidate for metabolic therapy. Furthermore, GPSM1 expression is upregulated in visceral fat of individuals with obesity and is correlated with clinical metabolic traits. Overall, our findings identify macrophage GPSM1 as a link between metabolic inflammation and systemic homeostasis.


Conflict of interest statement

The authors declare no competing interests.

Figures

Fig. 1
Fig. 1. GPSM1 expression is upregulated in ATMs from obese mice.
a RT-qPCR analysis of GPSM1 mRNA expression in epididymal WAT (eWAT) and subcutaneous WAT (scWAT) from lean (blue) or obese (red) mice. For DIO, WT male mice were fed normal chow diet (NCD) (n = 11 biologically independent sample) or high-fat diet (HFD) (n = 11 biologically independent sample) for 12 weeks. For genetic obesity, a group of WT (n = 10 biologically independent mice) and Ob/Ob (n = 10 biologically independent mice) and a separate group of WT (n = 9 biologically independent mice) and Db/Db (n = 9 biologically independent mice) were analyzed. Representative western blot analysis and quantification of GPSM1 expression in eWAT (b) and scWAT (c) from NCD and HFD mice (n = 6 biologically independent sample per group). d IHC staining and quantitative analysis of GPSM1 in eWAT and scWAT from NCD and HFD mice (n = 3 biologically independent sample per group). Scale bars, 100 μm. e RT-qPCR analysis of GPSM1 mRNA expression in stromal vascular fraction (SVF) and adipocyte fraction (MAF) isolated from eWAT from NCD (n = 5 biologically independent mice) or HFD (n = 6 biologically independent mice). f Representative western blot analysis and quantification of GPSM1 expression in SVFs isolated of eWAT (n = 4 biologically independent mice per group). g Immunofluorescence images of staining with antibodies against GPSM1 (red) and F4/80 (green) in eWAT of HFD-fed mice. Nuclei were stained with DAPI (blue). Scale bars, 100 μm. h Representative western blot analysis and quantification of GPSM1 expression in sorted F4/80+ macrophages isolated from eWAT SVFs (n = 4 biologically independent mice per group). Ponceau S was used as a loading control. Independent experiments were repeated three times with similar results (g). All data are presented as means ± SEM (af, h). P values are determined by two-tailed Student’s t-test (af, h).
Fig. 2
Fig. 2. Myeloid GPSM1 abrogation protects mice from diet-induced obesity and metabolic dysfunction.
Male GPSM1f/f; Lyz2-cre mice and age-matched GPSM1f/f littermates were fed a HFD for 12 weeks. HFD feeding started at 7 weeks of age. a Body weight (n = 12 biologically independent for GPSM1f/f and n = 10 biologically independent for GPSM1f/f; Lyz2-cre mice). b Percent of fat (left) and lean (right) body mass (n = 9 biologically independent mice per group). c fat-pad weights (n = 9 biologically independent mice per group). d Hematoxylin and eosin (H&E) staining of eWAT and scWAT sections. Scale bars, 100 μm. Independent experiments were repeated three times with similar results. e Serum concentration of adiponectin and leptin (n = 8 biologically independent mice per group). f Serum insulin levels (n = 8 biologically independent mice per group). g Fasting glucose levels (n = 8 biologically independent mice per group). h Glucose tolerance test and AOC (area over the curve), n = 9 biologically independent mice per group. i Insulin tolerance test and AOC (area over the curve), n = 10 biologically independent mice per group. j Immunoblots of AKT phosphorylation in murine eWAT, liver and muscle after insulin administration (1.5 U/kg) or PBS in vivo. k Representative images of H&E staining (top) and Oil Red O (bottom) staining of liver sections and quantification (n = 5 biologically independent mice per group). Scale bars, 100 μm. l Liver weight (n = 9 biologically independent mice per group). m Quantification of hepatic triglycerides (n = 8 biologically independent mice per group). n Serum levels of total cholesterol (TCH), non-esterified fatty acid (NEFA), ALT, and AST (n = 9 biologically independent mice per group). All data are shown as means ± SEM. P values are determined by two-way analysis of variance (ANOVA) with Sidak’s multiple-comparisons test (a, h, and i) or unpaired two-tailed Student’s t-test (b, c, e to i, and kn).
Fig. 3
Fig. 3. GPSM1 deficiency alleviates metabolic inflammation in HFD-fed mice.
ak Male GPSM1f/f; Lyz2-cre and age-matched GPSM1f/f mice were fed a HFD for 12 weeks. a Representative F4/80+ staining of eWAT sections. Scale bars, 100 μm. b Flow cytometry quantification of eWAT and scWAT F4/80+CD11b+ macrophages from GPSM1f/f and GPSM1f/f; Lyz2-cre mice (n = 6 biologically independent mice for GPSM1f/f and n = 5 biologically independent mice for GPSM1f/f; Lyz2-cre). c Flow cytometry quantification of TIM4 subset of total macrophages (n = 3 biologically independent mice per group). d Representative flow cytometry analysis and quantification of the expression of CD11c from CD45+F4/80+ cells in SVFs from eWAT and scWAT (n = 5 biologically independent mice for GPSM1f/f and n = 4 biologically independent mice for GPSM1f/f; Lyz2-cre). e Representative flow cytometry analysis and quantification of the expression of CD206 from CD45+F4/80+ cells in SVFs from eWAT and scWAT (n = 3 biologically independent mice per group). RT-qPCR analysis indicating mRNA abundance of pro-inflammatory and anti-inflammatory genes in eWAT (f, n = 10 biologically independent mice per group) and scWAT (g, n = 9 biologically independent mice per group). h Serum concentrations of TNF-α, IL-1β, IL-6, and CCL2 (n = 8 biologically independent mice per group). i Representative Masson’s trichrome staining of eWAT sections. Scale bars, 100 μm. RT-qPCR analysis indicating mRNA abundance of collagen synthesis genes in eWAT (j) and scWAT (k), n = 9 biologically independent mice per group. l, m Male GPSM1f/f; Lyz2-cre and age-matched GPSM1f/f mice were fed a HFD for 5 weeks. l Representative flow cytometry analysis and quantification of the expression of CD11c from CD45+F4/80+ cells in SVFs from eWAT (n = 5 biologically independent mice per group) and scWAT (n = 3 biologically independent mice per group). m RT-PCR analysis indicating mRNA abundance of pro-inflammatory and anti-inflammatory genes in eWAT (n = 7 biologically independent mice per group). The experiments were repeated five times with similar results (a, i). Throughout, data are presented as means ± SEM. P values are determined by unpaired two-tailed Student’s t-test (bh, j to m).
Fig. 4
Fig. 4. GPSM1 deficiency in macrophages increases energy expenditure.
a, b Oxygen consumption (VO2) monitored over a 24-h period and shown as averaged values in NCD-fed (a, n = 6 biologically independent mice for GPSM1f/f and n = 3 biologically independent mice for GPSM1f/f; Lyz2-cre) and HFD-fed (b, n = 7 biologically independent mice for GPSM1f/f and n = 5 biologically independent mice for GPSM1f/f; Lyz2-cre). c Representative images of H&E staining of BAT sections. Scale bars, 100 μm. d Immunoblots of UCP1 in BAT and quantification (right), n = 3 biologically independent mice per condition. Quantitative RT-PCR analysis of the mRNA abundance of the thermogenic markers in BAT of NCD-fed (e, n = 9 biologically independent mice per group) and HFD-fed conditions (f, n = 10 biologically independent mice per group). The experiments were repeated three times with similar results (c). Throughout, all data are presented as means ± SEM. P values are determined by two-way ANOVA with Sidak’s multiple-comparisons test (a, b) or unpaired two-tailed Student’s t-test (a, b, df).
Fig. 5
Fig. 5. GPSM1 deficiency inhibits TLR4-induced NF-κB inflammatory signaling of macrophages.
af Bone marrow-derived macrophages (BMDMs) from GPSM1f/f; Lyz2-cre mice and GPSM1f/f littermates were treated with 200 ng/ml LPS or vehicle control for indicated times. a Immunoblot analysis of GPSM1 protein in cell lysates of LPS-treated BMDMs. b BMDMs were stimulated with LPS for 24 h and levels of F4/80 and CD11c were assessed using flow cytometry. c Immunoblot analysis of p-IKKα/β, IKKβ, p-IκBα, IκBα, p-P65, and P65 in BMDMs treated with LPS for indicated times. d Immunoblot analysis of nuclear and cytoplasmic extracts and analyzed for P65. e LPS-primed BMDMs were treated with ATP or Nigericin. Immunoblotting was used to detect IL-1β, p17, casp-1, and p20 in supernatants (Sup), and pro-IL-1β and pro-casp-1 in cell extracts (lysates). f TNF-α, IL-6, and CCL2 levels in culture media were determined using ELISA (n = 3 or 4 independent samples per group). g GPSM1f/f BMDMs were infected with Lv-shCON or Lv-shGPSM1 for 72 h and treated with LPS for additional indicated times. Immunoblot analysis of p-IKKα/β, IKKβ, p-IκBα, IκBα, p-P65, and P65 is shown. h Immunoblot analysis of GPSM1, p-IKKα/β, IKKβ, p-IκBα, IκBα, p-P65, and P65 in THP-1 cells treated with LPS (500 ng/ml) for indicated times. i Immunoblot analysis of GPSM1, p-IKKα/β, IKKβ, p-IκBα, IκBα, p-P65, and P65 in BMDMs transfected with Ad-CON or Ad-GPSM1 for 48 h and treated with LPS for indicated times. j Representative immunofluorescence images of macrophage p-P65 staining with antibodies against p-P65 (red) and F4/80 (green) in eWAT. Nuclei were stained with DAPI (blue). Scale bars, 100 μm. Throughout, all independent experiments were performed three times with similar results (ae, gj). Data are presented as means ± SEM. P values are determined by two-way ANOVA with Sidak’s multiple-comparisons test (f).
Fig. 6
Fig. 6. GPSM1 loss inhibits the pro-inflammatory signaling pathway via TNFAIP3.
a Venn diagram showing overlap of differentially expressed genes from two RNA-sequencing datasets. b Immunoblot analysis of A20 in BMDMs isolated from GPSM1f/f; Lyz2-cre and littermates following 200 ng/ml LPS treatment for indicated times. c Immunoblot analysis of p-IκBα, IκBα, p-P65, P65, and A20 in GPSM1f/f and GPSM1f/f; Lyz2-cre BMDMs infected with indicated lentivirus for 72 h and treated with LPS for additional indicated times. dk Metabolic and inflammatory characterization of four genotypes mice fed a HFD for 10 weeks. d A20 and GPSM1 protein levels in BMDMs. e Body weight curve (left) and the body weight at 10-week HFD (right), n = 8 biologically independent mice for GPSM1f/fTNFAIP3f/+, Lyz2-cre; and n = 9 biologically independent mice for other three genotypes, respectively. f Tissue weights, including scWAT, eWAT, BAT, and Liver; n = 8 biologically independent mice for GPSM1f/fTNFAIP3;f/+ n = 7 biologically independent mice for other three genotypes, respectively. g GTT and AOC; n = 8 biologically independent mice for TNFAIP3f/+, Lyz2-cre; and n = 7 biologically independent mice for other three genotypes, respectively. h ITT and AOC; n = 8 biologically independent mice for TNFAIP3f/+, Lyz2-cre; n = 7 biologically independent mice for other three genotypes, respectively. i H&E (Scale bars, 50 μm) and F4/80+ IHC (Scale bars, 100 μm) staining of eWAT. j Representative flow cytometry analysis and quantification of the expression of CD11c from CD45+F4/80+ cells in SVFs from eWAT (n = 4 biologically independent mice per group). k RT-PCR analysis indicating mRNA abundance of pro-inflammatory and anti-inflammatory genes in eWAT, n = 8 biologically independent mice for GPSM1f/fTNFAIP3f/+ and GPSM1f/fTNFAIP3f/+, Lyz2-cre; n = 7 biologically independent mice for GPSM1f/f; Lyz2-cre and TNFAIP3f/+, Lyz2-cre. Throughout, all independent experiments were performed three times with similar results (bd, i). Data are presented as means ± SEM. P values are determined by two-way ANOVA with Sidak’s multiple-comparisons test (e, g, and h) or one-way ANOVA with Tukey’s multiple-comparisons test (eh, j, k). For e, g, and h, P values are compared with GPSM1f/fTNFAIP3f/+ group.
Fig. 7
Fig. 7. GPSM1 deficiency-induced TNFAIP3 upregulation is via the Gαi3/cAMP/PKA/CREB axis.
BMDMs from GPSM1f/f; Lyz2-cre and GPSM1f/f mice were treated with 200 ng/ml LPS or vehicle control for indicated times. a cAMP levels in BMDMs treated with LPS (n = 4 independent samples per group). b GPSM1f/f and GPSM1f/f; Lyz2-cre BMDMs were pre-treated with H-89 (50 μM) or vehicle for 30 min and then stimulated with LPS for additional indicated times. Immunoblots for p-PKA substrate, p-CREB, CREB and A20 in BMDMs. c ChIP-qPCR of A20 in BMDMs with or without LPS stimulation (n = 3 independent samples per condition). β-globin was as a control. d Luciferase activity of a WT TNFAIP3 promoter reporter (TNFAIP3-Luc) or of a mutant-TNFAIP3 reporter (TNFAIP3-Mut-Luc) containing a deletion in the CREB-responsive element in HEK293T cells transiently expressing either vector (pRL-TK) or CREB (n = 3 independent samples per condition). e IP of flag from BMDMs transfected with Ad-flag-GPSM1 or Ad-Con, followed by immunoblot analysis of the interaction of GPSM1 with Gαi3 under LPS stimulation or not. f Immunoblot analysis of p-P65, P65, GPSM1, and Gαi3 in BMDMs infected with Ad-GPSM1 or Ad-GFP, and Ad-shGαi3 or Ad-shNC for 72 h and treated with LPS for indicated times. Independent experiments were performed three times with similar results (b, e, and f). All data are presented as means ± SEM. P values are determined by two-way ANOVA with Sidak’s multiple-comparisons test (a), or two-tailed Student’s t-test (c, d).
Fig. 8
Fig. 8. Macrophage GPSM1-driven inflammatory signal regulates co-cultured primary adipocytes insulin action and sensitivity.
a Primary adipocytes were treated with conditioned media (CM) from LPS-primed GPSM1f/f or GPSM1f/f; Lyz2-Cre BMDMs, vehicle-treated BMDMs, and control adipocyte medium (fresh media), for 48 h. Protein expression levels of insulin signaling cascades, p-IRS1, p-AKT, and AKT after insulin (100 nM) or vehicle stimulation for 15 min were assessed using immunoblotting. b Primary adipocytes were treated with conditioned media (CM) from LPS-primed GPSM1- or Con-overexpressing BMDMs, vehicle-treated BMDMs, and control adipocyte medium (fresh media), for 48 h. Protein expression levels of insulin signaling cascades, p-IRS1, p-AKT, and AKT after insulin (100 nM) or vehicle stimulation for 15 min were assessed using immunoblotting. c Adiponectin levels in culture media were determined using ELISA (n = 3 independent samples per condition). Independent experiments were performed three times with similar results (a, b). All data are presented as means ± SEM. P values are determined by one-way ANOVA with Tukey’s multiple-comparisons test (c).
Fig. 9
Fig. 9. Identification of potential GPSM1 inhibitors.
a SPR assay with Biacore diagram and saturation curve of AN-465/42243987 binding to GPSM1 protein. As AN-465/42243987 concentration increases, the chip RU continues to increases. bf BMDMs treated with 50 μM AN-465/42243987 or vehicle control for 16 h and then stimulated with LPS or not. b Representative immunofluorescence images indicating P65 nuclei translocation showed by high-content screen. BMDMs were stained for P65 (red) and DAPI (blue). Scale bars, 100 μm. c Quantification of the proportion of P65 nuclear translocation exhibited in (b) (n = 3 independent samples per condition). d The mRNA abundance of A20 in BMDMs after LPS stimulation for 20 min (n = 4 independent samples per condition). e The mRNA abundance of pro-inflammatory markers in BMDMs stimulated with LPS for 3 h (n = 3 independent samples per condition). f The effect of AN-465/42243987 on P65 translocation in GPSM1f/f and GPSM1f/f; Lyz2-cre BMDMs (n = 3 or 4 independent samples per condition). Positive% was defined as the index (P65 intensity in nuclei/cytoplasm) > 1.5. gn In vivo effects of AN-465/42243987. DIO mice (already HFD-fed for 8 weeks) were peritoneally administered with either 0.5 mg/kg AN-465/42243987 or vehicle, twice per week for 4 weeks. g Body weights (n = 10 biologically independent mice per group). h Tissue weights (n = 10 biologically independent mice per group). i GTT and AOC (n = 7 biologically independent mice per group). j ITT and AOC (n = 7 biologically independent mice per group). k Oil Red O staining. Scale bars, 100 μm. l H&E and F4/80+ IHC staining of eWAT. Scale bars, 100 μm. m Representative flow cytometry analysis and quantification of the expression of CD11c from CD45+F4/80+ cells in SVFs from eWAT (n = 4 biologically independent mice per group) and scWAT (n = 3 biologically independent mice per group). n RT-PCR analysis indicating mRNA abundance in eWAT (n = 9 biologically independent mice per group). Independent experiments were performed three times with similar results (b, k, l). All data are presented as means ± SEM. P values are determined by unpaired two-tailed Student’s t-test (d, e, h to j, m, and n), or the two-way ANOVA with Sidak’s multiple-comparisons test (g, i, and j) or one-way ANOVA with Tukey’s multiple-comparisons test (c).
Fig. 10
Fig. 10. Human adipose tissue GPSM1 is correlated with obesity and metabolic quantitative traits.
a IHC staining of GPSM1 in visceral fat from individuals without/with overweight or obesity (n = 5 biologically independent individuals per group). Scale bars, 100 μm (top) and 50 μm (bottom). Quantification is shown (right). b qPCR analysis indicating expression of GPSM1 in visceral fat from individuals without/with overweight or obesity (BMI < 24, n = 36 biologically independent individuals; BMI ≥ 24, n = 61 biologically independent individuals). GPSM1 mRNA level was normalized to RPLP0 mRNA. c Correlation between GPSM1 mRNA expression in visceral fat with clinical metabolic traits, including BMI (n = 97 biologically independent individuals), Fasting Plasma Glucose (FPG, n = 54 biologically independent individuals), HbA1c (n = 26 biologically independent individuals), Total cholesterol (n = 64 biologically independent individuals), LDL-c (n = 64 biologically independent individuals), ALT (n = 92 biologically independent individuals), and AST (n = 92 biologically independent individuals) from human subjects. d Model of how macrophage GPSM1 controls TLR-induced NF-κB signaling and pro-inflammatory cytokine secretion and thus influence adipocyte insulin sensitivity and function. Mice with myeloid-specific GPSM1 ablation displayed ameliorated adipose inflammation, liver steatosis, and improved systemic glucose tolerance, insulin sensitivity, and energy expenditure upon HFD challenge. Mechanically, upon LPS stimulation, macrophage GPSM1 loss could upregulate TNFAIP3 transcription via the Gαi3/cAMP/PKA/CREB axis, thereby inhibiting NF-κB signaling. One small-molecule compound, AN-465, targeting GPSM1, would be a candidate for metabolic therapy. Data are presented as means ± SEM (a), or boxplots represent the median value, with lower and upper hinges corresponding to the 25th and 75th percentiles, and lower and upper whiskers extending from the hinge to the smallest and largest value (b). P values are determined by unpaired two-tailed Student’s t-test (a, b), Pearson’s correlation analysis showing R values, and two-tailed P values (c).

References

    1. De Vries L, et al. Activator of G protein signaling 3 is a guanine dissociation inhibitor for Galpha i subunits. Proc. Natl. Acad. Sci. USA. 2000;97:14364–14369. doi: 10.1073/pnas.97.26.14364. - DOI - PMC - PubMed
    1. Pattingre S, et al. The G-protein regulator AGS3 controls an early event during macroautophagy in human intestinal HT-29 cells. J. Biol. Chem. 2003;278:20995–21002. doi: 10.1074/jbc.M300917200. - DOI - PubMed
    1. Pizzinat N, Takesono A, Lanier SM. Identification of a truncated form of the G-protein regulator AGS3 in heart that lacks the tetratricopeptide repeat domains. J. Biol. Chem. 2001;276:16601–16610. doi: 10.1074/jbc.M007573200. - DOI - PubMed
    1. Flannick J, et al. Exome sequencing of 20,791 cases of type 2 diabetes and 24,440 controls. Nature. 2019;570:71–76. doi: 10.1038/s41586-019-1231-2. - DOI - PMC - PubMed
    1. Spracklen CN, et al. Identification of type 2 diabetes loci in 433,540 East Asian individuals. Nature. 2020;582:240–245. doi: 10.1038/s41586-020-2263-3. - DOI - PMC - PubMed

Publication types

Substances