. 2022 Nov 24;5(1):1288.
doi: 10.1038/s42003-022-04246-3.

Vitamin D status modulates mitochondrial oxidative capacities in skeletal muscle: role in sarcopenia

Affiliations

Vitamin D status modulates mitochondrial oxidative capacities in skeletal muscle: role in sarcopenia

Jérôme Salles et al. Commun Biol. .

Abstract

Skeletal muscle mitochondrial function is the biggest component of whole-body energy output. Mitochondrial energy production during exercise is impaired in vitamin D-deficient subjects. In cultured myotubes, loss of vitamin D receptor (VDR) function decreases mitochondrial respiration rate and ATP production from oxidative phosphorylation. We aimed to examine the effects of vitamin D deficiency and supplementation on whole-body energy expenditure and muscle mitochondrial function in old rats, old mice, and human subjects. To gain further insight into the mechanisms involved, we used C2C12 and human muscle cells and transgenic mice with muscle-specific VDR tamoxifen-inducible deficiency. We observed that in vivo and in vitro vitamin D fluctuations changed mitochondrial biogenesis and oxidative activity in skeletal muscle. Vitamin D supplementation initiated in older people improved muscle mass and strength. We hypothesize that vitamin D supplementation is likely to help prevent not only sarcopenia but also sarcopenic obesity in vitamin D-deficient subjects.


Conflict of interest statement

The authors declare the following competing interests: this study was partly supported by a grant from Danone Nutricia Research, Utrecht, The Netherlands, and, M.J., Y.L., M.F., and M.V.D. are employees of Danone Nutricia Research, Utrecht, The Netherlands.

Figures
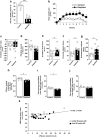
Fig. 1
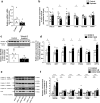
Fig. 1. Vitamin D deficiency increases body weight and fat mass and influences whole-body energy expenditure.
a Plasma 25(OH)D concentrations in vitamin D-depleted old rats (n = 9) and in control old rats (n = 7) at the end of the 9-month vitamin D depletion period. b Time-course of body weight in vitamin D-depleted old rats (n = 9) and control old rats (n = 7) during the 9-month vitamin D depletion period. Mean changes in lean body mass (c) and fat body mass (e) from baseline to 9 months of vitamin D depletion in vitamin D-depleted old rats (n = 9) and in control old rats (n = 7). Weights of plantaris muscle (d), perirenal adipose tissue (f), and subcutaneous adipose tissue (g) in vitamin D-depleted old rats (n = 9) and control old rats (n = 7) at the end of the 9-month vitamin D depletion period. 24-h energy expenditure (h), energy expenditure during the light period (i), and energy expenditure during the dark period (j) adjusted to lean body mass in vitamin D-depleted old rats (n = 5) and control old rats (n = 5). k Correlations between resting energy expenditure (REE) adjusted to lean body mass and plasma 25(OH)D concentrations in 31 male subjects including 15 young (from 20 to 35 years old) and 16 older individuals (over 60 years old) (r = Pearson’s correlation coefficient). Data are expressed as means ± SEM. Differences between groups were analyzed with an unpaired t-test. *statistically different from control rats at p < 0.05. **statistically different from control rats at p < 0.01. ***statistically different from control rats at p < 0.001.
Fig. 2
Fig. 2. Vitamin D status modulates muscle mitochondrial function.
a Mitochondrial respiration in permeabilized fibers of plantaris muscles from vitamin D-depleted old rats (n = 5) and control old rats (n = 5). Respiration was expressed in natom O/min/mg of fibers and was measured at state 3 with: pyruvate (10 mM)/malate (10 mM), succinate (25 mM) in presence of rotenone (0.4 µg/ml), or ascorbate (3 mM)/N,N,N′,N′-tetramethyl-p-phenylenediamine (TMPD) (0.5 mM). b Mitochondrial enzyme activities in plantaris muscle from vitamin D-depleted old rats (n = 5) and control old rats (n = 5), c in C2C12 myotubes treated with 0, 1, and 10 nM of 1,25(OH)2 vitamin D3, and d citrate synthase activity in human primary myotubes treated with 0 and 10 nM of 1,25(OH)2 vitamin D3 were expressed as fold change vs. control-group value. Cell culture data are combined from at least two independent experiments (n = 3–5). Data are expressed as means ± SEM. Differences between groups were analyzed with an unpaired t-test. *statistically different from the control group at p < 0.05. **statistically different from the control group at p < 0.01. ***statistically different from the control group at p < 0.001.
Fig. 3
Fig. 3. Vitamin D influences mitochondrial protein content and gene expression patterns in skeletal muscles, C2C12 and human primary myotubes.
a mtDNA/nDNA ratio as a marker of mitochondria content in plantaris muscles from vitamin D-depleted old rats (n = 8) and control old rats (n = 7). b Transcript levels of genes involved in mitochondrial biogenesis and function, and c protein content of NDUFB8, a respiratory chain complex I subunit, in gastrocnemius muscle from vitamin D-depleted old mice (n = 9) and control old mice (n = 8–10) (Mouse experiment 1). mRNA levels were normalized to the housekeeping gene CypA. d Transcript levels of genes involved in mitochondrial biogenesis and function in human primary myotubes treated with 0 and 10 nM of 1,25(OH)2 vitamin D3. mRNA levels were normalized to the housekeeping gene RPLP0. Representative immunoblots and red Ponceau staining (e), and immunoblot quantifications (f) of several subunits of each mitochondrial complex and Porin protein in C2C12 myotubes treated with 0 and 10 nM of 1,25(OH)2 vitamin D3. Cell culture data are combined from at least two independent experiments (n = 4–6). Data are expressed as means ± SEM and as fold change vs. control-group value. Differences between groups were analyzed with an unpaired t-test for rat and cell studies and with the Mann–Whitney U-test for mouse experiment 1. *statistically different from control animals or cells at p < 0.05. **statistically different from control animals or cells at p < 0.01, ***statistically different from control animals or cells at p < 0.001.
Fig. 4
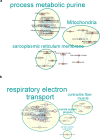
Fig. 4. Vitamin D regulates expression levels of genes involved in mitochondrial function in old rat muscles and C2C12 cells in a coordinated way.
DAVID was used for Gene Ontology (GO) enrichment analysis of significant differentially expressed genes (DEGs) in plantaris muscles of old rats (p < 0.05) and in C2C12 myotubes (B–H adjusted p-values < 0.05) according to vitamin D status. The top ten significant enriched GO terms of the DEGs downregulated in response to vitamin D deficiency in rat plantaris muscle (a) and the top ten significant enriched GO terms of the DEGs upregulated in response to vitamin D supplementation in C2C12 myotubes (b) are presented. Using the Cytoscape applications, EnrichmentMap and AutoAnnotate, related functional annotations (annotations of these functions are all in capitalized letters) were clusterised and an annotation of these clusters (lower case annotations) was added. The size of the cluster’s annotation font relies on the size of the cluster generated (the higher the number of nodes is the bigger the font is).
Fig. 5
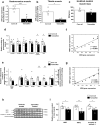
Fig. 5. Tamoxifen administration decreases muscle VDR gene expression resulting in a reduction of muscle mitochondrial biogenesis and function in HSA-MCM-VDRfl/fl transgenic mice.
Vitamin D receptor (VDR) transcript expression levels in a gastrocnemius and b tibialis muscles of tamoxifen-treated HSA-MCM-VDRfl/fl mice (n = 4–5) and corn oil vehicle-treated HSA-MCM-VDRfl/fl mice (n = 3–5) (Mouse experiment 2). mRNA levels were normalized to HPRT. Data are expressed as means ± SEM and as fold change vs. corn oil-treated group value. c Hindlimb skeletal muscle mass of tamoxifen-treated HSA-MCM-VDRfl/fl mice (n = 5) and corn oil vehicle-treated HSA-MCM-VDRfl/fl mice (n = 5) (Mouse experiment 2). d Mitochondrial enzyme activities, e mtDNA/nDNA ratio as marker of mitochondria content and transcript levels of genes involved in mitochondrial biogenesis and function in gastrocnemius muscle of tamoxifen-treated HSA-MCM-VDRfl/fl mice (n = 5) and corn oil vehicle-treated HSA-MCM-VDRfl/fl mice (n = 5) (Mouse experiment 2). Correlations between f NRF1 and VDR gene expressions, and g NRF2 and VDR gene expressions in tamoxifen-treated and corn oil-treated HSA-MCM-VDRfl/fl mice (Mouse experiment 2) (r = Pearson’s correlation coefficient). Immunoblots and red Ponceau staining (h), and immunoblot quantifications (i) of NRF1, NRF2, and complex IV subunit 4 proteins in gastrocnemius muscle of tamoxifen-treated HSA-MCM-VDRfl/fl mice (n = 5) and corn oil vehicle-treated HSA-MCM-VDRfl/fl mice (n = 5) (Mouse experiment 2). Data are expressed as means ± SEM. Differences between mouse groups were analyzed with an unpaired t-test. *statistically different from corn oil-treated mice at p < 0.05. **statistically different from corn oil-treated mice at p < 0.01. ***statistically different from corn oil-treated mice at p < 0.001.
Fig. 6
Fig. 6. Vitamin D status modulates muscle mass and function in old mice and in vitamin D-deficient older subjects.
a Hindlimb mass and b forearm grip strength were measured in 24-month-old mice that received a vitamin D-depleted diet for 14 months (depleted; n = 9) and in 24-month-old mice that received a vitamin D-adequate diet for 14 months (control; n = 10) (Mouse experiment 1). Data are expressed as means ± SEM. Vitamin D-deficient older subjects (n = 115) received a supplement of 10,000 IU cholecalciferol three times per week for 6 months (33 men and 27 women) or a placebo (26 men and 29 women). Plasma 25(OH)D concentration, appendicular skeletal muscle mass and handgrip strength were measured at baseline and at 6 months. Changes in c plasma 25(OH)D concentration, d appendicular skeletal muscle mass, and e handgrip strength during the experimental period are presented. f Correlations between appendicular skeletal muscle mass gain and plasma 25(OH)D concentration increase (human trial) (r = Pearson’s correlation coefficient). Data are expressed as means ± SEM. Mouse experiment 1: Differences between groups were analyzed using the Mann–Whitney U test. *statistically different from control mice at p < 0.05. Human trial: Differences between groups were analyzed using an unpaired t-test. *statistically different from placebo-treated subjects at p < 0.05. ***statistically different from placebo-treated subjects at p < 0.001.

References

    1. Cashman KD. Vitamin D deficiency: defining, prevalence, causes, and strategies of addressing. Calcif. Tissue Int. 2020;106:14–29. doi: 10.1007/s00223-019-00559-4. - DOI - PubMed
    1. Domingues-Faria C, Boirie Y, Walrand S. Vitamin D and muscle trophicity. Curr. Opin. Clin. Nutr. Metab. Care. 2017;20:169–174. doi: 10.1097/MCO.0000000000000358. - DOI - PubMed
    1. Bischoff-Ferrari HA, et al. Vitamin D receptor expression in human muscle tissue decreases with age. J. Bone Miner. Res. 2004;19:265–269. doi: 10.1359/jbmr.2004.19.2.265. - DOI - PubMed
    1. Migliaccio S, et al. Obesity and hypovitaminosis D: causality or casualty? Int. J. Obes. Suppl. 2019;9:20–31. doi: 10.1038/s41367-019-0010-8. - DOI - PMC - PubMed
    1. Kim J, et al. Association of serum vitamin D with osteosarcopenic obesity: Korea National Health and Nutrition Examination Survey 2008-2010. J. Cachexia Sarcopenia Muscle. 2017;8:259–266. doi: 10.1002/jcsm.12154. - DOI - PMC - PubMed