

The rapid and efficient strategy for SARS-CoV-2 Omicron transmission control: analysis of outbreaks at the city level
- PMID: 36434701
- PMCID: PMC9694873
- DOI: 10.1186/s40249-022-01043-2
The rapid and efficient strategy for SARS-CoV-2 Omicron transmission control: analysis of outbreaks at the city level
Abstract
Background: Severe acute respiratory syndrome coronavirus 2 (SARS-CoV-2) Omicron (B.1.1.529) variant is highly transmissible with potential immune escape. Hence, control measures are continuously being optimized to guard against large-scale coronavirus disease 2019 (COVID-19) outbreaks. This study aimed to explore the relationship between the intensity of control measures in response to different SARS-CoV-2 variants and the degree of outbreak control at city level.
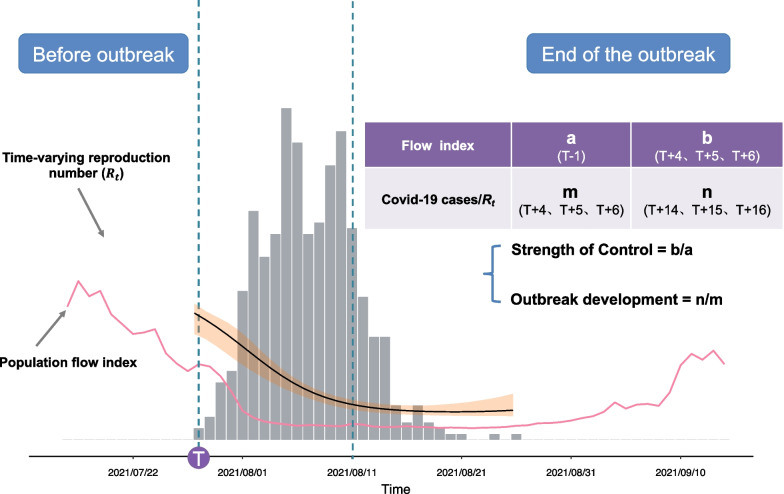
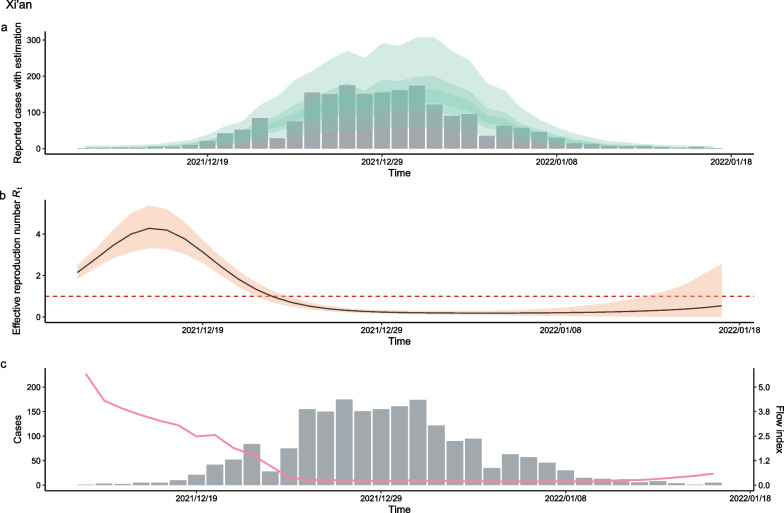
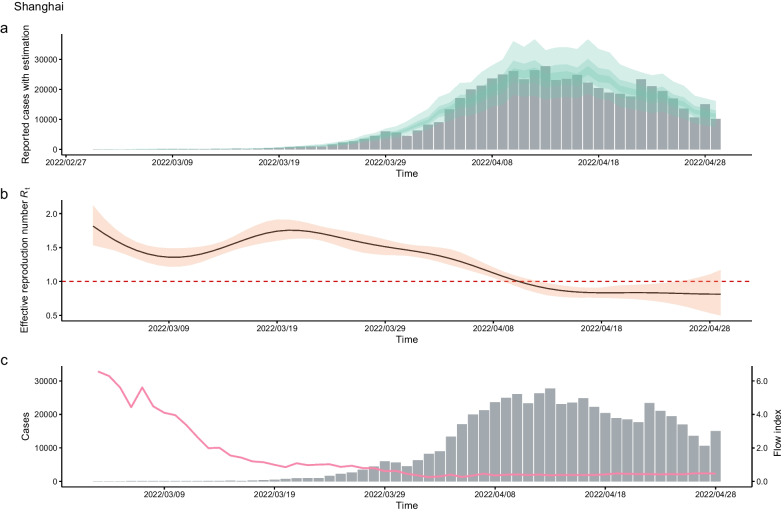
Methods: A retrospective study was conducted in 49 cities with COVID-19 outbreaks between January 2020 and June 2022. Epidemiological data on COVID-19 were extracted from the National Health Commission, People's Republic of China, and the population flow data were sourced from the Baidu migration data provided by the Baidu platform. Outbreak control was quantified by calculating the degree of infection growth and the time-varying reproduction number ([Formula: see text]). The intensity of the outbreak response was quantified by calculating the reduction in population mobility during the outbreak period. Correlation and regression analyses of the intensity of the control measures and the degree of outbreak control for the Omicron variant and non-Omicron mutants were conducted, respectively.
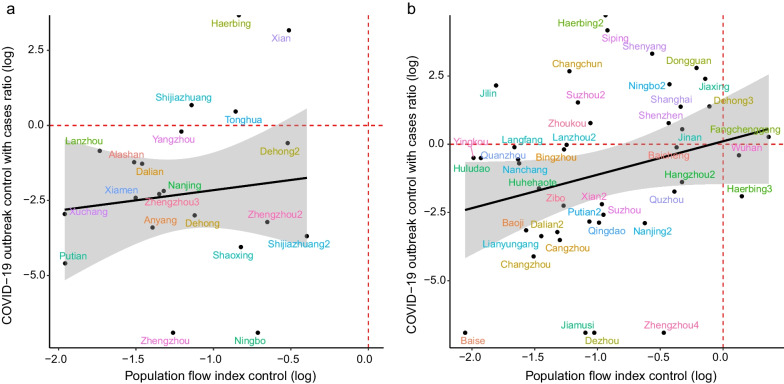
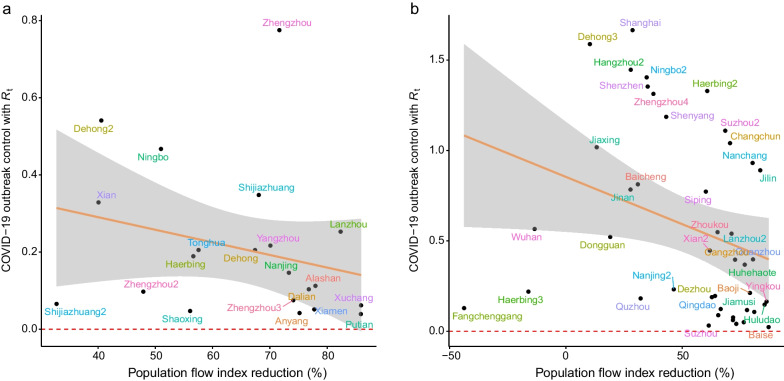
Results: Overall, 65 outbreaks occurred in 49 cities in China from January 2020 to June 2022. Of them, 66.2% were Omicron outbreaks and 33.8% were non-Omicron outbreaks. The intensity of the control measures was positively correlated with the degree of outbreak control (r = 0.351, P = 0.03). The degree of reduction in population mobility was negatively correlated with the Rt value (r = - 0.612, P < 0.01). Therefore, under the same control measure intensity, the number of new daily Omicron infections was 6.04 times higher than those attributed to non-Omicron variants, and the Rt value of Omicron outbreaks was 2.6 times higher than that of non-Omicron variants. In addition, the duration of non-Omicron variant outbreaks was shorter than that of the outbreaks caused by the Omicron variant (23.0 ± 10.7, 32.9 ± 16.3, t = 2.243, P = 0.031).
Conclusions: Greater intensity of control measures was associated with more effective outbreak control. Thus, in response to the Omicron variant, the management to restrict population movement should be used to control its spread quickly, especially in the case of community transmission occurs widely. Faster than is needed for non-Omicron variants, and decisive control measures should be imposed and dynamically adjusted in accordance with the evolving epidemic situation.
Keywords: COVID-19; Outbreak; Population flow; SARS-CoV-2; Time-varying reproduction number.
© 2022. The Author(s).
Conflict of interest statement
The authors declare no competing interests.
Figures
References
MeSH terms
Supplementary concepts
Grants and funding
- XGYJKY2022-09/Scientific research project on prevention and treatment of COVID-19 with traditional Chinese medicine in 2022
- SHDC2022CRS039/Three-year Action Plan for Promoting Clinical Skills and Innovation Ability of Municipal Hospitals
- 21Y11922500/Medical Innovation Research Special Project of the Shanghai "Science and Technology Innovation Action Plan"
- 21Y11922400/Medical Innovation Research Special Project of the Shanghai "Science and Technology Innovation Action Plan
- 2022ZYLCYJ05-10/The emergency study of traditional Chinese medicine on COVID-19 in 2022
LinkOut - more resources
Full Text Sources
Medical
Miscellaneous
