. 2022 Nov 25;17(1):76.
doi: 10.1186/s13024-022-00580-6.

Upregulation of Ca2+-binding proteins contributes to VTA dopamine neuron survival in the early phases of Alzheimer's disease in Tg2576 mice

Affiliations

Upregulation of Ca2+-binding proteins contributes to VTA dopamine neuron survival in the early phases of Alzheimer's disease in Tg2576 mice

Livia La Barbera et al. Mol Neurodegener. .

Abstract

Background: Recent clinical and experimental studies have highlighted the involvement of Ventral Tegmental Area (VTA) dopamine (DA) neurons for the early pathogenesis of Alzheimer's Disease (AD). We have previously described a progressive and selective degeneration of these neurons in the Tg2576 mouse model of AD, long before amyloid-beta plaque formation. The degenerative process in DA neurons is associated with an autophagy flux impairment, whose rescue can prevent neuronal loss. Impairments in autophagy can be the basis for accumulation of damaged mitochondria, leading to disturbance in calcium (Ca2+) homeostasis, and to functional and structural deterioration of DA neurons.

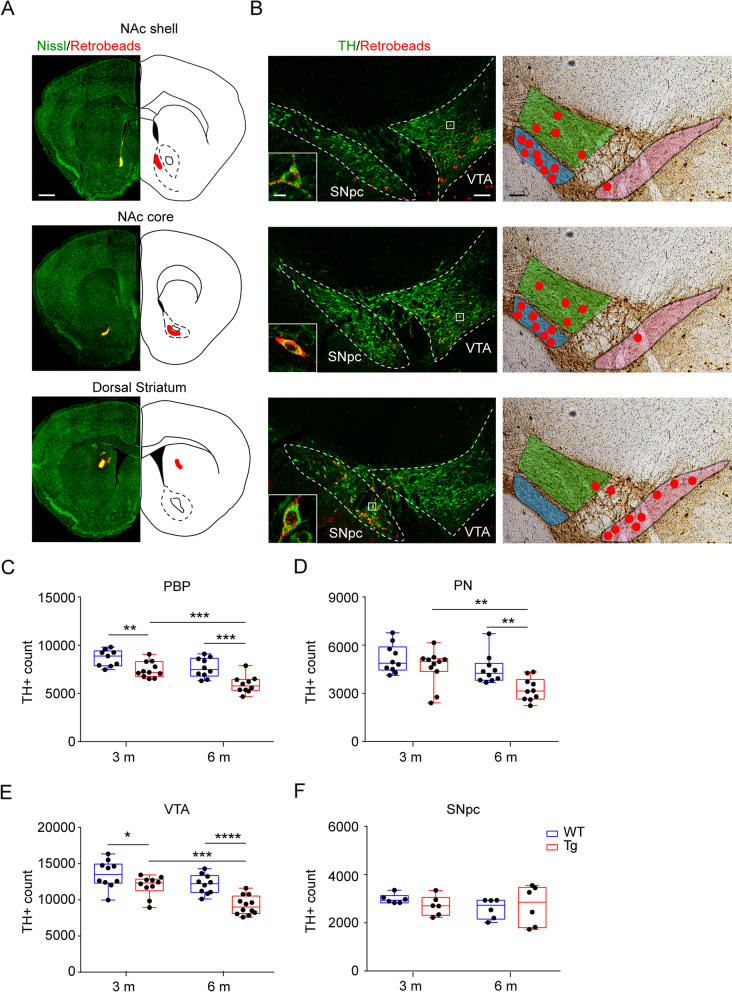
Methods: In Tg2576 mice, we performed amperometric recordings of DA levels and analysis of dopaminergic fibers in the Nucleus Accumbens - a major component of the ventral striatum precociously affected in AD patients - together with retrograde tracing, to identify the most vulnerable DA neuron subpopulations in the VTA. Then, we focused on these neurons to analyze mitochondrial integrity and Apoptosis-inducing factor (AIF) localization by electron and confocal microscopy, respectively. Stereological cell count was also used to evaluate degeneration of DA neuron subpopulations containing the Ca2+-binding proteins Calbindin-D28K and Calretinin. The expression levels for these proteins were analyzed by western blot and confocal microscopy. Lastly, using electrophysiology and microfluorometry we analyzed VTA DA neuron intrinsic properties and cytosolic free Ca2+ levels.

Results: We found a progressive degeneration of mesolimbic DA neurons projecting to the ventral striatum, located in the paranigral nucleus and parabrachial pigmented subnucleus of the VTA. At the onset of degeneration (3 months of age), the vulnerable DA neurons in the Tg2576 accumulate damaged mitochondria, while AIF translocates from the mitochondria to the nucleus. Although we describe an age-dependent loss of the DA neurons expressing Calbindin-D28K or Calretinin, we observed that the remaining cells upregulate the levels of Ca2+-binding proteins, and the free cytosolic levels of Ca2+ in these neurons are significantly decreased. Coherently, TUNEL-stained Tg2576 DA neurons express lower levels of Calbindin-D28K when compared with non-apoptotic cells.

Conclusion: Overall, our results suggest that the overexpression of Ca2+-binding proteins in VTA DA neurons might be an attempt of cells to survive by increasing their ability to buffer free Ca2+. Exploring strategies to overexpress Ca2+-binding proteins could be fundamental to reduce neuronal suffering and improve cognitive and non-cognitive functions in AD.

Keywords: Apoptosis inducing factor; Autophagy; Calbindin; Calcium; Calretinin; Cell death; Midbrain; Mitophagy; Neurodegeneration; Oxidative stress.


Conflict of interest statement

The authors declare that they have no known competing financial interests or personal relationships that could have appeared to influence the work reported in this paper.

Figures

Fig. 1
Fig. 1
Reduced dopamine and dopaminergic innervation in Tg2576 NAc core and shell since 4 months of age. A Example, representative traces (scale: 100 pA; 200 ms) and evoked DA concentration in NAc shell, NAc core and striatum (WT: n = 28–39 observations from 10 to 13 slices, 4 mice; Tg2576: n = 27–39 observations from 10 to 13 slices, 4 mice) in 4-month-old WT and Tg2576 mice recorded with a carbon fiber electrode of equal calibration (NAc shell; Unpaired t- test with Welch’s correction, ***p = 0.0001; NAc core: Unpaired t-test, **p = 0.0015). The schematic on the left shows the placement of the stimulating (black arrowheads) and carbon fiber electrodes (white arrowheads) used for the recordings in the three brain regions. B Representative immunofluorescent labelling (scale bar, 200 μm) for TH in 4-month-old WT and Tg2576 mice and graphs showing densitometric values of TH levels. Left panels: NAc coronal sections showing the NAc shell (asterisk; n = 5 per genotype. Unpaired t-test: ***p = 0.0003) and NAc core (arrowhead; n = 5 per genotype. Unpaired t-test: *p = 0.0245). Right panels: dorsal striatum (scale bar, 50 μm. n = 5 per genotype). C As in B, but showing immunofluorescent labelling (scale bar, 200 μm) for DAT in NAc shell (asterisk; n = 5 per genotype. Unpaired t-test: **p = 0.0017), NAc core (arrowhead; n = 5 per genotype. Unpaired t-test: *p = 0.0123) and dorsal striatum (scale bar, 50 μm. n = 5 per genotype). In this and all other Figures, in box-and-whisker plots the center line shows the median value, edges are upper and lower quartiles, whiskers show minimum and maximum values, and each point is an individual experiment
Fig. 2
Fig. 2
Selective degeneration of Tg2576 DA neurons projecting to NAc core and shell since 3 months of age. A Retrograde tracing of midbrain neurons projecting to ventral and dorsal striatum 3 weeks from the injection. Left panels: injection sites of red fluorescent beads (Retrobeads) in coronal sections of NAc shell, NAc core and dorsal striatum (green-Nissl counterstained; scale: 500 μm). Right panels: Schematic representation of the corresponding midbrain regions, with injected areas marked. B Anatomical position of retrogradely labeled TH+ neurons in the midbrain. Left panels: confocal images of retrogradely labeled DA neurons from coronal midbrain sections containing VTA and SNpc (red + green; scale: 100 μm), and inset showing TH+ cells (green) in the VTA PBP (upper panel), VTA PN (middle panel), and SNpc (bottom panel) labeled with red beads from NAc shell, core and dorsal striatum, respectively (scale: 2 μm). Right panels: schematic images of coronal midbrain sections containing VTA and SNpc (scale: 100 μm). The two VTA subnuclei and SNpc are differently colored (paranigral (PN): blue; parabrachial (PBP): green; SNpc: pink). Red dots represent the position of individual retrobeads-TH+ neurons in VTA and SNpc accumulated from three different experiments. C-D Stereological quantification of TH+ cell numbers in (C) PBP and (D) PN from 3- and 6-month-old WT and Tg2576 mice. C PBP (3 months: WT: n = 9; Tg2576: n = 11; 6 months: WT: n = 10; Tg2576: n = 10 mice. Two-way ANOVA for Genotype vs Age: Interaction: F1,36 = 0.81, p = 0.3760; Genotype: F1,36 = 26,64, p < 0.0001; Age: F1,36 = 19.85, p < 0.0001. WT 3 m vs Tg2576 3 m: Unpaired t-test **p = 0.0047; WT 6 m vs Tg2576 6 m: Unpaired t-test ***p = 0.0007; Tg2576 3 m vs Tg2576 6 m: Unpaired t-test ***p = 0.0007). D PN (3 months: WT: n = 10; Tg2576: n = 11; 6 months: WT: n = 10; Tg2576: n = 10 mice. Two-way ANOVA for Genotype vs Age: Interaction: F1,37 = 1.437, p = 0.2382; Genotype: F1,37 = 9.63, p = 0.0037; Age: F1,37 = 12.53, p = 0.0011. WT 6 m vs Tg2576 6 m: Mann-Whitney test **p = 0.0021; Tg2576 3 m vs Tg2576 6 m: Mann-Whitney test **p = 0.0048). E-F Stereological quantification of TH+ cell numbers in (E) VTA and (F) SNpc from 3- and 6-month-old WT and Tg2576 mice. E VTA (3 months: WT: n = 10; Tg2576: n = 10; 6 months: WT: n = 10; Tg2576: n = 12 mice. Two-way ANOVA for Genotype vs Age: Interaction: F1,38 = 1.868, p = 0.1797. WT 3 m vs Tg2576 3 m: Unpaired t-test: *p = 0.0466; WT 6 m vs Tg2576 6 m: Unpaired t-test: ****p < 0.0001; Tg2576 3 m vs Tg2576 6 m: Unpaired t-test: ***p = 0.0002). F SNpc (3 months: WT: n = 6; Tg2576: n = 6; 6 months: WT: n = 6; Tg2576: n = 6 mice)
Fig. 3
Fig. 3
VTA DA neurons in the Tg2576 mice show mitochondrial alterations at 3 months of age. A Representative confocal images of AIF labeling in TH+ neurons from WT and Tg2576 mice at 3 months of age (scale: 10 μm). B The graph shows the % of AIF+ nuclei in DA neurons of the VTA (n = 4 mice per genotype; Unpaired t-test: **p = 0.0018). C TEM representative images of normal, swollen, and vacuolated mitochondria (upper row; original magnification 92.000x) from osmium-free TH-stained post-embedded VTA of 3-month-old WT (panels of middle row) and Tg2576 mice (lower row; original magnification 24.000x). Normal-appearing mitochondria (n in all panels) display a smooth outer membrane and well-preserved cristae filled with a regular electron density of the mitochondrial matrix. Swollen (s) and vacuolated-appearing (v) mitochondria exhibit dilation of the intermembrane space, vacuolization of the inner compartment, and an irregular appearance of matrix and cristae. Entirely vacuolized mitochondria (V) contain an amorphous substance or appear as empty vacuoles of various sizes. Although mitochondrial swelling and vacuolization are detectable in WT neurons, Tg2576 neurons show an increase of mitochondria at different stages of swelling and/or vacuolization (plots D-G). In all TEM panels, blue arrowheads point to TH-coding gold particles (scale bar: 30 nm for upper panels, and 130 nm for middle and lower panels; WT: n = 53 TH+ neurons; from 3 mice; Tg2576 mice: n = 51 TH+ neurons, from 3 mice. D Total density of mitochondria (0.68/μm2 ± 0.05 and 0.76/μm2 ± 0.04); E density of normal mitochondria (0.55/μm2 ± 0.04 and 0.34/μm2 ± 0.02; Mann-Whitney test: ***p = 0.0003), F density of swollen/vacuolated mitochondria (0.12/μm2 ± 0.01 and 0.42/μm2 ± 0.03; Mann-Whitney test: ****p < 0.0001), and G ratio of swollen-vacuolated/normal mitochondria (Mann-Whitney test: ****p < 0.0001)
Fig. 4
Fig. 4
DA neurons in the PN of Tg2576 mice show hyperexcitability at 3 months of age. A Representative double immunofluorescent labelling for TH (blue) and biocytin-filled neuron (extravidin; red) in VTA coronal sections (scale: 100 μm). On the right are high magnification images of labelling for TH (blue) and biocytin-filled (red) recorded neurons (scale: 20 μm). B Representative AP traces, recorded in current-clamp mode following 50 pA-stepped depolarizing current injections (scale: 100 ms; 20 mV, 200 pA) in PN DA neurons from WT and Tg2576 mice initially held at − 60 mV, and plot demonstrating the average number of AP (± s.e.m.) elicited every 100 pA depolarizing steps (WT n = 16 cells; Tg2576 n = 12 cells from 10 mice each; two-way ANOVA for genotype vs injected current: interaction: F7,152 = 0.4341, p = 0.8796; genotype: F1,152 = 4.82, p = 0.0297; injected current: F7,152 = 7.197, p < 0.0001). C Sub-threshold responses to 50 pA-stepped hyperpolarizations of PN neurons (scale: 100 ms; 20 mV, 100 pA) and mean current/voltage relationship (± s.e.m.; WT: n = 16 neurons, 7 mice; Tg2576: n = 15 neurons, 9 mice). D The traces show representative responses of WT and Tg2576 neurons to short 10 pA-stepped depolarizing current injections (scale: 20 ms; 15 mV; 100 pA), scaled to show the AP threshold. The dashed lines show the threshold potential measured from the first AP elicited. The plots show the amount of injected current to generate the first AP (rheobase) and the threshold value for WT and Tg2576 neurons (WT: n = 10 neurons, 6 mice; Tg2576: n = 11 neurons, 7 mice; Rheobase: **p = 0.0039; Threshold: *p = 0.0248, both with Welch’s t-test). E Spontaneous firing recorded from PN and PBP neurons of the VTA (scale: 1 s; 0.2 mV), and respective plots showing instantaneous firing frequency (WT, PN: n = 16 neurons, 4 mice; Tg, PN: n = 28 neurons, 7 mice; WT, PBP: n = 16 neurons, 5 mice; Tg2576, PBP: n = 11 neurons, 5 mice; Welch’s t-test, *p = 0.037)
Fig. 5
Fig. 5
Overexpression of CB and CR in DA neurons of the Tg2576 VTA. A. Representative confocal image of coronal midbrain section showing TH+ (in red) together with Calbindin (CB+) or Calretinin (CR+) (both in green; scale: 100 μm). B. Stereological quantification of TH+ neurons co-expressing Ca2+-binding proteins (CB or CR) in the VTA of WT and Tg2576 mice of 3- and 6- months of age. TH+CB+ (3 months: WT: n = 6; Tg2576: n = 6; 6 months: WT: n = 4; Tg2576: n = 5 mice. Two-way ANOVA for Genotype vs Age: Interaction: F1,17 = 2.343, p = 0.1443; Age: F1,17 = 1.625, p = 0.2196; Genotype: F1,17 = 20.72, p = 0.0003. WT 3 m vs Tg2576 3 m: Unpaired t-test: *p = 0.0447; WT 6 m vs Tg2576 6 m: Unpaired t-test: **p = 0.0048; Tg2576 3 m vs Tg2576 6 m: Unpaired t-test: **p = 0.0067). TH+CR+ (3 months: WT: n = 4; Tg2576: n = 5; 6 months: WT: n = 5; Tg2576: n = 7 mice. Two-way ANOVA for Genotype vs Age: Interaction: F1,17 = 0.834, p = 0.3714; Genotype: F1,17 = 22.66, p = 0.0002; Age: F1,17 = 22.6, p = 0.0002; WT 3 m vs Tg2576 3 m: *p = 0.0352; WT 6 m vs Tg2576 6 m: **p = 0.0017; Tg2576 3 m vs Tg2576 6 m: ***p = 0.0005). C. Representative western blots from the midbrain of 1-, 3- and 6-month-old WT and Tg2576 mice, and plots showing the levels (expressed as % of WT) of CB (left panel) or CR (right panel) normalized to Actin as loading control. CB: 1 month: n = 5 mice per genotype; 3 months: WT: n = 9; Tg2576: n = 7 mice; Unpaired t-test: *p = 0.0156; 6-months: WT: n = 12; Tg2576: n = 10 mice. CR: 1 month: n = 5 mice per genotype; 3 months: WT: n = 8; Tg2576: n = 9; 6-months: WT: n = 10; Tg2576: n = 11; Unpaired t-test: *p = 0.0228. D-E. Panels show the analysis of confocal Z-stack double immunofluorescent labelling for TH (blue) and CB (D) or CR (E; both in green) in the VTA of coronal sections from 1-, 3- and 6-months-old WT and Tg2576 mice (scale: 20 μm). Box and whisker plots show the densitometric analysis of CB and CR levels in VTA TH+ neurons (D. 1 months-old: WT n = 6 mice, Tg2576 n = 5 mice; 3 months-old: n = 6 mice per genotype; Welch’s: **p = 0.0046; 6 months-old: WT n = 6 mice, Tg2576 n = 5 mice. E. 1 months-old: n = 4 mice per genotype; 3 months-old: WT n = 5 mice, Tg2576 n = 4 mice; Unpaired t-test: *p = 0. 0263. 6 months-old: WT n = 6 mice, Tg2576 n = 5 mice). F. The plot shows the amount of free [Ca2+] expressed as 340/380 ratio of Fura-2 in the PN o 3-month-old WT and Tg2576 mice (WT: n = 9 neurons,3 mice; Tg2576: n = 10 neurons, 3 mice; Welch’s t-test, **p = 0.0024). G. Representative confocal images of TUNEL-negative (TUNEL-) and -positive (TUNEL+) dopaminergic neurons expressing CB from the VTA of 3-month-old Tg2576 mice (scale bar: 10 μm). The graph shows densitometric levels of CB in TUNEL- and TUNEL+ neurons (TUNEL-: n = 19 neurons; 3 mice; TUNEL+: n = 16 neurons; 3 mice; Unpaired t-test: *p = 0.0141)

References

    1. Blennow K, de Leon MJ, Zetterberg H. Alzheimer’s disease. Lancet Lond Engl. 2006;368(9533):387–403. doi: 10.1016/S0140-6736(06)69113-7. - DOI - PubMed
    1. Congdon EE, Sigurdsson EM. Tau-targeting therapies for Alzheimer disease. Nat Rev Neurol. 2018;14(7):399–415. doi: 10.1038/s41582-018-0013-z. - DOI - PMC - PubMed
    1. Ismail Z, Smith EE, Geda Y, Sultzer D, Brodaty H, Smith G, et al. Neuropsychiatric symptoms as early manifestations of emergent dementia: provisional diagnostic criteria for mild behavioral impairment. Alzheimers Dement. 2016;12(2):195–202. doi: 10.1016/j.jalz.2015.05.017. - DOI - PMC - PubMed
    1. Lyketsos CG, Carrillo MC, Ryan JM, Khachaturian AS, Trzepacz P, Amatniek J, et al. Neuropsychiatric symptoms in Alzheimer’s disease. Alzheimers Dement. 2011;7(5):532–539. doi: 10.1016/j.jalz.2011.05.2410. - DOI - PMC - PubMed
    1. Masters MC, Morris JC, Roe CM. “Noncognitive” symptoms of early Alzheimer disease: a longitudinal analysis. Neurology. 2015;84(6):617–622. doi: 10.1212/WNL.0000000000001238. - DOI - PMC - PubMed

Publication types