. 2022 Nov 26;26(1):67.
doi: 10.1186/s40824-022-00311-4.

Modified exosomal SIRPα variants alleviate white matter injury after intracerebral hemorrhage via microglia/macrophages

Affiliations

Modified exosomal SIRPα variants alleviate white matter injury after intracerebral hemorrhage via microglia/macrophages

Xinjie Gao et al. Biomater Res. .

Abstract

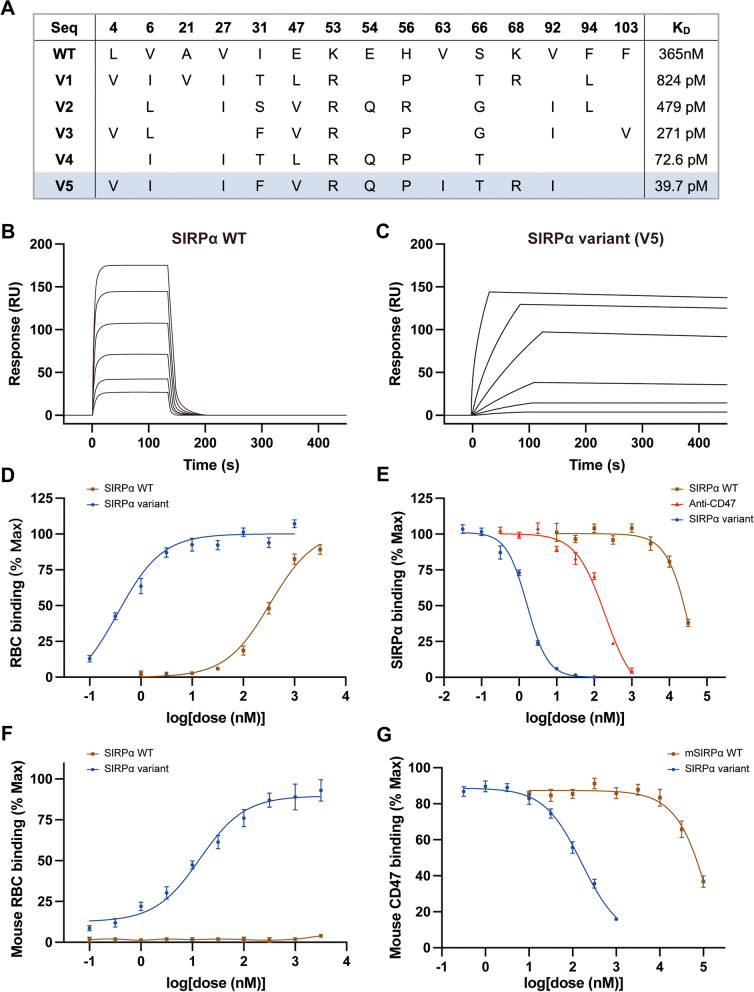
Background: Despite limited efficiency, modulation of microglia/macrophages has shown to attenuate neuroinflammation after intracerebral hemorrhage (ICH). In this context, we evaluated the efficacy of modified exosomal signal regulatory protein α (SIRPα) variants (SIRPα-v Exos) in microglia/macrophages and neuroinflammation-associated white matter injury after ICH.

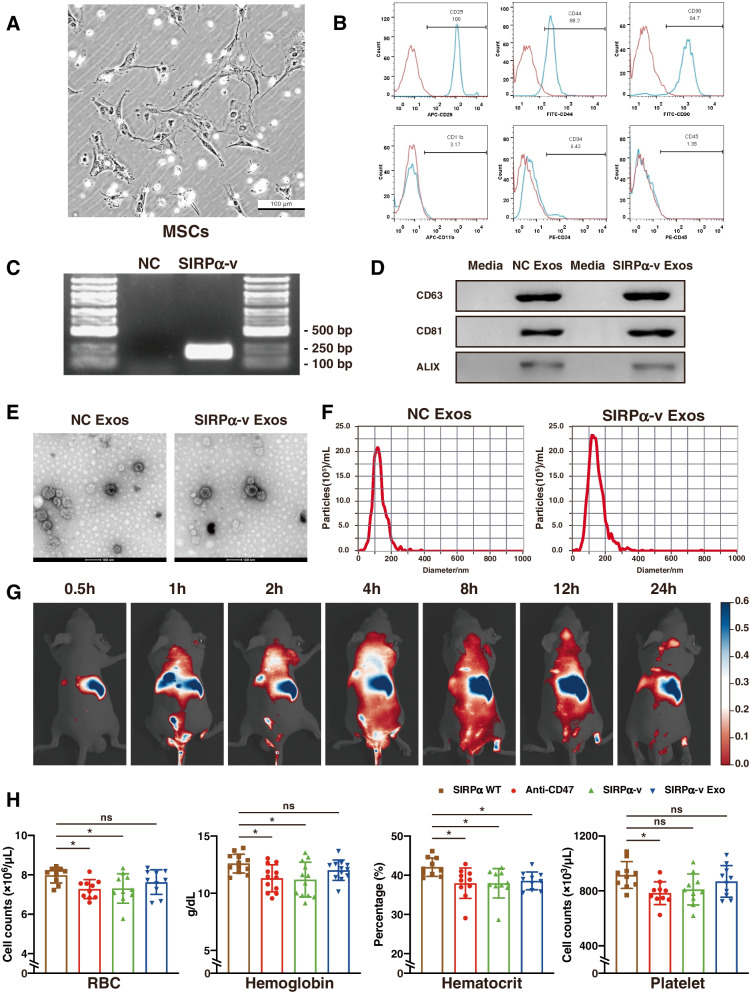
Methods: SIRPα-v Exos were engineered to block CD47-SIRPα interactions. After obtaining SIRPα-v Exos from lentivirus-infected mesenchymal stem cells, C57BL/6 mice suffering from ICH underwent consecutive intravenous injections of SIRPα-v Exos (6 mg/kg) for 14 days. Afterwards, the volume of hematoma and neurological dysfunctions were assessed in mice continuously until 35 days after ICH. In addition, demyelination, electrophysiology and neuroinflammation were evaluated. Furthermore, the mechanisms of microglial regulation by SIRPα-v Exos were investigated in vitro under coculture conditions.

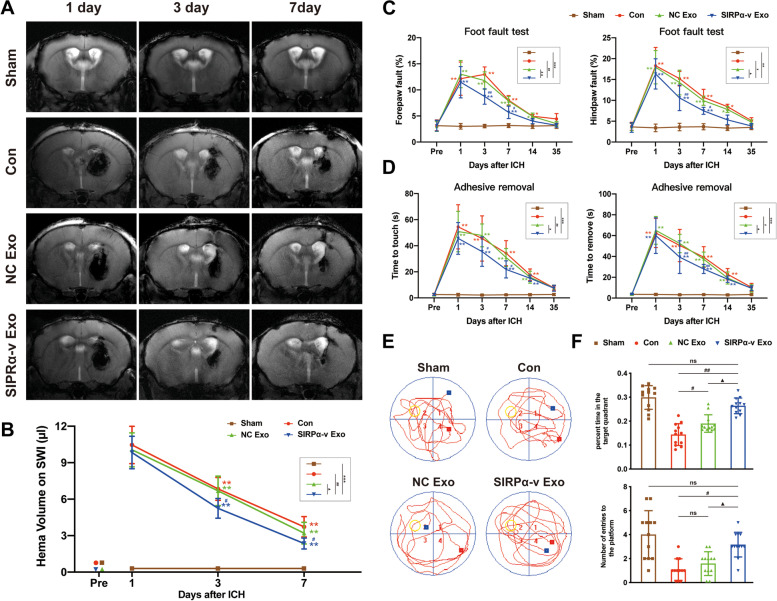
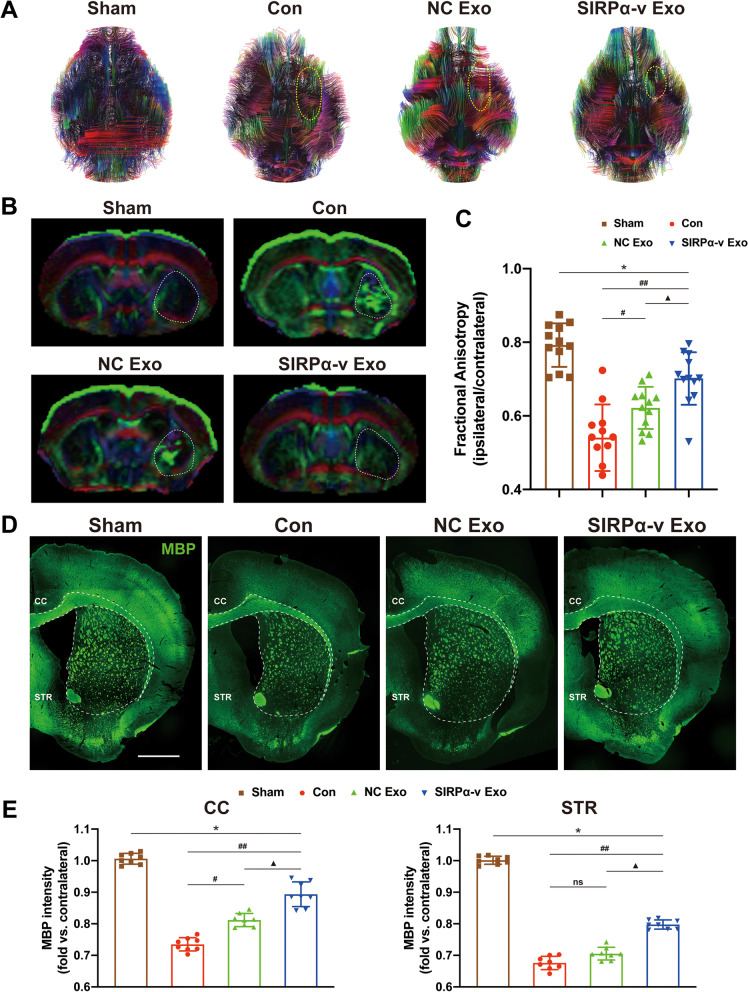
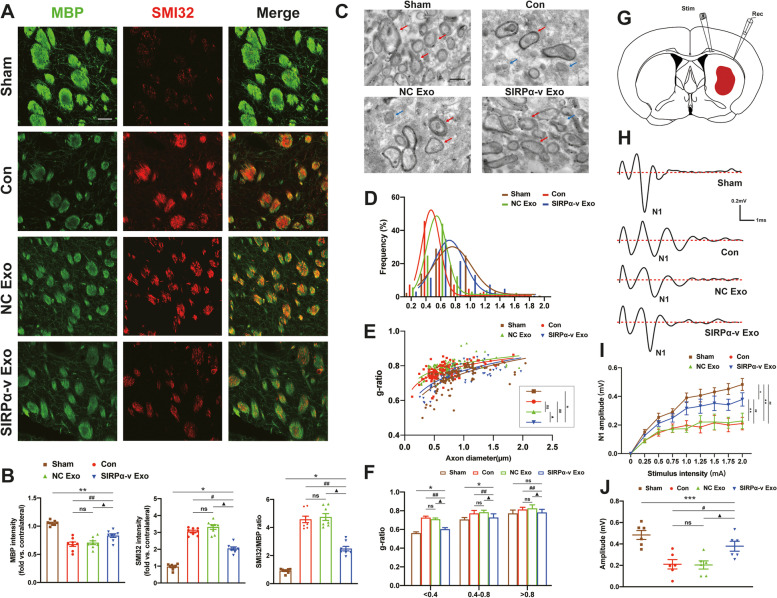
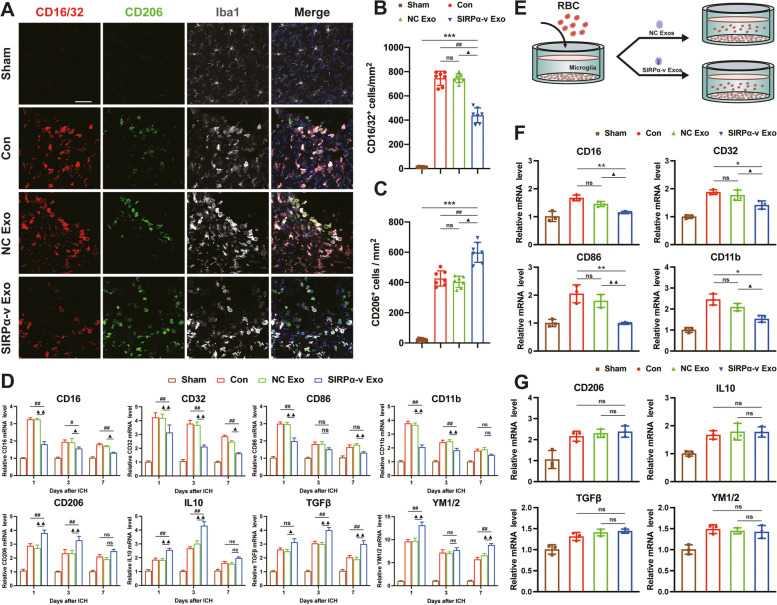
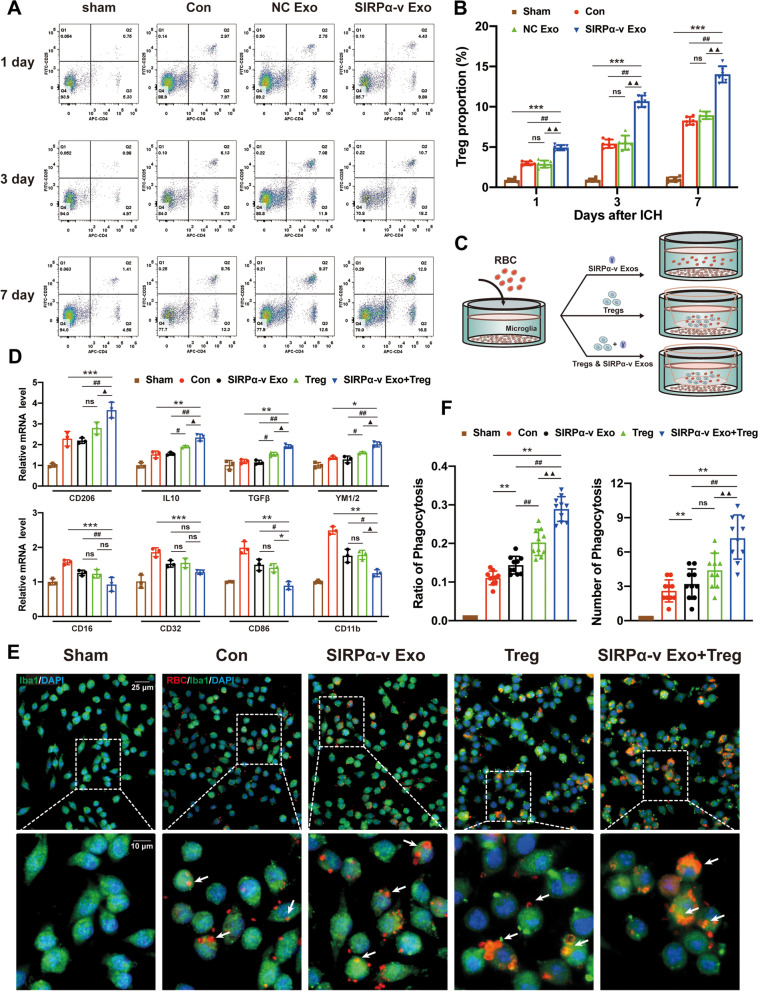
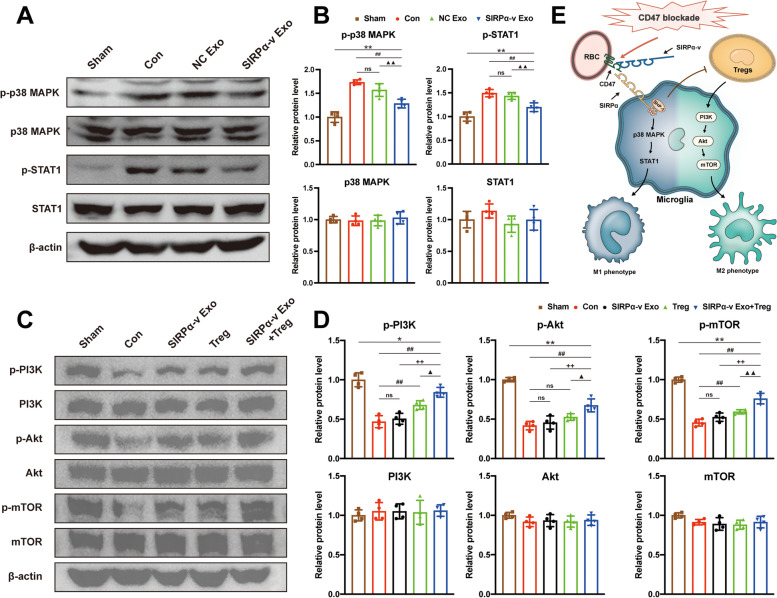
Results: The results demonstrated that the clearance of hematoma in mice suffering from ICH was accelerated after SIRPα-v Exo treatment. SIRPα-v Exos improved long-term neurological dysfunction by ameliorating white matter injury. In addition, SIRPα-v Exos recruited regulatory T cells (Tregs) to promote M2 polarization of microglia/macrophages in the peri-hematoma tissue. In vitro experiments further showed that SIRPα-v Exos regulated primary microglia in a direct and indirect manner in synergy with Tregs.

Conclusion: Our studies revealed that SIRPα-v Exos could accelerate the clearance of hematoma and ameliorate secondary white matter injury after ICH through regulation of microglia/macrophages. SIRPα-v Exos may become a promising treatment for ICH in clinical practice.

Keywords: Exosome; Intracerebral hemorrhage; Microglia/macrophages; SIRPα variant; White matter injury.


Conflict of interest statement

The authors declare that they have no competing interests.

Figures

Fig. 1
Fig. 1
Characterization of high-affinity SIRPα variants. A Table of engineered SIRPα variants sequences and affinity measurements. The sequence of wild-type SIRPα (SIRPα WT) and the position of the mutated amino acids are illustrated in the table. The blue shading indicates the final selected type of SIRPα variant. B Representative SPR sensorgram of SIRPα WT binding CD47. RU = response units. C Representative SPR sensorgram of selected high-affinity SIRPα variant (V5) binding CD47. RU = response units. D Titration curves of SIRPα WT (brown) and high-affinity SIRPα variants (SIRPα variant, blue) binding to erythrocytes. E Dose–response curves of CD47 antagonism on erythrocytes with SIRPα WT (brown), CD47 antibody clone B6H12 (anti-CD47, red), and V5 SIRPα variant (SIRPα variant, blue). Cells were stained with different concentrations of CD47 blocking agents in competition with Alexa Fluor 594-conjugated wild-type SIRPα tetramer. F Fitting curves of SIRPα variant (blue) and SIRPα WT (brown) binding to mouse erythrocytes. Binding assays of biotinylated SIRPα WT and variants were performed with Alexa Fluor 594-conjugated streptavidin. G Mouse CD47 blocking assay. SIRPα variant (blue) and wild-type mouse SIRPα (mSIRPα WT, brown) block Alexa Fluor 594-conjugated wild-type mouse SIRPα tetramers binding to mouse CD47 displayed on the surface of yeast. All the data are presented as the mean ± SD
Fig. 2
Fig. 2
Identification of MSCs and exosomes. A Primary cultivation of MSCs. Spindle-shaped or irregular polygonal cells grew in clusters, relatively sparse between the clusters (scale bar = 100 µm). B The expression of protein markers on the surface of MSCs. The expression of MSC surface markers. MSCs are CD11b/CD34/CD45/CD29+/CD44+/CD90+ cells. C PCR product of SIRPα variant primers on agarose gel electrophoresis. Transfected MSCs stably express SIRPα variants. D Western blot assay of CD63, CD81, and Alix. Both empty exosomes (NC Exo) and SIRPα variant-modified exosomes (SIRPα-v Exo) expressed the three biomarkers. E Representative TEM images of NC Exos and SIRPα-v Exos. NC Exos and SIRPα-v Exos appeared as double-concave disc-shaped vesicles with different diameters, and low-density bright areas could be observed in the vesicles (scale bar = 100 nm). F Fitting curves of NTA analysis. Diameter distribution of NC Exos (diameter: 96.8 ± 5.7 nm) and SIRPα-v Exos (diameter: 100.7 ± 7.3 nm) (n = 5). G Representative in vivo fluorescence images of time-dependent biodistribution of DiR-labeled SIRPα-v Exos in mice (n = 7). H Analysis of blood cell parameters from SIRPα WT, CD47 antibody (anti-CD47), SIRPα variants (SIRPα-v), or SIRPα-v Exo-treated animals (n = 8). All the data are presented as the mean ± SD
Fig. 3
Fig. 3
SIRPα-v Exos accelerate the clearance of hematoma and improve long-term prognosis after ICH. A Coronal SWI images of radiological hematoma changes in mice after ICH, assessed by 11.7 T Ultrahigh field magnetic resonance on the 1st, 3rd, and 7th days post-ICH. B Quantification analysis of the hematoma volume on the 1st, 3rd, and 7th days post-ICH. Compared with the Con and NC Exo groups, the clearance of hematoma was markedly accelerated in the SIRPα-v Exo group (n = 12/group). C, D Sensorimotor functions assessed before and 1, 3, 7, 14, and 35 days after ICH or sham surgery. C The foot-fault test. The frequency of the forepaw or hindpaw was quantified (n = 12/group). D The adhesive removal test. The latency of biting or licking to remove the sticker was measured (n = 10/group). E Representative images of swim paths of mice in each group evaluated by the Morris water maze test on the 35th day post-ICH. The yellow circles represent the location where the platform was previously located. F The time spent in the quadrant and frequency of visits to the quadrant of the previously located platform (n = 12/group). * P < 0.05, ** P < 0.01, *** P < 0.001 vs. Sham group; # P < 0.05, ## P < 0.01 vs. Con group; ▲ P < 0.05, vs. NC Exo group; ns, no significance. All the data are presented as the mean ± SD
Fig. 4
Fig. 4
SIRPα-v Exos alleviate WMI after ICH. A Representative images of 3D reconstruction of DTI on the 35th day post-ICH. The areas in the yellow dotted lines show the defects of white matter tracts. B Representative coronal images of the DEC map on the 35th day post-ICH. C Quantification of FA values on the ipsilateral STR on the 35th day post-ICH. Data are expressed as the ratio of FA values in the ipsilateral (lesioned) hemispheres to the FA values in the non-lesioned contralateral hemispheres (n = 12/group). D Representative images of MBP (green) immunofluorescence in the area associated with DTI (scale bar = 1 mm). E Quantification of the fluorescence intensity (CC and STR) in the area around the hematoma. Data are calculated as fold-change compared to the corresponding contralateral areas (n = 6/group). * P < 0.05, ** P < 0.01 vs. Sham group; # P < 0.05, ## P < 0.01 vs. Con group; ▲ P < 0.05, vs. NC Exo group; ns, no significance. All the data are presented as the mean ± SD. CC, corpus callosum, STR, striatum
Fig. 5
Fig. 5
SIRPα-v Exos ameliorate demyelination after ICH. A Representative immunofluorescence images of MBP and SMI32 in the ipsilateral STR on the 35th day post-ICH (scale bar = 100 μm). B Quantification of the fluorescence intensities of MBP and SMI32 and the ratio of SMI32 to MBP intensity in the ipsilateral STR (n = 8/group). Data are normalized to the intensities of contralateral hemispheres. C Representative TEM images of myelin integrity in the ipsilateral STR on the 35th day post-ICH or after sham surgery (scale bar = 1000 nm). Red arrows indicate medullated fibers, and blued arrows indicate damaged medullated fibers. D Frequency histograms of all the quantified normally myelinated axons showing the distribution of axon diameter. E Scatter plots of the g-ratio versus axon diameter in the sham-operated group or all ICH groups on the 35th day. F The g-ratio of myelinated axons with respect to the axon diameter at 0.4-μm intervals in the sham-operated group or all ICH groups on the 35th day post-ICH (n = 5/group). G Schematic illustration of the position of the stimulating (Stim) and recording (Rec) electrodes for CAP measurements in the CC/EC. H Representative traces of the evoked CAPs in the CC (stimulus, 2 mA; 0.48 mm lateral to the stimulating electrode) on the 35th day post-ICH. I Quantification of the amplitude of the evoked CAPs of myelinated N1 fibers in response to the increase in stimulus strength (0.0 ~ 0.20 mA). J N1 amplitude in response to a 0.2 mA stimulus on the 35th day post-ICH (n = 6/group). * P < 0.05, ** P < 0.01, *** P < 0.001 vs. Sham group; # P < 0.05, ## P < 0.01 vs. Con group; ▲ P < 0.05, ▲▲ P < 0.01 vs. NC Exo group; ns, no significance. All the data are presented as the mean ± SD
Fig. 6
Fig. 6
SIRPα-v Exos modulated the polarization of microglia/macrophages after ICH. A Representative immunofluorescence images of CD16/32 (red), CD206 (green), and Iba1 (silver) in the ipsilateral STR around the hematoma on the 3rd day post-ICH (scale bar = 100 μm). B Quantification analysis of CD16/32+ and Iba1+ cells in the ipsilateral STR around the hematoma on the 3rd day post-ICH. C Quantification analysis of CD206+ and Iba1+ cells in the ipsilateral STR around the hematoma on the 3rd day post-ICH. D The mRNA levels of CD16, CD32, CD86, and CD11b (biomarkers for M1 microglia) and CD206, IL-10, TGFβ, and YM1/2 (biomarkers for M2 microglia) detected by RT-qPCR on the 1st, 3rd, 7th days post-ICH (n = 6/group). E Schematic illustration of the experimental design (separate application of SIRPα-v Exos) in vitro. F The mRNA levels of CD11b, CD16, CD32, and CD86 detected by RT-qPCR after separate application of SIRPα-v Exos (n = 3/group). G The mRNA levels of CD206, TGFβ, IL-10, and YM1/2 detected by RT-qPCR after separate application of SIRPα-v Exos (n = 3/group). * P < 0.05, ** P < 0.01, *** P < 0.001 vs. Sham group; # P < 0.05, ## P < 0.01 vs. Con group; ▲ P < 0.05, ▲▲ P < 0.01 vs. NC Exo group; ns, no significance. All the data are presented as the mean ± SD
Fig. 7
Fig. 7
Tregs were required for promoting the M2-phenotype and phagocytosis by SIRPα-v Exos. A Representative flow cytometry images of CD4+ CD25+ cells in the ipsilateral STR around the hematoma on the 1st, 3rd, and 7th days post-ICH (n = 6/group). B Changes in the proportion of CD4+ CD25+ cells in the ipsilateral STR around the hematoma on the 1st, 3rd, and 7th days post-ICH (n = 6/group). * P < 0.05, ** P < 0.01, *** P < 0.001 vs. Sham group; # P < 0.05, ## P < 0.01 vs. Con group; ▲ P < 0.05, ▲▲ P < 0.01 vs. NC Exo group; ns, no significance. C Schematic illustration of the experimental design (combined application of Tregs and SIRPα-v Exos) in vitro. D The mRNA levels of CD206, TGFβ, IL-10, YM1/2, CD11b, CD16, CD32, and CD86 assessed by RT-qPCR after administration of Tregs or a combination of Tregs and SIRPα-v Exos (n = 3/group). E Representative immunofluorescence images of erythrocytes (red), Iba1 (green), and DAPI (blue) in primary microglia treated with or without Tregs and SIRPα-v Exos (scale bar1 = 25 μm, scale bar2 = 10 μm). The white arrows indicate microglia that phagocytosed erythrocytes. F Quantification analysis of the ratio of microglia phagocytosing erythrocytes in each field of view and erythrocytes phagocytosed per microglia 24 h after coculture with erythrocytes (n = 10/group). * P < 0.05, ** P < 0.01, *** P < 0.001 vs. Con group; # P < 0.05, ## P < 0.01 vs. SIRPα-v Exo group; ▲ P < 0.05, ▲▲ P < 0.01 vs. Treg group; ns, no significance. All the data are presented as the mean ± SD
Fig. 8
Fig. 8
SIRPα-v Exos regulate microglial polarization via the p38-STAT1 and PI3K-Akt-mTOR signaling pathways. A Western blot images showing the protein levels of phospho-/nonphospho- p38 MAPK and STAT1 in primary microglia. B Quantification analysis of the expression of phospho/nonphospho-p38 MAPK and STAT1 by Western blotting (n = 4/group). * P < 0.05, ** P < 0.01, vs. Sham group; # P < 0.05, ## P < 0.01 vs. Con group; ▲ P < 0.05, ▲▲ P < 0.01 vs. NC Exo group; ns, no significance. C Representative Western blot images showing the protein levels of phospho/nonphospho-PI3K, Akt, and mTOR in primary microglia. D Quantification analysis of the phosphorylation levels of PI3K, Akt, and mTOR by Western blot (n = 4/group). E Schematic illustration of the proposed mechanisms underlying the regulation of microglia by SIRPα variants. * P < 0.05, ** P < 0.01, vs. Sham group; # P < 0.05, ## P < 0.01 vs. Con group; + P < 0.05, +  + P < 0.01, vs. SIRPα-v Exo group; ▲ P < 0.05, ▲▲ P < 0.01 vs. Treg group; ns, no significance. All the data are presented as the mean ± SD

Similar articles

Cited by

References

    1. Kellner CP, Song R, Troiani ZS, Ascanio LCMocco J. Minimally invasive endoscopic evacuation of intracerebral haemorrhage: reaching the goal. Lancet. 2020;395(10218):e5. doi: 10.1016/S0140-6736(19)33007-7. - DOI - PubMed
    1. Asch C, Luitse MJ, Rinkel GJ, Tweel IKlijn CJ. Incidence, case fatality, and functional outcome of intracerebral haemorrhage over time, according to age, sex, and ethnic origin: a systematic review and meta-analysis. Lancet Neurol. 2010;9(2):167–176. doi: 10.1016/S1474-4422(09)70340-0. - DOI - PubMed
    1. Xi G, Hua Y, Bhasin RR, Ennis SR, Keep RFHoff JT. Mechanisms of edema formation after intracerebral hemorrhage: effects of extravasated red blood cells on blood flow and blood-brain barrier integrity. Stroke. 2001;32(12):2932–2938. doi: 10.1161/hs1201.099820. - DOI - PubMed
    1. Keep RF, Hua Y, Xi G. Intracerebral haemorrhage: mechanisms of injury and therapeutic targets. Lancet Neurol. 2012;11(8):720–31. doi: 10.1016/S1474-4422(12)70104-7. - DOI - PMC - PubMed
    1. Dulamea AO. The contribution of oligodendrocytes and oligodendrocyte progenitor cells to central nervous system repair in multiple sclerosis: perspectives for remyelination therapeutic strategies. Neural Regen Res. 2017;12(12):1939. doi: 10.4103/1673-5374.221146. - DOI - PMC - PubMed