. 2022 Nov 26;13(1):7295.
doi: 10.1038/s41467-022-35010-0.

Creb5 coordinates synovial joint formation with the genesis of articular cartilage

Affiliations

Creb5 coordinates synovial joint formation with the genesis of articular cartilage

Cheng-Hai Zhang et al. Nat Commun. .

Abstract

While prior work has established that articular cartilage arises from Prg4-expressing perichondrial cells, it is not clear how this process is specifically restricted to the perichondrium of synovial joints. We document that the transcription factor Creb5 is necessary to initiate the expression of signaling molecules that both direct the formation of synovial joints and guide perichondrial tissue to form articular cartilage instead of bone. Creb5 promotes the generation of articular chondrocytes from perichondrial precursors in part by inducing expression of signaling molecules that block a Wnt5a autoregulatory loop in the perichondrium. Postnatal deletion of Creb5 in the articular cartilage leads to loss of both flat superficial zone articular chondrocytes coupled with a loss of both Prg4 and Wif1 expression in the articular cartilage; and a non-cell autonomous up-regulation of Ctgf. Our findings indicate that Creb5 promotes joint formation and the subsequent development of articular chondrocytes by driving the expression of signaling molecules that both specify the joint interzone and simultaneously inhibit a Wnt5a positive-feedback loop in the perichondrium.


Conflict of interest statement

The authors declare no competing interests.

Figures

Fig. 1
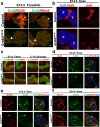
Fig. 1. Creb5 and Gdf5 expression overlap in the developing synovial joint interzones.
a, b Gene expression in E13.5 and E14.5 forelimbs from WT mice assayed by multiplexed RNAscope FISH. c Immunofluorescent staining of E14.5 and E18.5 forelimbs from WT mice for Creb5 and DAPI (to visualize nuclei). The articular perichondrium (yellow arrows) and metaphyseal/diaphyseal perichondrium (white arrows) are indicated. Shoulder (S) and Elbow (E) indicated. Similar results were obtained in at least two independent biological repeats. Scale bar equals 200 microns.
Fig. 2
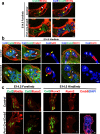
Fig. 2. Creb5 is necessary for synovial joint interzone formation.
a Gene expression assayed by FISH in serial sections of the forelimb of an E13.5 Creb5Δ9/Δ9 embryo or a control littermate (which is either Creb5Δ9/+ or Creb5+/+). Arrows indicate the interzone of the forming metacarpophalangeal joints in the control embryo. Arrowheads indicate the interzone of the ulnohumeral joint in a Creb5Δ9/Δ9 embryo. b Gene expression assayed by RNAscope FISH in the hindlimb of an E14.5 Creb5Δ9/Δ9 embryo or control littermate. Femur (F) and Tibia (T) are indicated. Scale bar equals 100 microns. c Gene expression assayed by FISH in serial sections of the forelimb from an E14.5 Creb5Δ9/Δ9 embryo or control littermate. df Gene expression assayed by RNAscope FISH in serial sections of the knee of an E14.5 Creb5Δ9/Δ9 embryo or control littermate. In control limbs, the location of the articular perichondrium between the separated cartilage elements (yellow arrows) is indicated. In Creb5Δ9/Δ9 mutant limbs, the junction of the fused cartilage elements (yellow arrowheads) is indicated. Similar results were obtained in at least two independent biological repeats. Scale bar equals 200 microns, unless indicated otherwise.
Fig. 3
Fig. 3. Creb5 is necessary for the formation of many synovial joints.
a Alcian Blue/Alizarin Red staining of the knees and autopods of P0 Creb5Δ9/Δ9 mice or their WT littermates. Gene expression assayed by FISH and immunocytochemistry for Creb5 and carboxy-terminal phosphorylated Smad2 (pSmad2) in sections of the knees (b) and elbows (c) of P0 Creb5Δ9/Δ9 mice or their control littermates. Parallel sections were stained with Safranin O/Fast Green (FG). Femur (F), Tibia (T), Humerus (H) and Radius (R) are indicated. Similar results were obtained in either 14 (a), 4 (b) or 2 (c) independent biological repeats. Scale bar equals 200 microns.
Fig. 4
Fig. 4. Creb5 is expressed in a reciprocal pattern to Wnt5a in the perichondrium.
Gene expression assayed by RNAscope FISH in the forelimb of a WT E14.5 mouse embryo (a) or the knee of an E14.5 Creb5Δ9/Δ9 embryo or control littermate (b). In WT/control limbs, the articular perichondrium (yellow arrows) and metaphyseal/diaphyseal perichondrium (white arrows) are indicated. In Creb5Δ9/Δ9 mutant limb, the perichondrial cells expressing both Wnt5a and mutant Creb5Δ9/Δ9 transcripts (white arrowheads) are indicated. Similar results were obtained in at least three independent biological repeats. Scale bar equals 200 microns.
Fig. 5
Fig. 5. Misexpression of iCreb5-HA(Prx1-Cre) inhibits perichondrial expression of Wnt5a, Crabp1 and Runx2.
Gene expression assayed by RNAscope FISH (a, b) or FISH (c) in serial sections of indicated limbs of either E14.5 Prx1-Cre-iCreb5 embryos or control littermates. In control limbs, the articular perichondrium (yellow arrows) and metaphyseal/diaphyseal perichondrium (white arrows) are indicated. In Prx1-Cre-iCreb5 limbs, the iCreb5-HA(Prx1-Cre)+, Wnt5a/Crabp1 perichondrium (yellow arrowheads) is indicated. Femur (F) and Tibia (T) are indicated. Right-most panel of c displays immunofluorescent staining for Creb5 and DAPI in serial section of the same hindlimb analyzed by FISH. Red fluorescent signal in ectoderm is non-specific. Similar results were obtained in either 5 (a) or 2 (b, c) independent biological repeats. Scale bar equals 200 microns.
Fig. 6
Fig. 6. Misexpression of iCreb5-HA(Prx1-Cre) blocks growth plate formation and phenocopies aspects of Wnt5a loss of function.
a Alcian Blue/Alizarin Red whole mount staining and b, c Von Kossa/Alcian Blue staining of indicated limbs from either P0 Prx1-Cre-iCreb5 mice or control littermates. Femur (F), Resting zone chondrocytes (R), Proliferating zone chondrocytes (P) and Hypertrophic zone chondrocytes (H) are indicated. Scale bar equals 100 microns in c. d, e Gene expression assayed by RNAscope FISH in E14.5 forelimbs of either control littermates, Wnt5aΔexon2/Δexon2 embryos or Prx1-Cre-iCreb5 embryos. Similar results were obtained in either 7 (a), 2 (b, c, e) or 3 (d) independent biological repeats. Scale bar equals 200 microns, unless otherwise indicated.
Fig. 7
Fig. 7. Misexpression of Creb5 in all limb bud mesenchymal cells, but not in Sox9-expressing cells, profoundly blocks longitudinal growth in the stylopod and zeugopod cartilage elements and induces the perichondrium to develop as articular cartilage.
a Gene expression assayed by FISH in serial sections of forelimbs from either a P0 Prx1-Cre-iCreb5 mouse or a control littermate. Humerus (H) is indicated. b Alcian Blue/Alizarin Red whole mount staining of either a P0 Prx1-Cre-iCreb5 mouse or a control littermate (that lacks either the Prx1-Cre or the Rosa26iCreb5-HA allele). c Immunofluorescence detection of either iCreb5-HA(Prx1-Cre) (green), endogenous and exogenous Creb5 (red) and DAPI (to detect nuclei) in serial sections of the forelimb of a P0 Prx1-Cre-iCreb5 mouse. Red fluorescent signal in ectoderm (in right-most image) is an artifact and was also observed in the absence of anti-Creb5. d Alcian Blue/Alizarin Red whole mount staining of either an E16.5 Sox9-ires-Cre-iCreb5 embryo or a control littermate (that lacks either the Sox9-ires-Cre or the Rosa26iCreb5-HA allele). e Immunofluorescence detection of iCreb5-HA(Sox9-Cre), Sox9, and DAPI in the forelimb of an E16.5 Sox9-ires-Cre-iCreb5 embryo. Similar results were obtained in either 5 (a), 7 (b), 2 (c, e) or 4 (d) independent biological repeats. Scale bar equals 200 microns. f Our findings suggest that iCreb5-HA(Prx1-Cre) expression in limb bud mesenchymal cells (other than in Sox9-expressing cells) promotes the generation of an articular perichondrium encasing the stylopod and zeugopod cartilage elements, blocks perichondrial expression of Wnt5a, Crabp1 and Runx2, and thus inhibits formation of both cortical bone and growth plates within these forming cartilage elements (which resemble tarsal/carpal-like bones).
Fig. 8
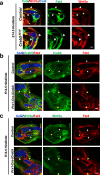
Fig. 8. Misexpression of iCreb5-HA(Prx1-Cre) promotes formation of a Fat4+, Wnt5a perichondrium.
Gene expression assayed by RNAscope FISH in the hindlimbs of an E14.5 Creb5Δ9/Δ9 embryo or control littermate (a) or in serial sections of the forelimbs of an E14.5 Prx1-Cre-iCreb5 embryo or control littermate (b, c). In control limbs, the Fat4high, Wnt5alow articular perichondrium (yellow arrows) and Fat4low, Wnt5ahigh metaphyseal/diaphyseal perichondrium (white arrows) are indicated. In Creb5Δ9/Δ9 mutant limbs, the perichondrial cells expressing both Wnt5a and mutant Creb5Δ9/Δ9 (white arrowheads) are indicated. In Prx1-Cre-iCreb5 limbs: Fat4low, Wnt5ahigh perichondrium (white arrowheads) or Fat4high, Wnt5alow perichondrium (yellow arrowheads) are indicated. In Prx1-Cre-iCreb5 embryos, perichondrial expression of iCreb5-HA(Prx1-Cre) promotes high level expression of Fat4 in the perichondrium, blocks expression of Wnt5a in this same tissue (yellow arrowheads) and inhibits chondrocyte hypertrophy. Perichondrium surrounding cartilage elements that display chondrocyte hypertrophy in Prx1-Cre-iCreb5 embryos continue to express WT levels of Wnt5a (white arrowheads). Similar results were obtained in two independent biological repeats. Scale bar equals 200 microns.
Fig. 9
Fig. 9. Creb5 is necessary to maintain appropriate zonal gene expression in the articular cartilage and blocks premature endochondral ossification of adjacent tissues in postnatal mice.
Gene expression assayed by RNAscope FISH in the hindlimbs of either P14 (a) or P30 (b) Aggrecan1tm(IRES-CreERT2); Creb5flox9/flox9 mice or Creb5flox9/flox9 littermates, that had been administered tamoxifen from postnatal days 1–11. In each row of images, the left two images depict the same section; and the right two images depict the same section. Scale bar equals 200 microns in a and b. c Safranin O/Fast Green staining of the anterior meniscus (and articular cartilage) in the knees of either P30 or P42 Aggrecan1tm(IRES-CreERT2); Creb5flox9/flox9 mice or Creb5flox9/flox9 littermates, that had been administered tamoxifen from postnatal days 1–11. Arrowheads indicate flat cells on the surface of the meniscus. Femur (F), Tibia (T), and Meniscus (M) are indicated. Scale bar equals 100 microns in c. P14 images were obtained from tissues of female mice; P30 and P42 images were obtained from tissues of either male or female mice. Similar results were obtained in at least 2 (a, b) or 3 (c) independent biological repeats.
Fig. 10
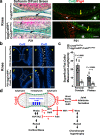
Fig. 10. Creb5 is necessary to maintain flat cells in the superficial zone of the articular cartilage in postnatal mice.
a Safranin O/Fast Green staining or RNAScope FISH of the articular surface of the knees of P21 Aggrecan1tm(IRES-CreERT2); Creb5flox9/flox9 mice or Creb5flox9/flox9 littermates, that had been administered tamoxifen from postnatal days 1–11. Left: Location of normally flat cells (in control mice) in the superficial zone of the tibial articular cartilage is indicated (black arrows). Right: Note that in Aggrecan1tm(IRES-CreERT2); Creb5flox9/flox9 mice, Aggrecan-CreERt2 mediated deletion of exon 9 from Creb5flox9/flox9 reduces Prg4 expression in the surface of the articular cartilage (yellow arrows) but does not affect Prg4 expression in the synovial membrane (which does not express Aggrecan-CreERt2) (white arrowheads). Femur (F), Tibia (T) and Meniscus (M) are indicated. Scale bar equals 100 microns in a. P21 images were obtained from tissues of female mice. b RNAScope FISH of Col2a1-expressing cells in the knee joint of either a P30 male Aggrecan1tm(IRES-CreERT2); Creb5flox9/flox9 mouse or a P30 male Creb5flox9/flox9 littermate, that had been administered tamoxifen from postnatal days 1–11. Box outlined in left image is enlarged in right image. Arrows indicate small flat Col2a1-expressing cells on the surface of the articular cartilage. Femur (F) and Tibia (T) are indicated. Scale bar equals 200 microns in left panel; 100 microns in right panel. Similar results were obtained in at least 4 (a, b) independent biological repeats. c Quantitation of the number of small flat cells/mm measured surface length of the articular cartilage displayed in b. Each point represents a different RNAScope section obtained from either one P30 male Creb5flox9/flox9 mouse that was treated with tamoxifen (n = 9 sections); or from one P30 male Aggrecan1tm(IRES-CreERT2); Creb5flox9/flox9 mouse that was treated with tamoxifin (n = 8 sections). Statistical analysis was a two-sided test without adjustments. p values are indicated and error bar indicates standard error of the mean. d Creb5 is critical to maintain appropriate expression of both Wnt ligands and other signaling molecules in the interzones of developing synovial joints; and is thus crucial for the formation of most joints. Creb5 both promotes the formation of articular chondrocytes and blocks growth plate development in the epiphyses by inhibiting expression of Wnt5a in the articular/epiphyseal perichondrium.

References

    1. Ono N, Balani DH, Kronenberg HM. Stem and progenitor cells in skeletal development. Curr. Top. Dev. Biol. 2019;133:1–24. doi: 10.1016/bs.ctdb.2019.01.006. - DOI - PMC - PubMed
    1. Tsang KY, Cheah KS. The extended chondrocyte lineage: implications for skeletal homeostasis and disorders. Curr. Opin. Cell Biol. 2019;61:132–140. doi: 10.1016/j.ceb.2019.07.011. - DOI - PubMed
    1. Kozhemyakina E, et al. Identification of a Prg4-expressing articular cartilage progenitor cell population in mice. Arthritis Rheumatol. 2015;67:1261–1273. doi: 10.1002/art.39030. - DOI - PMC - PubMed
    1. Li L, et al. Superficial cells are self-renewing chondrocyte progenitors, which form the articular cartilage in juvenile mice. FASEB J. 2017;31:1067–1084. doi: 10.1096/fj.201600918R. - DOI - PMC - PubMed
    1. Decker RS, et al. Cell origin, volume and arrangement are drivers of articular cartilage formation, morphogenesis and response to injury in mouse limbs. Dev. Biol. 2017;426:56–68. doi: 10.1016/j.ydbio.2017.04.006. - DOI - PMC - PubMed

Publication types

MeSH terms