. 2022 Nov 26;13(1):7281.
doi: 10.1038/s41467-022-34871-9.

ARID1A loss induces polymorphonuclear myeloid-derived suppressor cell chemotaxis and promotes prostate cancer progression

Affiliations

ARID1A loss induces polymorphonuclear myeloid-derived suppressor cell chemotaxis and promotes prostate cancer progression

Ni Li et al. Nat Commun. .

Abstract

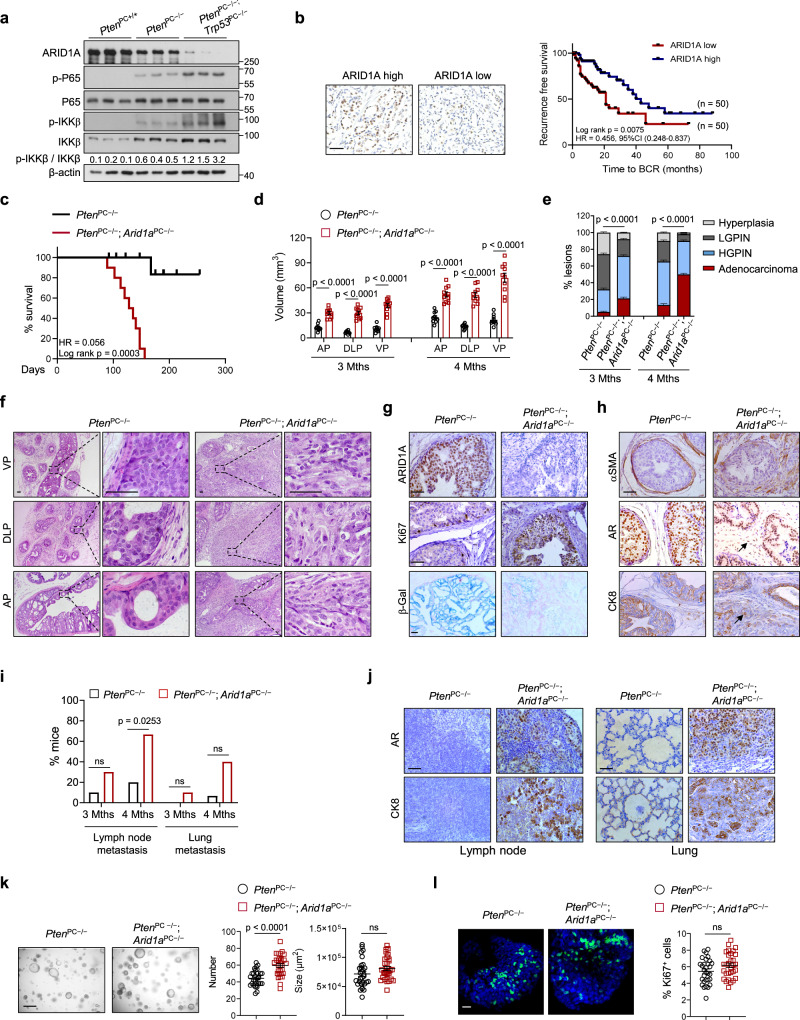
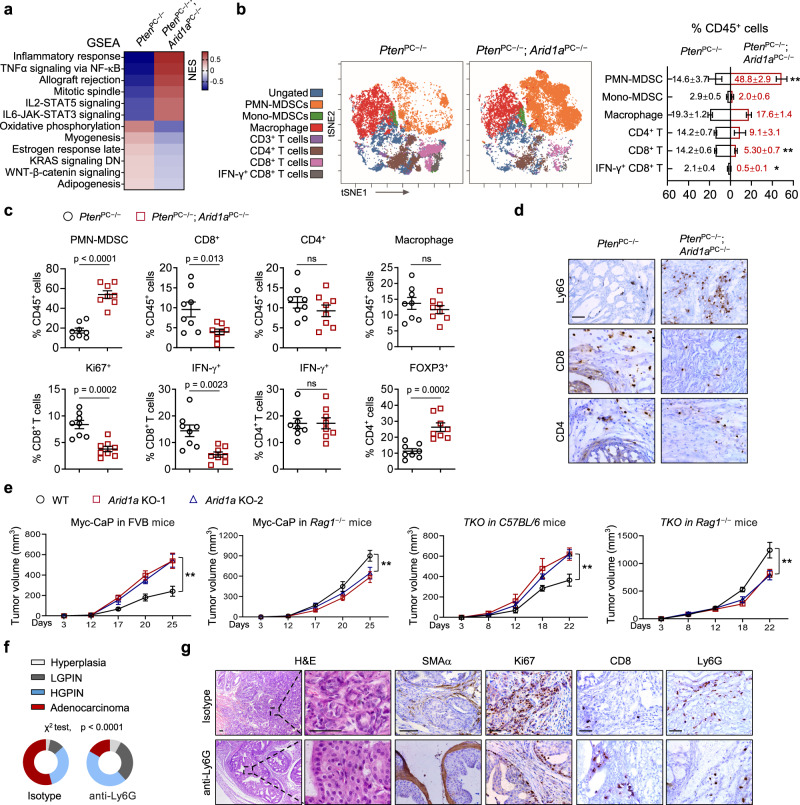
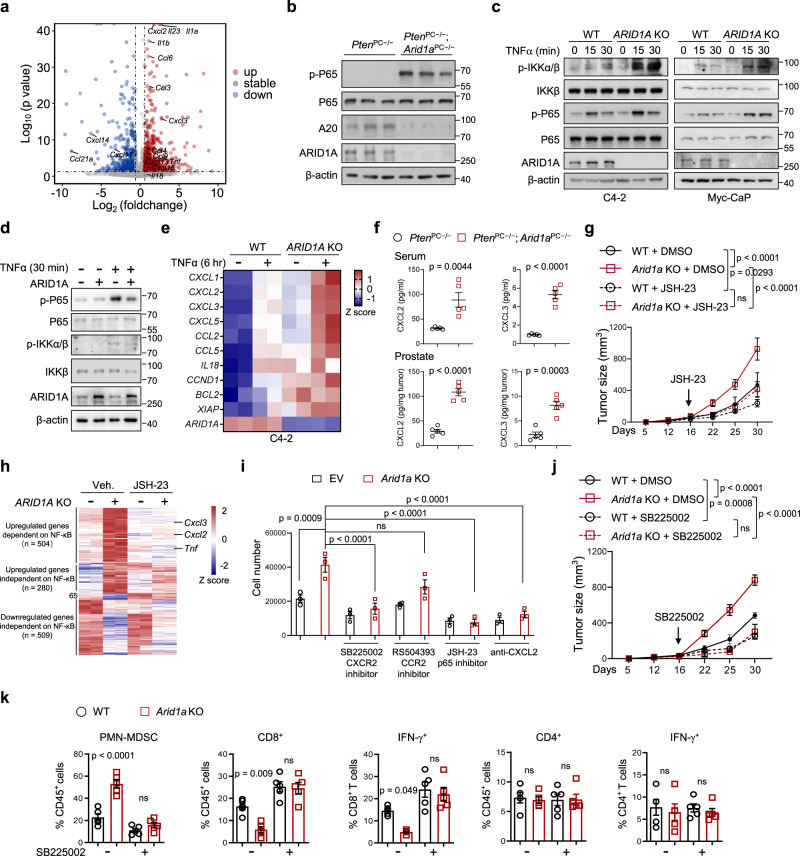
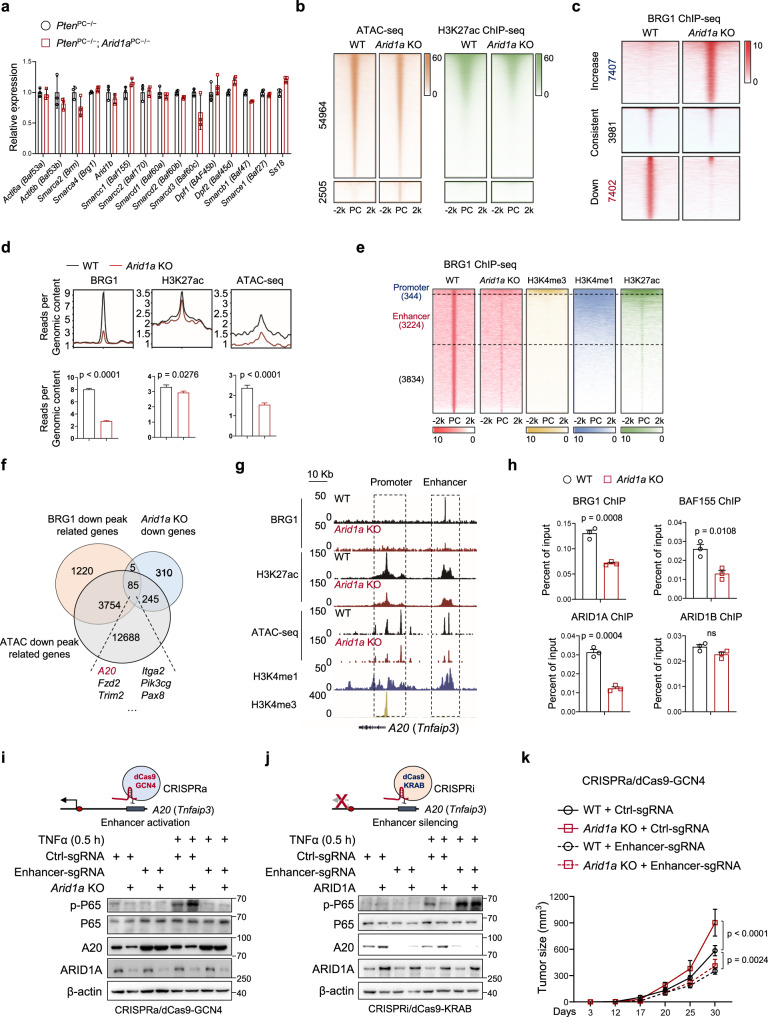
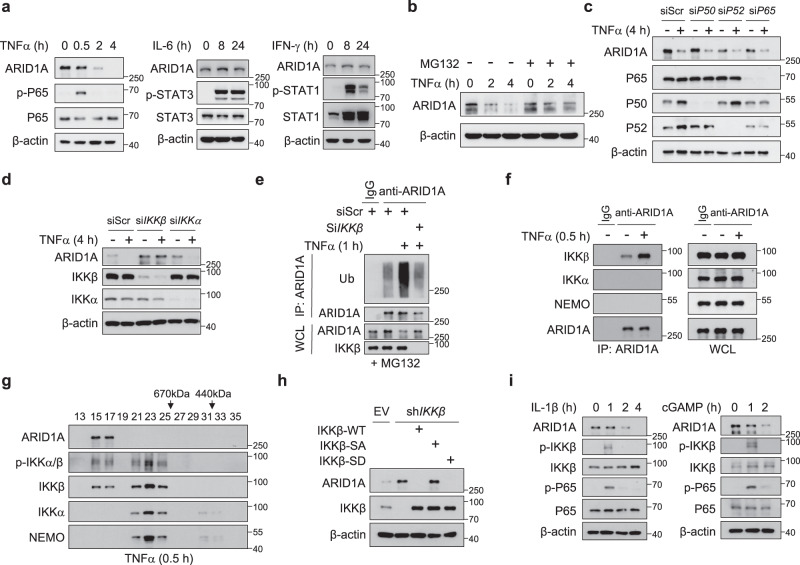
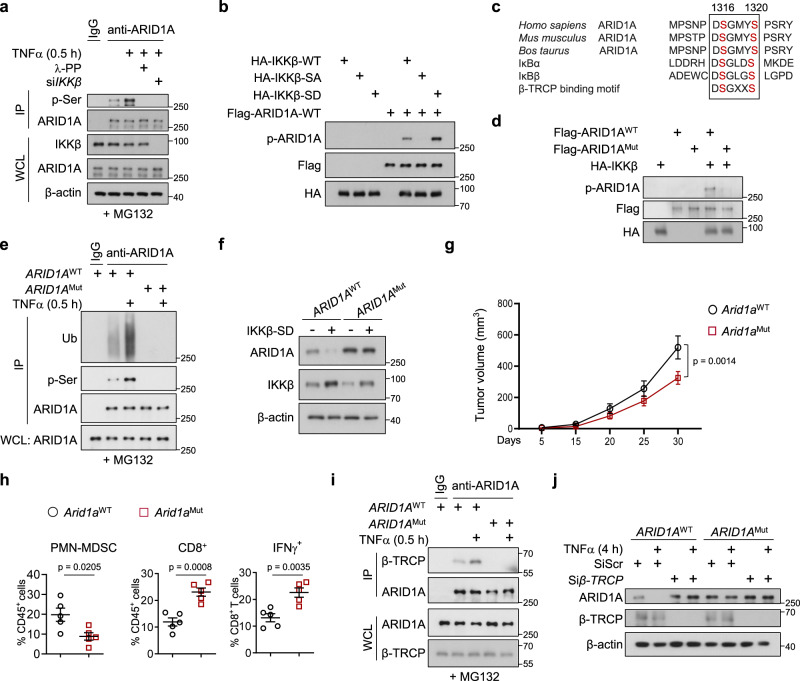
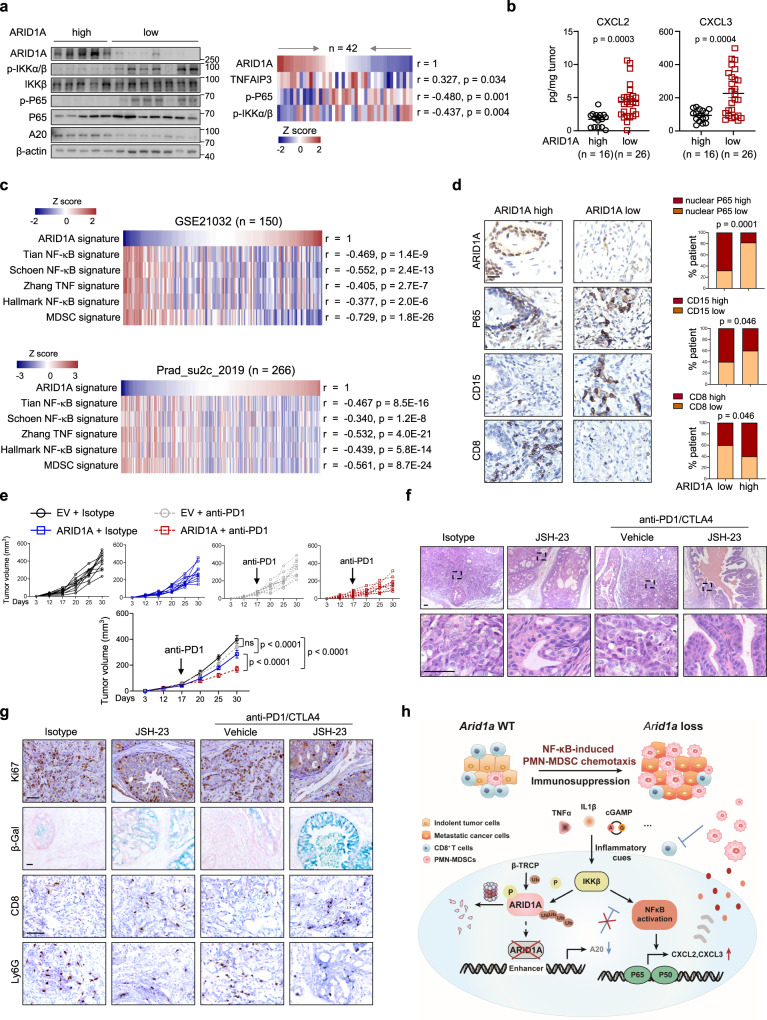
Chronic inflammation and an immunosuppressive microenvironment promote prostate cancer (PCa) progression and diminish the response to immune checkpoint blockade (ICB) therapies. However, it remains unclear how and to what extent these two events are coordinated. Here, we show that ARID1A, a subunit of the SWI/SNF chromatin remodeling complex, functions downstream of inflammation-induced IKKβ activation to shape the immunosuppressive tumor microenvironment (TME). Prostate-specific deletion of Arid1a cooperates with Pten loss to accelerate prostate tumorigenesis. We identify polymorphonuclear myeloid-derived suppressor cells (PMN-MDSCs) as the major infiltrating immune cell type that causes immune evasion and reveal that neutralization of PMN-MDSCs restricts the progression of Arid1a-deficient tumors. Mechanistically, inflammatory cues activate IKKβ to phosphorylate ARID1A, leading to its degradation via β-TRCP. ARID1A downregulation in turn silences the enhancer of A20 deubiquitinase, a critical negative regulator of NF-κB signaling, and thereby unleashes CXCR2 ligand-mediated MDSC chemotaxis. Importantly, our results support the therapeutic strategy of anti-NF-κB antibody or targeting CXCR2 combined with ICB for advanced PCa. Together, our findings highlight that the IKKβ/ARID1A/NF-κB feedback axis integrates inflammation and immunosuppression to promote PCa progression.


Conflict of interest statement

The authors declare no competing interests.

Figures

Fig. 1
Fig. 1. ARID1A is clinically and functionally important for PCa progression.
a IB analysis of the indicated proteins in 3-month-old mouse prostate tissues with the indicated genotypes (n = 3). b Representative IHC staining and Kaplan–Meier plot of recurrence based on ARID1A expression in the TMA with PCa (n = 100). HR, hazard ratio. Scale bar, 50 μm. c Kaplan–Meier survival plots of PtenPC−/− and PtenPC−/−; Arid1aPC−/− mice (n = 10 for each group). d Quantitation of 3- or 4-month-old prostatic volumes of indicated mice (n = 10). e Quantification of histological grade at the indicated time points (n = 15). f H&E-stained sections in the anterior (AP), dorsolateral (DLP) and ventral (VP) prostates of 16-week-old PtenPC−/− and PtenPC−/−; Arid1aPC−/− prostates (n = 15, representative data are shown). Scale bars, 50 μm. g Immunohistochemical analysis of ARID1A and Ki67 expression and β-Gal staining in prostate sections. Scale bar, 50 μm. h IHC for SMAα, AR and CK8 in prostate sections. Scale bars, 50 μm. i Quantification of the metastatic incidence as indicated (n = 10 for 3 months, n = 15 for 4 months). j AR and CK8 staining of lymph nodes and lungs from 16-week-old mice. Scale bar, 50 μm. k Representative organoid images derived from 4-month-old PtenPC−/− and PtenPC−/−; Arid1aPC−/− mice and quantification (n = 10 fields from three mice per group). Scale bar, 500 μm. l Immunofluorescence staining and quantification of the organoids with Ki67+ cells (n = 10 fields from three mice per group). Scale bar, 100 μm. d, e, k, l Data represent the mean ± SEM. Statistical significance was determined by the log-rank test (b, c), two-tailed unpaired t-test (d, k, l), χ2-test (e) and Fisher’s exact test (i). g, h Experiments were repeated at least three times independently with similar results; data from one representative experiment are shown. Source data are provided as a Source Data file. ns, no significance.
Fig. 2
Fig. 2. Arid1a loss produces an immunosuppressive TME via the induction of PMN-MDSC recruitment.
a GSEA revealed the top 6 upregulated and downregulated hallmark pathways in the prostate epithelium from 3-month-old PtenPC−/− and PtenPC−/−; Arid1aPC−/− prostate tumors. b Immunoprofiling and quantification of 3-month-old PtenPC−/− and PtenPC−/−; Arid1aPC−/− prostate tumors by CyTOF (n = 3). Exact p-values between the indicated tumors for PMN-MDSCs (p = 0.002), CD8+ T cells (p = 0.0006), IFN-γ+ CD8+ T cells (p = 0.0188). c Quantification of the indicated tumor-infiltrating immune cell populations by FACS analysis (n = 8). d IHC analysis for CD4+, CD8+, and PMN-MDSCs (Ly6G). Scale bars, 50 μm. e Tumor volume of WT and Arid1a KO cells subcutaneously injected into immunocompetent mice (FVB or C57BL/6) or Rag1−/− mice. For Myc-CaP in FVB mice, WT or Arid1a KO-1 (n = 6, each group), Arid1a KO-2 (n = 5), WT vs Arid1a KO-1 or KO-2 (p < 0.0001); for Myc-CaP in Rag1−/− mice, n = 5 for each group, WT vs Arid1a KO-1 (p < 0.0001), WT vs Arid1a KO-2 (p = 0.0007); for TKO in C57BL/6 mice, WT or Arid1a KO-1 (n = 6, each group), Arid1a KO-2 (n = 7), WT vs Arid1a KO-1 (p = 0.0004), WT vs Arid1a KO-2 (p = 0.0002); for TKO in Rag1−/− mice, WT or Arid1a KO-2 (n = 7, each group), Arid1a KO-1 (n = 6), WT vs Arid1a KO-1 or KO-2 (p < 0.0001). f Quantitation of the tumor histopathology in isotype- or Ly6G antibody-treated PtenPC−/−; Arid1aPC−/− prostates starting when mice were 10-week-old and treatment was administered for 4 weeks (n = 6). g H&E and IHC staining for SMAα, Ki67, CD8 and Ly6G in mouse prostates with or without anti-Ly6G antibody treatment. Scale bars, 50 μm. b, c, e, Data represent the mean ± SEM. Statistical significance was determined by two-tailed unpaired t-test (b, c), two-way ANOVA followed by multiple comparisons (e) and χ2-test (f). b, d, g Representative data of triplicate experiments are shown. Source data are provided as a Source Data file. *p < 0.05, **p < 0.01, ns, no significance.
Fig. 3
Fig. 3. Hyperactivation of NF-κB in ARID1A-depleted tumors causes the excess recruitment of MDSCs.
a Volcano plots showing the differentially expressed genes (DEGs) between epithelial cells of 3-month-old PtenPC−/−; Arid1aPC−/− versus PtenPC−/−mouse prostates (n = 3). The upregulated and downregulated cytokines and chemokines are indicated. p-value was determined by DEGseq analysis. b IB analysis of the indicated protein in 3-month-old mouse prostates. c IB analysis of WT and ARID1A-depleted C4-2 and Myc-CaP cells treated with TNFα at the indicated time points. d IB analysis in WT and ARID1A-overexpression Myc-CaP cells with or without TNFα stimulation. e Heatmap summarizing the qRT-PCR results in WT and Arid1a KO cells with or without TNFα stimulation. f ELISA of CXCL2 and CXCL3 in serum and prostate tumors of 3-month-old mice (n = 5). g Tumor volume of Myc-CaP expressing sgARID1A or control vector subcutaneously inoculated into FVB mice with or without JSH-23 treatment (WT + DMSO, n = 5; Arid1a KO + DMSO, n = 7; WT/Arid1a KO + JSH-23, n = 6). h Epithelial cells in xenografts (g) were sorted for RNA-Seq and DEGs between WT and Arid1a KO epithelium were shown in heatmap (n = 2). i Migration of PMN-MDSCs recruited by conditional mediums (CMs) with the indicated treatments (n = 3). j, k Mice were inoculated with WT or Arid1a KO Myc-CaP cells and treated with or without SB225002. Tumor volume was monitored (j, WT + DMSO, n = 5; Arid1a KO + DMSO, n = 7; WT/Arid1a KO + JSH-23, n = 6) and quantification of each tumor-infiltrating immune cell population (k, n = 5) were measured by FACS analysis. f, g, ik Data represent the mean ± SEM. Statistical significance was determined by two-tailed unpaired t-test (f, i, k) and two-way ANOVA followed by multiple comparisons (g, j). bd Data were evaluated in triplicate, and representative data are shown. Source data are provided as a Source Data file. ns, no significance.
Fig. 4
Fig. 4. Arid1a ablation silences the enhancer of the A20 gene to stimulate NF-κB signaling.
a Relative expressions of SWI/SNF components in epithelium from 12-week-old PtenPC−/− and PtenPC−/−; Arid1aPC−/− prostates (n = 3). b Heatmap of H3K27ac ChIP-seq in the differentially accessible sites obtained by ATAC-seq on Arid1a loss in Myc-CaP cells (± 2 kb regions centered at the peak summit). PC, peak center. c Heatmap of the ChIP-seq profiles of BRG1 peaks in control and Arid1a KO Myc-CaP cells shown in a horizontal window of ±2 kb from the peak center. d Profile and bar plot of BRG1 binding, H3K27ac modification and ATAC-seq intensities across BRG1 down peaks after Arid1a ablation. e ChIP-seq profiles for BRG1, H3K4me3, H3K4me1 and H3K27ac at the sites reducing BRG1 binding after Arid1a loss. f Venn diagram of the genes showing reduced BRG1 binding, accessibility and expression in Arid1a KO Myc-CaP cells compared to WT cells. g ChIP-seq tracks of BRG1, H3K27ac, H3K4me1, H3K4me3 and ATAC-seq signals in A20 gene loci as indicated. h ChIP-qPCR assays of BRG1, BAF155, ARID1A and ARID1B binding in the A20 enhancer (n = 3), ns, no significance. i IB analysis of the indicated protein in WT and Arid1a KO Myc-CaP cells with or without A20 enhancer activation (CRISPRa/dCas9-based induction) and/or TNFα stimulation. j IB analysis in WT and ARID1A overexpressing Myc-CaP cells with or without A20 enhancer suppression (CRISPRi/dCas9-based suppression) and/or TNFα stimulation. k Tumor volume of the mice inoculated with Myc-CaP expressing sgArid1a and control vector with or without A20 enhancer activation (WT/Arid1a KO + Ctrl-sgRNA and WT + Enhancer-sgRNA, n = 7 for each group; Arid1a KO + Enhancer-sgRNA, n = 5). a, d, h, k Data represent the mean ± SEM. Statistical significance was determined by two-tailed unpaired t-test (a, d, h) and two-way ANOVA followed by multiple comparisons (k). i, j Experiments were repeated three times independently with similar results; data from one representative experiment are shown. ns, no significance. Source data are provided as a Source Data file.
Fig. 5
Fig. 5. IKKβ acts as the convergence point for inflammatory signals to cause ARID1A destruction.
a IB analysis of C4-2 cells treated with TNFα, IL-6 and IFN-γ for the indicated duration of time. b IB analysis of C4-2 cells stimulated with TNFα with or without MG132 treatment for the indicated duration of time. c IB analysis of C4-2 cells transfected with scramble or P50, P52, or P65 oligonucleotides with or without TNFα treatment. d IB analysis of C4-2 cells transfected with scramble or IKKβ and IKKα oligonucleotides with or without TNFα treatment. e IB analysis of the WCL from WT and IKKβ KD C4-2 cells with or without TNFα treatment and anti-ARID1A immunoprecipitates as indicated. f IB analyses of the WCL and anti-ARID1A immunoprecipitates of C4-2 cells. g IB analysis of nuclear extracts from C4-2 cells after gel-filtration fractionation. Cells were treated with 20 ng/ml TNFα for 30 min before harvesting. h IB analysis of the indicated proteins in C4-2 control and IKKβ KD cells with or without IKKβ-WT, IKKβ-SA or IKKβ-SD overexpression. i IB analysis of C4-2 cells treated with IL-1β or c-GAMP for the indicated duration of time. All experiments were repeated three times independently with similar results; data from one representative experiment are shown. Source data are provided as a Source Data file.
Fig. 6
Fig. 6. IKKβ phosphorylates ARID1A and promotes ARID1A destruction via β-TRCP.
a IB analysis of the WCL and immunoprecipitates derived from C4-2 cells treated with TNFα with or without λ-phosphatase or IKKβ oligonucleotides. b In vitro kinase assays indicated that the phosphorylation of IKKβ was required for ARID1A phosphorylation. c Sequence alignment of the putative IKKβ phosphorylation sites and β-TRCP binding motif at S1316 and S1320 of ARID1A. d In vitro kinase assays to examine the phosphorylation of S1316 and S1320 sites in ARID1A by IKKβ. e WT and mutant ARID1A cell lysates were subjected to IP with anti-ARID1A antibody and IB with anti-ubiquitin (anti-Ub) and anti-p-Ser antibody. f IB analysis of WT and mutant ARID1A cells with or without IKKβ-SD overexpression. g, h FVB mice were inoculated with WT or Arid1aMut Myc-CaP cells, and tumor volume (g, n = 5) and quantification of each tumor-infiltrating immune cell population (h, n = 5) were measured by FACS. i IB analysis of the WCL and immunoprecipitates derived from WT and ARID1AMut C4-2 cells treated with or without TNFα. j IB analysis of WT and ARID1AMut C4-2 cells transfected with scramble or β-TRCP oligonucleotides with or without TNFα stimulation. g, h Data represent the mean ± SEM. Statistical significance was determined by two-way ANOVA followed by multiple comparison (g) and two-tailed unpaired t-test (h). a, b, df, i, j Experiments were repeated three times independently with similar results; data from one representative experiment are shown. Source data are provided as a Source Data file.
Fig. 7
Fig. 7. Inhibition of NF-κB signaling sensitizes ARID1A-deficient tumors to ICB therapy.
a Representative IB results of ARID1A, p-IKKβ, p-P65 and A20 expression in the lysates of human prostate tumors. Pearson’s correlations among proteins indicated in PCa specimens are summarized in the heatmap (n = 42; GS > 7). b ELISA of CXCL2 and CXCL3 in PCa (n = 42). c Heatmap summary of the correlations of the indicated signature in PCa (n = 150, GSE21032; n = 266, Prad_SU2C_2019). d IHC analysis for ARID1A, P65, CD15 and CD8 markers. Scale bars, 50 μm. The correlations between ARID1A expression and nuclear P65 intensity and the abundance of CD15+ and CD8+ cells are shown as stacked columns (n = 100). e Volume of tumors derived from WT and ARID1A-overexpressing cells injected subcutaneously into FVB mice and treated with IgG and anti-PD1 antibody (n = 10). f Prostate tumor histology of PtenPC−/−; Arid1aPC−/ mice with or without NF-κB inhibition (JSH-23) in combination with anti-PD1/CTLA-4 treatment (n = 10), Scale bars, 50 μm. g IHC staining for Ki67, CD8 and Ly6G and β-Gal in sections by the indicated treatments. Scale bars, 50 μm. h ARID1A functions downstream of inflammation-induced IKKβ activation to shape the immunosuppressive TME through the regulation of NF-κB-mediated chemotaxis. b and e Data represent the mean ± SEM. Statistical significance was determined by two-tailed Pearson’s correlations test (a and c), two-tailed unpaired t-test (b), two-tailed χ2 (d) and two-way ANOVA followed by multiple comparisons (e). g Experiments were repeated at least three times independently with similar results; data from one representative experiment are shown. Source data are provided as a Source Data file.

References

    1. Rebello RJ, et al. Prostate cancer. Nat. Rev. Dis. Prim. 2021;7:9–10. doi: 10.1038/s41572-020-00243-0. - DOI - PubMed
    1. Robinson D, et al. Integrative clinical genomics of advanced prostate cancer. Cell. 2015;161:1215–1228. doi: 10.1016/j.cell.2015.05.001. - DOI - PMC - PubMed
    1. Wang G, Zhao D, Spring DJ, DePinho RA. Genetics and biology of prostate cancer. Genes Dev. 2018;32:1105–1140. doi: 10.1101/gad.315739.118. - DOI - PMC - PubMed
    1. Wang S, et al. Prostate-specific deletion of the murine Pten tumor suppressor gene leads to metastatic prostate cancer. Cancer Cell. 2003;4:209–221. doi: 10.1016/S1535-6108(03)00215-0. - DOI - PubMed
    1. Chen Z, et al. Crucial role of p53-dependent cellular senescence in suppression of Pten-deficient tumorigenesis. Nature. 2005;436:725–730. doi: 10.1038/nature03918. - DOI - PMC - PubMed

Publication types