. 2022 Nov 27;5(1):1304.
doi: 10.1038/s42003-022-04272-1.

Proteogenomic landscape and clinical characterization of GH-producing pituitary adenomas/somatotroph pituitary neuroendocrine tumors

Affiliations

Proteogenomic landscape and clinical characterization of GH-producing pituitary adenomas/somatotroph pituitary neuroendocrine tumors

Azusa Yamato et al. Commun Biol. .

Abstract

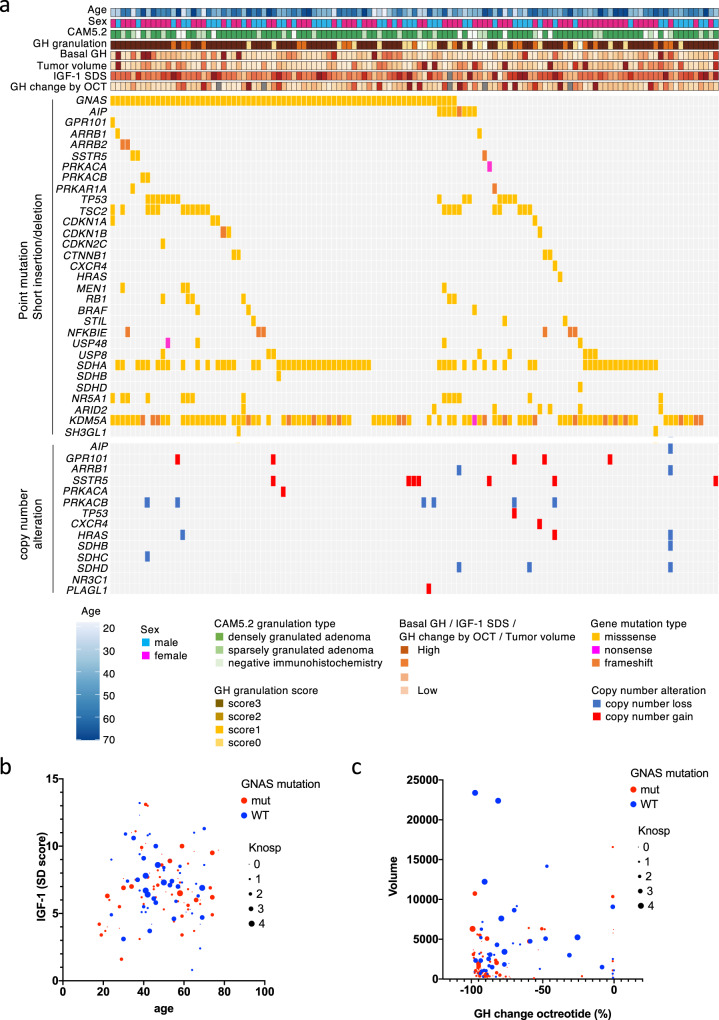
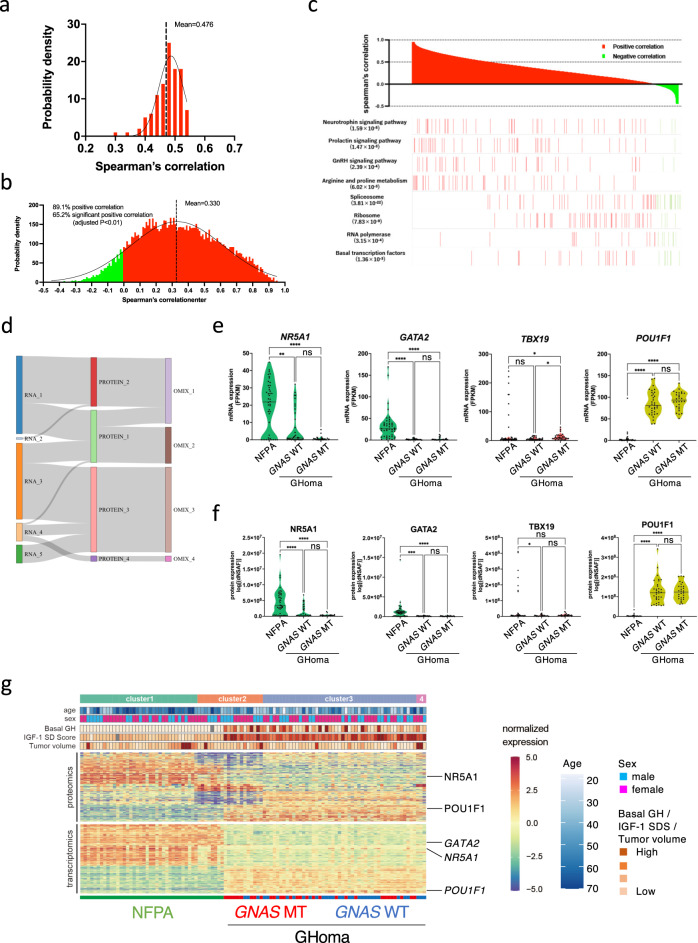
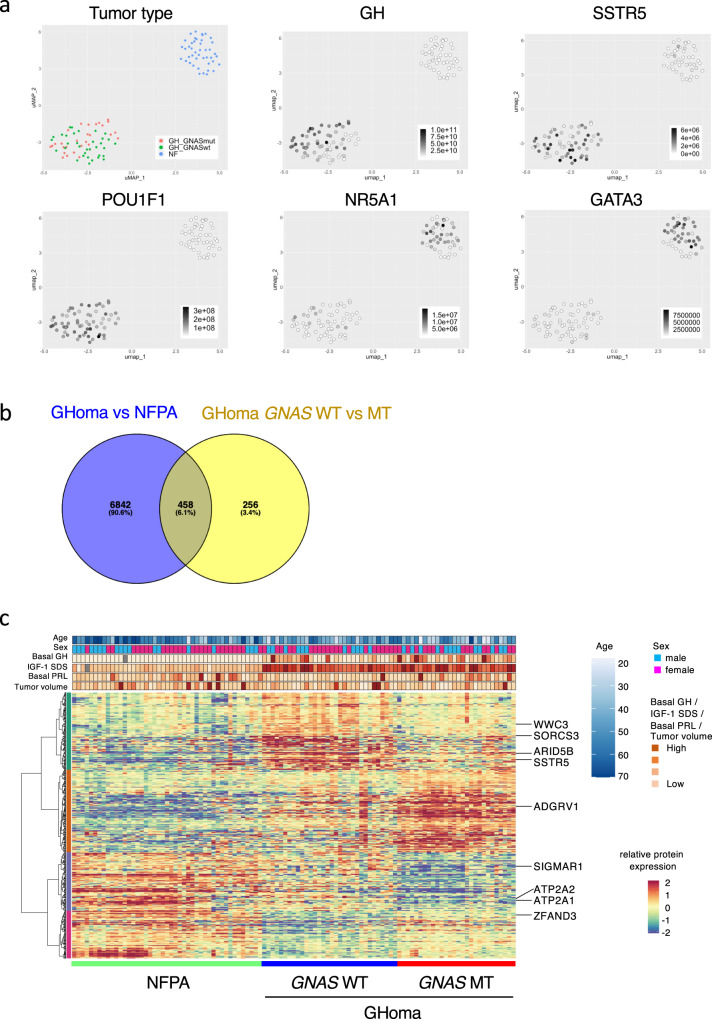
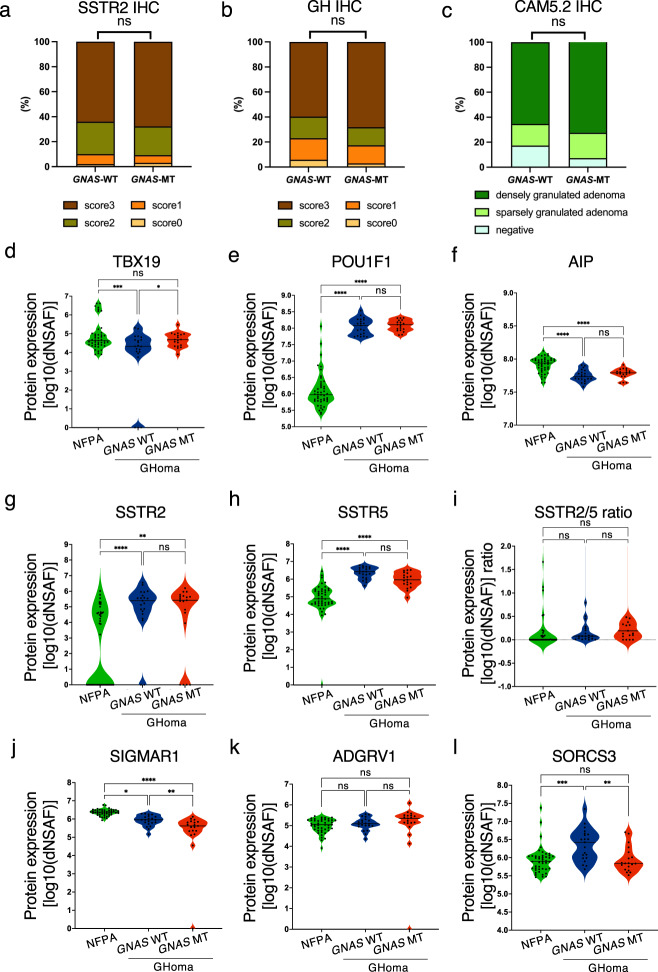
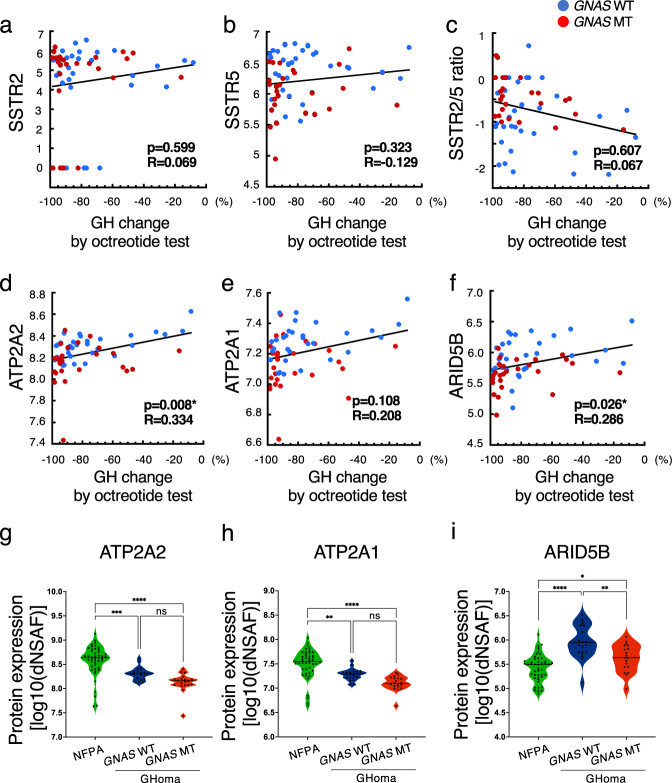
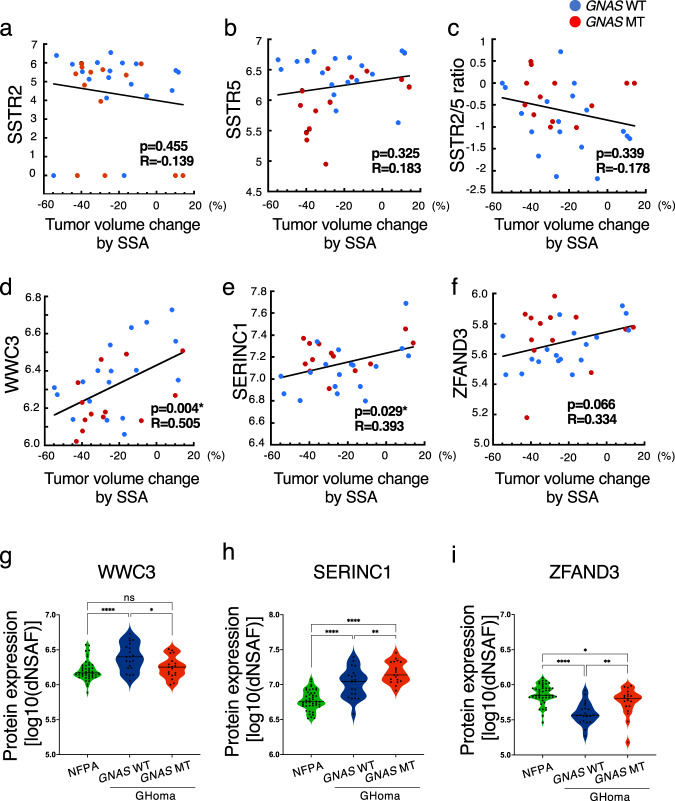
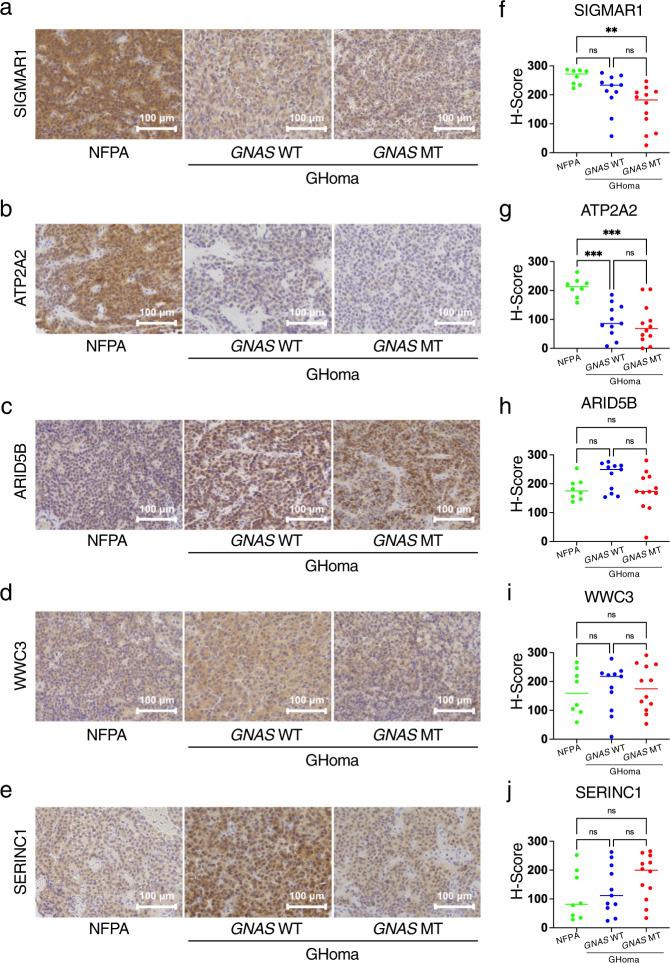
The clinical characteristics of growth hormone (GH)-producing pituitary adenomas/somatotroph pituitary neuroendocrine tumors (GHomas/somatotroph PitNETs) vary across patients. In this study, we aimed to integrate the genetic alterations, protein expression profiles, transcriptomes, and clinical characteristics of GHomas/somatotroph PitNETs to identify molecules associated with acromegaly characteristics. Targeted capture sequencing and copy number analysis of 36 genes and nontargeted proteomics analysis were performed on fresh-frozen samples from 121 sporadic GHomas/somatotroph PitNETs. Targeted capture sequencing revealed GNAS as the only driver gene, as previously reported. Classification by consensus clustering using both RNA sequencing and proteomics revealed many similarities between the proteome and the transcriptome. Gene ontology analysis was performed for differentially expressed proteins between wild-type and mutant GNAS samples identified by nontargeted proteomics and involved in G protein-coupled receptor (GPCR) pathways. The results suggested that GNAS mutations impact endocrinological features in acromegaly through GPCR pathway induction. ATP2A2 and ARID5B correlated with the GH change rate in the octreotide loading test, and WWC3, SERINC1, and ZFAND3 correlated with the tumor volume change rate after somatostatin analog treatment. These results identified a biological connection between GNAS mutations and the clinical and biochemical characteristics of acromegaly, revealing molecules associated with acromegaly that may affect medical treatment efficacy.


Conflict of interest statement

The authors declare no competing interests.

Figures

Fig. 1
Fig. 1. The landscape of gene mutations and CNAs in GHomas/somatotroph PitNETs.
a The landscape of gene mutations and copy number alterations (CNAs) in 121 growth hormone (GH)-producing pituitary adenomas/somatotroph PitNETs obtained by targeted capture sequencing (TCS), together with clinical and pathological annotations. b Bubble plot analysis, with age as the x-axis and the IGF-1 SD score as the y-axis. Blue circles represent GNAS wild-type, and red circles represent GNAS mutations. The circle size is relative to the Knosp grade. c Bubble plot analysis with GH change after octreotide treatment as the x-axis and tumor volume as the y-axis. Blue circles represent wild-type, and red circles represent mutations. The circle size is relative to the Knosp grade.
Fig. 2
Fig. 2. Consensus clustering-based transomics classification of pituitary adenomas/PitNETs.
a Steady-state mRNA and protein abundances were positively correlated with a mean Spearman’s correlation coefficient of 0.476. b mRNA and protein variations were positively correlated for most (89.1%) mRNA-protein pairs and 65.2% of mRNA-protein pairs showed significant correlations, with a mean Spearman’s correlation coefficient of 0.330. Negative correlations are shown in green and positive correlations in red. c mRNA and protein levels displayed dramatically different correlations for genes involved in different biological processes. Red and green indicate positive and negative correlations, respectively. d Results of unsupervised, nonnegative matrix factorization (NMF) subtyping applied to individual data types. The Sankey diagram depicts the flow of cluster assignments. e Violin plot depicting the mRNA expression of NR5A1, GATA2, and TBX19 in NFPA and GHoma. f Violin plot depicting the protein expression of nuclear receptor subfamily 5 group A member 1 (NR5A1), GATA-binding factor 2 (GATA2), and T-box transcription factor 19 (TBX19) in NFPA and GHoma. g Unsupervised multiomics subtyping via NMF identified four molecular subtypes with distinct multiomics expression patterns. NFPA: nonfunctional pituitary adenoma/non-functioning pituitary neuroendocrine tumor (PitNETs), GHoma: GH-producing pituitary adenoma/somatotroph Pituitary neuroendocrine tumor (PitNETs). *p < 0.05, **p < 0.01, ***p < 0.001, ****p < 0.0001 by 1-way ANOVA. n = 44 in NFPA, n = 34 in GHoma with GNAS WT, n = 28 in GHoma with GNAS MT.
Fig. 3
Fig. 3. Nontargeted proteomics analysis of pituitary adenomas/PitNETs.
a Uniform manifold approximation and projection (UMAP) analysis showing the clusters of NFPA and GHoma depending on tumor types: nuclear receptor subfamily 5 group A member 1 (NR5A1), GATA-binding protein 3 (GATA3), POU class 1 homeobox 1 (POU1F1), GH1, and somatostatin receptor 5 (SSTR5) using multiomics data. b Differential expression of proteins derived from nontargeted proteomics was estimated and analyzed with the Brunner–Munzel test. Venn diagram of overlapping differentially expressed molecules. c Heatmap showing differentially expressed molecules identified by proteomics analysis in NFPA and GHoma. NFPA: nonfunctional pituitary adenoma/non-functioning pituitary neuroendocrine tumor (PitNETs), GHoma: GH-producing pituitary adenoma/somatotroph Pituitary neuroendocrine tumor (PitNETs).
Fig. 4
Fig. 4. Protein expression levels in NFPAs/non-functioning PitNETs, GNAS-WT GHomas/somatotroph PitNETs, and GNAS-MT GHomas/somatotroph PitNETs.
Immunohistochemistry scores of (a) somatostatin receptor 2 (SSTR2) and (b) GNAS-WT and GNAS-mutant (MT) growth hormone (GH)-producing pituitary adenomas (%). *p < 0.05, by chi-square test. c CAM5.2 cytokeratin immunostaining pattern in the GNAS-WT and GNAS-MT groups (%). *p < 0.05, by chi-square test. d TBX19, (e) POU class 1 homeobox 1 (POU1F1), (f) aryl hydrocarbon receptor-interacting protein (AIP), (g) SSTR2, (h) SSTR5, (j) sigma nonopioid intracellular receptor-1 (SIGMAR1), (k) adhesion G protein–coupled receptor V1 (ADGRV1), and (l) sortilin-related VPS10 domain–containing receptor 3 (SORCS3) protein expression levels derived from nontargeted proteomics in NFPA, GNAS-WT GHoma and GNAS-MT GHoma. The protein expression values were log (base 10) transformed. i Protein expression ratio of SSTR2 to SSTR5 in NFPA, GNAS-WT GHoma, and GNAS-MT GHoma. NFPA: nonfunctional pituitary adenoma/non-functioning pituitary neuroendocrine tumor (PitNETs), GHoma: GH-producing pituitary adenoma/somatotroph Pituitary neuroendocrine tumor (PitNETs). *p < 0.05, **p < 0.01, ***p < 0.001, ****p < 0.0001 by 1-way ANOVA. n = 45 in NFPA, n = 21 in GHoma with GNAS WT, n = 19 in GHoma with GNAS MT.
Fig. 5
Fig. 5. Correlation between protein expression levels and GH change rates in the octreotide loading test.
Correlations between (a) somatostatin receptor 2 (SSTR2) protein expression, (b) SSTR5 protein expression, (c) the SSTR2/5 ratio, (d) sarcoplasmic/endoplasmic reticulum calcium ATPase 2 (ATP2A2) protein expression, (e) ATP2A1 protein expression, and (f) AT-rich interaction domain 5B (ARID5B) protein expression and growth hormone (GH) change ratio by octreotide loading test (%). Data were analyzed by Pearson’s correlation analysis. g ATP2A2, (h) ATP2A1, and (i) ARID5B protein expression levels in NFPA, GNAS-WT GHoma, and GNAS-mutant (MT) GHoma. All protein expression values were log (base 10) transformed. NFPA: nonfunctional pituitary adenoma/non-functioning pituitary neuroendocrine tumor (PitNETs), GHoma: GH-producing pituitary adenoma/somatotroph Pituitary neuroendocrine tumor (PitNETs). *p < 0.05, **p < 0.01, ***p < 0.001, ****p < 0.0001 by 1-way ANOVA. af n = 34 in GHoma with GNAS WT, n = 26 in GHoma with GNAS MT. gi n = 45 in NFPA, n = 21 in GHoma with GNAS WT, n = 19 in GHoma with GNAS MT.
Fig. 6
Fig. 6. Correlation between protein expression levels and tumor volume change rate in the SSA test.
Correlations between (a) somatostatin receptor 2 (SSTR2) protein expression, (b) SSTR5 protein expression, (c) the SSTR2/5 ratio, (d) WWC family member 3 (WWC3) protein expression, (e) serine incorporator 1 (SERINC1) protein expression, and (f) zinc finger AN1-type containing 3 (ZFAND3) protein expression and the tumor volume change rate in the somatostatin analog (SSA) test (%). Data were analyzed by Pearson’s correlation analysis. g WWC3, (h) SERINC1, and (i) ZFAND3 protein expression levels in NFPA, GNAS-WT GHoma, and GNAS- MT GHoma. All protein expression values were log (base 10) transformed. NFPA: nonfunctional pituitary adenoma/non-functioning pituitary neuroendocrine tumor (PitNETs), GHoma: GH-producing pituitary adenoma/somatotroph Pituitary neuroendocrine tumor (PitNETs). *p < 0.05, **p < 0.01, ****p < 0.0001 by 1-way ANOVA. af n = 18 in GHoma with GNAS WT, n = 13 in GHoma with GNAS MT. gi n = 45 in NFPA, n = 21 in GHoma with GNAS WT, n = 19 in GHoma with GNAS MT.
Fig. 7
Fig. 7. Immunohistochemistry of differentially expressed candidates in nontargeted proteomics.
Sections were stained for (a) sigma nonopioid intracellular receptor-1 (SIGMAR1), (b) sarcoplasmic/endoplasmic reticulum calcium ATPase 2 (ATP2A2), (c) AT-rich interaction domain 5B (ARID5B), (d) WWC family member 3 (WWC3), and (e) serine incorporator 1 (SERINC1). IHC scoring of (f) SIGMAR1, (g) ATP2A2, (h) ARID5B, (i) WWC3 and (j) SERINC1 was performed by modifying McCarty’s H-score. NFPA: nonfunctional pituitary adenoma/non-functioning pituitary neuroendocrine tumor (PitNETs), GHoma: GH-producing pituitary adenoma/somatotroph Pituitary neuroendocrine tumor (PitNETs). **p < 0.01, ***p < 0.001 by 1-way ANOVA. n = 8 in NFPA, n = 11 in GHoma with GNAS WT, n = 12 in GHoma with GNAS MT.

References

    1. Ronchi CL, et al. Landscape of somatic mutations in sporadic GH-secreting pituitary adenomas. Eur. J. Endocrinol./Eur. Federation Endocr. Societies. 2016;174:363–372. - PubMed
    1. Valimaki N, et al. Whole-Genome Sequencing of Growth Hormone (GH)-Secreting Pituitary Adenomas. J. Clin. Endocrinol. Metab. 2015;100:3918–3927. - PubMed
    1. Fougner SL, et al. The clinical response to somatostatin analogues in acromegaly correlates to the somatostatin receptor subtype 2a protein expression of the adenoma. Clin. Endocrinol. 2008;68:458–465. - PubMed
    1. Efstathiadou ZA, et al. Impact of gsp mutations in somatotroph pituitary adenomas on growth hormone response to somatostatin analogs: a meta-analysis. Pituitary. 2015;18:861–867. - PubMed
    1. Preda V, Korbonits M, Cudlip S, Karavitaki N, Grossman AB. Low rate of germline AIP mutations in patients with apparently sporadic pituitary adenomas before the age of 40: a single-centre adult cohort. Eur. J. Endocrinol./Eur. Federation Endocr. Societies. 2014;171:659–666. - PubMed

Publication types

MeSH terms