. 2022 Nov 26;5(1):1298.
doi: 10.1038/s42003-022-04271-2.

Fission yeast Dis1 is an unconventional TOG/XMAP215 that induces microtubule catastrophe to drive chromosome pulling

Affiliations

Fission yeast Dis1 is an unconventional TOG/XMAP215 that induces microtubule catastrophe to drive chromosome pulling

Yuichi Murase et al. Commun Biol. .

Abstract

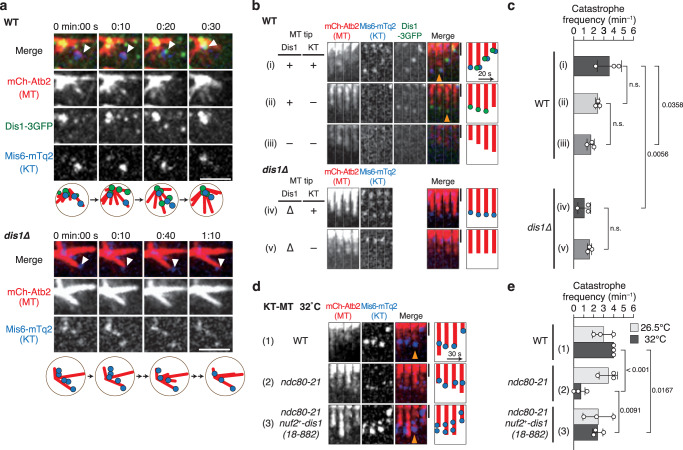
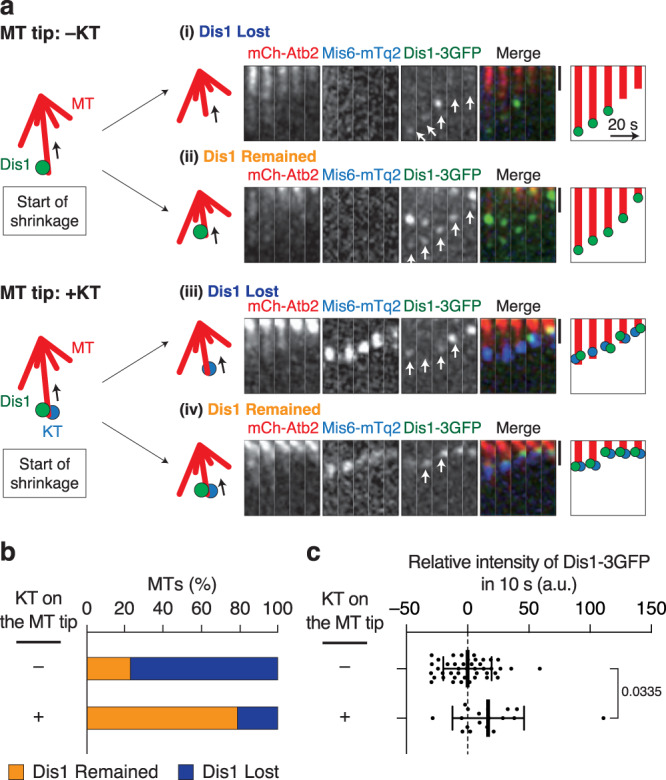
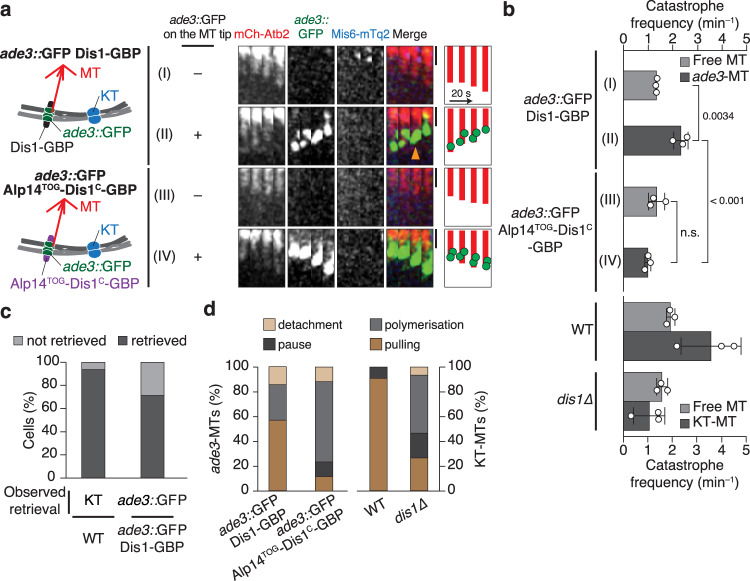
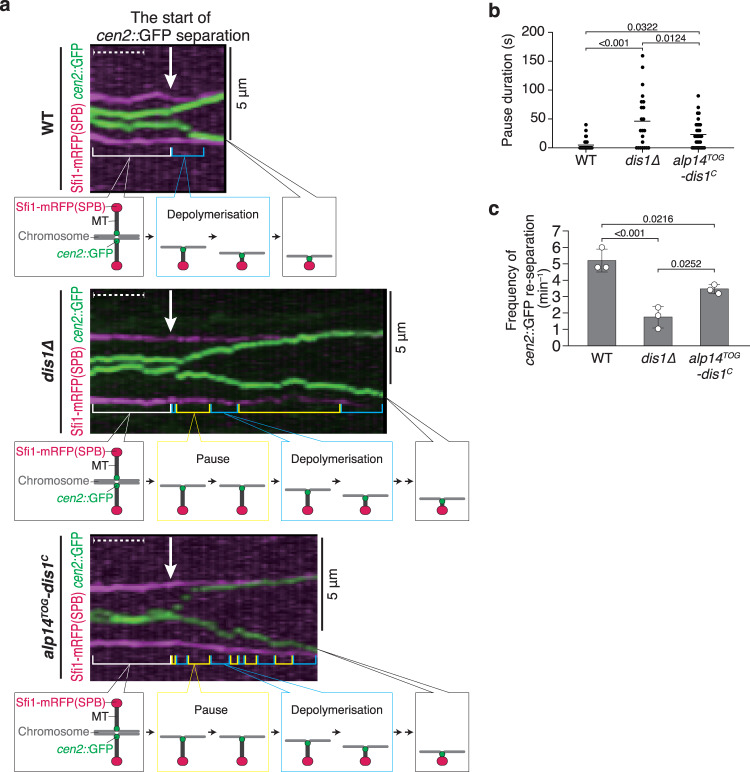
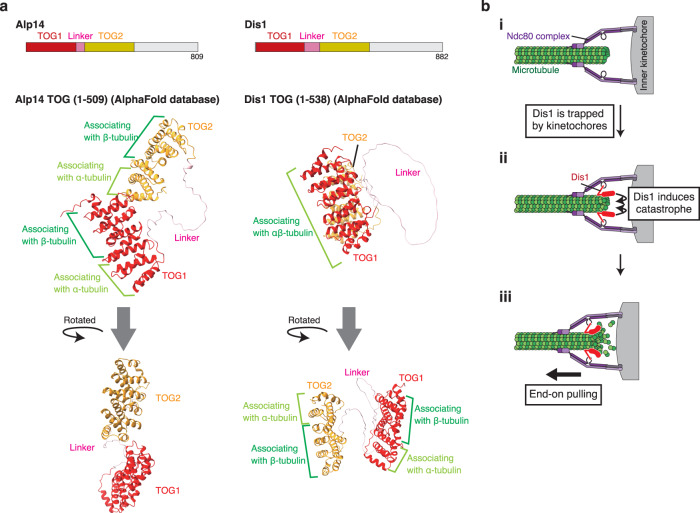
The shortening of microtubules attached to kinetochores is the driving force of chromosome movement during cell division. Specific kinesins are believed to shorten microtubules but are dispensable for viability in yeast, implying the existence of additional factors responsible for microtubule shortening. Here, we demonstrate that Dis1, a TOG/XMAP215 ortholog in fission yeast, promotes microtubule shortening to carry chromosomes. Although TOG/XMAP215 orthologs are generally accepted as microtubule polymerases, Dis1 promoted microtubule catastrophe in vitro and in vivo. Notably, microtubule catastrophe was promoted when the tip was attached to kinetochores, as they steadily anchored Dis1 at the kinetochore-microtubule interface. Engineered Dis1 oligomers artificially tethered at a chromosome arm region induced the shortening of microtubules in contact, frequently pulling the chromosome arm towards spindle poles. This effect was not brought by oligomerised Alp14. Thus, unlike Alp14 and other TOG/XMAP215 orthologs, Dis1 plays an unconventional role in promoting microtubule catastrophe, thereby driving chromosome movement.


Conflict of interest statement

The authors declare no competing interests.

Figures

Fig. 1
Fig. 1. Dis1 promotes microtubule dynamics in vitro, including induction of catastrophes causing microtubules to shorten.
a Experimental outline-purified tubulin (20 µM) with Alexa488-labelled tubulins (2 µM) and 0, 85, and 170 nM of recombinant GST-Dis1 were mixed and incubated at 37 °C for 5 min, followed by observation using a confocal microscope. b Observed microtubules with and without GST-Dis1. c Lengths of microtubules shown in (b) were plotted. Box-and-whisker plots indicate the minimum and maximum values and the 25th and 75th percentiles. Bullets indicate outliers; crosses represent means; centre lines represent medians; n = 156 (0 nM), 197 (85 nM), 152 (170 nM) microtubules. d Experimental outline- purified tubulin (35 µM) with Alexa488-labelled tubulin (3 µM) was incubated at 37 °C for 10 min. GST-Dis1 was then added and observed at 5-s intervals for 5 min using the fluorescent microscope. e Representative kymographs for Alexa488-labelled microtubules with indicated concentrations of GST-Dis1. Arrowheads represent the timing of microtubule catastrophes. fi Growth (f), shrinkage rates (g), catastrophe (h), and rescue (i) frequencies were calculated. Crosses, the mean; bullets, technical replicates: n = 4 (0 nM), 4 (50 nM), 4 (100 nM), 4 (200 nM) experiments. At least 15 microtubules were observed for each experiment. Error bars; SD. The statistical significance of the difference was determined using one-way ANOVA followed by the Tukey–Kramer method. P values are shown; n.s. not significant.
Fig. 2
Fig. 2. Dis1 induces microtubule catastrophe at the onset of meiosis I.
a Time-lapse images of zygotic nuclei at the onset of meiosis I in wild-type (WT) and dis1∆ mutant cells at room temperature. Dis1-3GFP (green) co-localises with kinetochores (KT; labelled with Mis6-mTurquoise2, blue) at microtubule tips (MT; mCherry-Atb2, red). The kinetochore-bound microtubule tip (arrowhead) started shortening at 0:20. Schematics are shown at the bottom. In dis1∆, microtubules attached a kinetochore (arrowhead) but were not shortened. Scale bar, 2 µm. b Representative kymographs of microtubules classified by the state of the tips, shown with schematics. In WT, (i) tips with both kinetochores and Dis1; (ii) tips without kinetochores but with Dis1; (iii) tips without kinetochores or Dis1. In dis1∆, with (iv) and without (v) kinetochores. The microtubules in (iv) are also shown in (a). Orange arrowheads represent microtubule catastrophes. Scale bar, 1 µm. c The catastrophe frequency for each category in (b); n = 3 (i), 3 (ii), 3 (iii), 3 (iv), 3 (v) experiments. d Representative kymographs for kinetochore-microtubules in (1) WT, (2) ndc80-21 and (3) ndc80-21 nuf2+-dis1(18-882) cells at the onset of meiosis I at 32 °C. Orange arrowheads represent microtubule catastrophe. Scale bar, 1 µm. e The catastrophe frequency for each state is shown in (d); n = 3 experiments for each sample. Bullets indicate technical replicates, and error bars indicate SD. The statistical significance of the difference was determined using one-way ANOVA followed by the Tukey–Kramer method. P values are shown; n.s. not significant.
Fig. 3
Fig. 3. Kinetochore extends the duration of Dis1 location at the microtubule tip.
a The fluorescence intensity of Dis1-3GFP localised at the tips of shrinking microtubules was measured in WT cells. Observed microtubules were classified into two groups: tips with Dis1-3GFP only (−KT) and tips with both Dis1-3GFP and kinetochores (+KT). Each group of microtubule tips was then observed over time to monitor the instability of Dis1-3GFP localisation at the tips: whether Dis1-3GFP was lost or decreased (‘Dis1 Lost’, i and iii), and alternatively, remained or increased (‘Dis1 remained’, ii and iv) during shrinkage. Representative kymographs and schematics are also shown. White arrows indicate tips of shrinking microtubules where the Dis1-3GFP intensity was measured. The microtubules in which the fluorescence intensities of Dis1-3GFP were lower than the initial value were classified as ‘Dis1 Lost’, and the rest was classified as microtubules with ‘Dis1 Remained’. b The rate of each event shown in (a) was quantified. n = 22 (−KT), 14 (+KT) microtubules. Dis1 was maintained at the end of microtubules when colocalised with kinetochore according to χ2 two-sample test (χ2 = 11, P < 0.005). c Fluctuation of Dis1-3GFP fluorescence intensity at the tip during shrinkage. The Dis1-3GFP intensity was measured at two time points of a 10-s interval, and the relative intensity of the second time point to the first was plotted. A plot above 0 means an increase of Dis1-3GFP in 10 s. Bold lines means; error bars, SD; n = 43 (−KT), 18 (+KT) observations. The statistical significance of the difference was determined using Student’s two-tailed t-test; the P value is shown.
Fig. 4
Fig. 4. End-on pulling of chromosomes by Dis1 oligomers without using kinetochores.
a Schematic representation of the artificial pulling of chromosomes without relying on kinetochores. Oligomers of Dis1-GBP or the chimaera Alp14TOG-Dis1C-GBP were artificially clustered at the ade3 locus marked with GFP (ade3::GFP, green) on a chromosome arm. Time-lapse images of microtubules without (I and III) or with (II and IV) the ade3::GFP locus were filmed at room temperature, and representative kymographs are shown. As a reference, the position of kinetochores (Mis6-mTq2, blue) is shown. The orange arrowhead indicates the start of the microtubule catastrophe. Scale bar, 1 µm. b The catastrophe frequency was measured for each category in (a). Free MT, tips without kinetochores; ade3-MT, tips with ade3::GFP. The data for WT and Dis1 are reprised from previous data as references: the data for ‘free MT’ in WT are derived from Fig. 2c (ii and iii). Other data for WT and dis1∆ are reprises of Fig. 2c (i, iv and v). Bullets indicate technical replicates (n = 3 experiments); error bars, SD. The statistical significance of the difference was determined using one-way ANOVA followed by the Tukey–Kramer method. P values are shown; n.s., not significant. c Percentages of cells that accomplished retrieval of kinetochores to SPBs in WT meiocytes (WT, n = 16) or retrieval of the ade3::GFP locus in ade3::GFP Dis1-GBP meiocytes (n = 28). χ2 = 3.1 (two-sample test), P > 0.05. d Frequencies of 4 events (polymerisation, pulling, pause and detachment) observed in microtubule tips accompanied by the ade3::GFP locus or kinetochores. n = 11 (WT), 15 (dis1∆), 14 (ade3::GFP Dis1-GBP), 17 (ade3::GFP Alp14TOG-Dis1C-GBP) microtubules.
Fig. 5
Fig. 5. Dis1 drives kinetochore motion during Anaphase A in mitosis.
a Representative kymographs depicting the distribution of sister centromeres of chromosome II labelled with GFP (cen2::GFP, green) in WT, dis1∆ and alp14TOG-dis1C cells during anaphase A of mitosis at room temperature. Spindle poles (SPBs) were visualised with Sfi1-mRFP (magenta). Arrows represent the timing when cen2::GFP signals started to separate. Blue brackets denote the shortening of the distance between an SPB and cen2::GFP, and yellow brackets denote the pause of the cen2::GFP signal. Dashed lines correspond to 1 min. b Pause duration of cen2::GFP in Anaphase A of each strain was plotted. n = 33 (WT), 22 (dis1∆), 32 (alp14TOG-dis1C) centromeres. Lines represent means. c The frequency of cen2::GFP re-separation after a pause was calculated. Bullets indicate technical replicates (n = 3 experiments); error bars, SD. The statistical significance of the difference was determined using one-way ANOVA followed by the Tukey–Kramer method. P values are shown; n.s. not significant.
Fig. 6
Fig. 6. Comparison of the predicted structures of TOG domains between Alp14 and Dis1.
a Predicted structures of the TOG domain of Alp14 (1–509 a.a.) and that of Dis1 (1–538 a.a.) were referred to the AlphaFold database (https://alphafold.ebi.ac.uk/). Domains for TOG1, linker and TOG2 are shown in red, pink and yellow, respectively, using ChimeraX v.1.2.5. (UCSF). The style of association between tubulin dimers and each TOG was adapted from a previous study on Alp14 crystallography. b Possible schemes representing kinetochore retrieval by Dis1. First, the kinetochore attaches to the microtubule, which does not actively promote catastrophe (i). Upon reaching the microtubule tip, Dis1 is trapped by kinetochores and induces catastrophe (ii), which triggers microtubule shrinkage, thereby retrieving the kinetochore (iii).

Similar articles

Cited by

References

    1. Walczak CE, Heald R. Mechanisms of mitotic spindle assembly and function. Int. Rev. Cytol. 2008;265:111–158. doi: 10.1016/S0074-7696(07)65003-7. - DOI - PubMed
    1. Asbury CL. Anaphase a: disassembling microtubules move chromosomes toward spindle poles. Biology. 2017;6:15. doi: 10.3390/biology6010015. - DOI - PMC - PubMed
    1. Mitchison T, Kirschner M. Dynamic instability of microtubule growth. Nature. 1984;312:237–242. doi: 10.1038/312237a0. - DOI - PubMed
    1. Horio T, Hotani H. Visualization of the dynamic instability of individual microtubules by dark-field microscopy. Nature. 1986;321:605–607. doi: 10.1038/321605a0. - DOI - PubMed
    1. Desai A, Verma S, Mitchison TJ, Walczak CE. Kin I kinesins are microtubule-destabilizing enzymes. Cell. 1999;96:69–78. doi: 10.1016/S0092-8674(00)80960-5. - DOI - PubMed

Publication types

MeSH terms

Substances

LinkOut - more resources