. 2023 Jan-Mar;71(1):103362.
doi: 10.1016/j.retram.2022.103362. Epub 2022 Aug 11.

APOE ε4 and Alzheimer's disease diagnosis associated differences in L-carnitine, GBB, TMAO, and acylcarnitines in blood and brain

Affiliations

APOE ε4 and Alzheimer's disease diagnosis associated differences in L-carnitine, GBB, TMAO, and acylcarnitines in blood and brain

Claire J C Huguenard et al. Curr Res Transl Med. 2023 Jan-Mar.

Abstract

Background: The apolipoprotein E (APOE) ε4 allele, involved in fatty acid (FA) metabolism, is a major genetic risk factor for Alzheimer's disease (AD). This study examined the influence of APOE genotypes on blood and brain markers of the L-carnitine system, necessary for fatty acid oxidation (FAO), and their collective influence on the clinical and pathological outcomes of AD.

Methods: L-carnitine, its metabolites γ-butyrobetaine (GBB) and trimethylamine-n-oxide (TMAO), and its esters (acylcarnitines) were analyzed in blood from predominantly White community/clinic-based individuals (n = 372) and in plasma and brain from the Religious Order Study (ROS) (n = 79) using liquid chromatography tandem mass spectrometry (LC-MS/MS).

Findings: Relative to total blood acylcarnitines, levels of short chain acylcarnitines (SCAs) were higher whereas long chain acylcarnitines (LCAs) were lower in AD, which was observed pre-clinically in APOE ε4s. Plasma medium chain acylcarnitines (MCAs) were higher amongst cognitively healthy APOE ε2 carriers relative to other genotypes. Compared to their respective controls, elevated TMAO and lower L-carnitine and GBB were associated with AD clinical diagnosis and these differences were detected preclinically among APOE ε4 carriers. Plasma and brain GBB, TMAO, and acylcarnitines were also associated with post-mortem brain amyloid, tau, and cerebrovascular pathologies.

Interpretation: Alterations in blood L-carnitine, GBB, TMAO, and acylcarnitines occur early in clinical AD progression and are influenced by APOE genotype. These changes correlate with post-mortem brain AD and cerebrovascular pathologies. Additional studies are required to better understand the role of the FAO disturbances in AD.

Keywords: APOE; Acylcarnitines; Alzheimer's disease; L-carnitine; Lipidomics; TMAO, GBB.


Conflict of interest statement

Declaration of Competing Interest The authors declare no competing interests.

Figures

Figure 1.
Figure 1.. Schematic illustration of mitochondrial acylcarnitine metabolism.
First, LCFAs are activated with a -CoA group on the outer mitochondrial membrane before their trans-esterification to LCAs by CPT1, which releases a free CoA and uses an L-carnitine. These LCAs are then able to enter the mitochondrion through CACT in exchange for L-carnitine. Once in the mitochondrial matrix LCAs are trans-esterified back to LCFA-CoAs by CPT2 using one CoA and releasing one L-carnitine. These LCAs can then undergo β-oxidation in the mitochondrion. Shorter chain FAs can directly enter the mitochondrion and be activated with a CoA before undergoing β-oxidation. Each round of β-oxidation yields an acetyl-CoA. Incomplete β-oxidation leads to intra-mitochondrial build-up of acyl-CoA groups. This results in reverse transport of excess acyl- groups to the cytosol and blood. This happens by the trans-esterification of excess intra-mitochondrial acyl-CoAs to their corresponding acylcarnitines by either CPT2 or CAT (depending on chain length). Acylcarnitines can then exit the mitochondrion through CACT. Abbreviations: FABP: fatty acid binding protein, CD36: fatty acid translocase, LCFA: long chain fatty acid (C13–21), LACS: long chain fatty acyl-CoA ligase, LCFA-CoA: long chain fatty acyl-CoA, CPT1/2: carnitine palmitoyltransferase 1/2, CACT: Carnitine acylcarnitine translocase, SCFA: short chain fatty acid (C2–5), MCFA: medium chain fatty acid (C6–12), SCAS: short chain fatty acyl-CoA ligase, MCAS: medium chain fatty acyl-CoA ligase, SCFA-CoA: short chain fatty acyl-CoA, MCFA-CoA: medium chain fatty acyl-CoA, CAT: carnitine acetyltransferase, SCA: short chain acylcarnitine, MCA: medium chain acylcarnitine, LCA: long chain acylcarnitine, PDH: pyruvate dehydrogenase.
Figure 2.
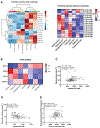
Figure 2.. Decreases in plasma and serum LCAs, L-carnitine, GBB, and increase in SCAs and TMAO with AD cognitive progression and APOE ε4 carrier status.
A Heatmaps showing species ratios most strongly associated with cognitive diagnoses stratified by APOE ε4 carrier status. B Z-score heatmap showing acylcarnitine chain length ratios with cognitive diagnoses stratified by APOE ε4 carrier status. C Dot plot showing the mean ratio of TMAO to L-carnitine ± 95% CI with cognitive diagnoses stratified by ε4 carrier status. Numbers per group: E4− Control n= 183, E4+ Control n= 112, E4− Pre-MCI/AD + MCI n= 30, E4+ Pre-MCI/AD + MCI n= 26, E4− AD n= 8, E4+ AD n= 13. Abbreviations; AD: Alzheimer’s disease, MCI: mild cognitive impairment, TMAO: trimethylamine-n-oxide, GBB: γ-butyrobetaine, Cx:y-CAR: acylcarnitines, Cx:y-OH-CAR: hydroxy acylcarnitines, SCA: short chain acylcarnitines, MCA: medium chain acylcarnitines, LCA: long chain acylcarnitines, VLCA: very long chain acylcarnitines. Statistics: For the clustering heatmap data was normalized and scaled before being analyzed with the Ward’s clustering method, top analytes were selected by ANOVA.
Figure 3.
Figure 3.. Decreases in plasma LCAs and increases in SCAs with AD cognitive progression and APOE genotype.
A Heatmaps showing species ratios most strongly associated with cognitive diagnoses stratified by APOE genotype. B Z-score heatmap showing acylcarnitine chain length ratios with cognitive diagnoses stratified by APOE genotype. C Scatter plot with linear regression showing blood glucose plotted against plasma SCA levels. D Scatter plot with linear regression showing blood HDL cholesterol plotted against plasma OCA levels. E Scatter plot with linear regression showing blood total cholesterol to HDL cholesterol ratio plotted against plasma L-carnitine levels. Numbers per group: E2/E3 Control n= 10, E3/E3 Control n=12, E3/E4+E4/E4 Control n= 11, E3/E3 MCI n= 12, E2/E3 AD n= 10, E3/E3 AD n= 10, E3/E3 AD n= 12, E3/E4+E4/E4 AD n=12. Abbreviations; AD: Alzheimer’s disease, MCI: mild cognitive impairment, TMAO: trimethylamine-n-oxide, GBB: γ-butyrobetaine, Cx:y-CAR: acylcarnitines, Cx:y-OH-CAR: hydroxy acylcarnitines, SCA: short chain acylcarnitines, OCA: odd chain acylcarnitines, MCA: medium chain acylcarnitines, LCA: long chain acylcarnitines, VLCA: very long chain acylcarnitines, HDL: high density lipoprotein, Corr. coef.: correlation coefficient, Sig.: significance. Statistics: For the clustering heatmap data was normalized and scaled before being analyzed with the Ward’s clustering method, top analytes were selected by ANOVA. Correlations analyses were performed using Kendall’s tau-b.
Figure 4.
Figure 4.. Examination of plasma L-carnitine, TMAO, GBB and acylcarnitines associations with brain pathology in different APOE genotypes.
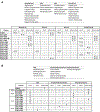
A Amyloid load was measured in nine brain regions, DPs in four brain regions, NPs in five brain regions, and tau (NFTs) in eight brain regions. Significant correlations are shown between plasma acylcarnitines and AD pathology in different brain regions.The number of brain regions found correlated with each plasma species is indicated in parentheses. The arrowheads “▲” indicates a positive and “▼” a negative correlation. B The CAA pathology was evaluated in four neocortical regions, for cerebral atherosclerosis large vessels of the circle of Willis (and their proximal branches) were inspected, for arteriolosclerosis small vessels of the basal ganglia were examined. Significant correlations are shown between plasma acylcarnitines and cerebrovascular pathologies. The direction of correlations are shown by arrows (as described above). Numbers per group: ε2/ε3 n= 20, ε3/ε3 n= 36, ε3/ε4+ε4/ε4 n= 23. Abbreviations; TMAO: trimethylamine-n-oxide, Cx:y-CAR: acylcarnitines, Cx:y-OH-CAR: hydroxy acylcarnitines, SCA: short chain acylcarnitines, MCA: medium chain acylcarnitines, LCA: long chain acylcarnitines, VLCA: very long chain acylcarnitines, DPs: diffuse plaques, NPs: neuritic plaques, NFTs: neurofibrillary tangles, CAA: cerebral amyloid angiopathy. Statistics: correlations analyses were performed using Kendall’s tau-b.
Figure 5.
Figure 5.. Increases in brain SCAs accompanied by decreases in brain LCAs in MCI.
A Heatmaps of analyte ratios most strongly associated with cognitive diagnoses stratified by APOE genotype. B Z-score heatmap showing acylcarnitine chain length ratios with cognitive diagnoses stratified by APOE genotype. Numbers per group: E2/E3 Control n= 10, E3/E3 Control n=12, E3/E4+E4/E4 Control n= 11, E3/E3 MCI n= 12, E2/E3 AD n= 10, E3/E3 AD n= 10, E3/E3 AD n= 12, E3/E4+E4/E4 AD n=12. Abbreviations; AD: Alzheimer’s disease, MCI: mild cognitive impairment, GBB: γ-butyrobetaine, Cx:y-CAR: acylcarnitines, Cx:y-OH-CAR: hydroxy acylcarnitines, SCA: short chain acylcarnitines, MCA: medium chain acylcarnitines, LCA: long chain acylcarnitines, VLCA: very long chain acylcarnitines. Statistics: For the clustering heatmap data was normalized and scaled before being analyzed with the Ward’s clustering method, top analytes were selected by ANOVA.
Figure 6.
Figure 6.. Examination of inferior orbital cortex L-carnitine, TMAO, GBB, and acylcarnitines associations with brain pathology in different APOE genotypes.
Amyloid load was measured in nine brain regions, DPs in four brain regions, NPs in five brain regions, and tau (NFTs) in eight brain regions. This table shows significant correlations between acylcarnitine levels in the inferior orbital cortex and AD pathology in different brain regions.The number of brain regions found correlated with each acylcarnitine species is indicated in parentheses. The arrowheads “▲” indicates a positive and “▼” a negative correlation. B The CAA pathology was evaluated in four neocortical regions, for cerebral atherosclerosis large vessels of the circle of Willis (and their proximal branches) were inspected, for arteriolosclerosis small vessels of the basal ganglia were examined. This table shows significant correlations between acylcarnitine levels in the inferior orbital cortex and cerebrovascular pathologies. The direction of correlations are shown by arrows (as described above). Numbers per group: ε2/ε3 n= 20, ε3/ε3 n= 36, ε3/ε4+ε4/ε4 n= 23. Abbreviations; TMAO: trimethylamine-n-oxide, GBB: γ-butyrobetaine, Cx:y-CAR: acylcarnitines, Cx:y-OH-CAR: hydroxy acylcarnitines, SCA: short chain acylcarnitines, MCA: medium chain acylcarnitines, LCA: long chain acylcarnitines, VLCA: very long chain acylcarnitines, DPs: diffuse plaques, NPs: neuritic plaques, NFTs: neurofibrillary tangles, CAA: cerebral amyloid angiopathy. Statistics: correlations analyses were performed using Kendall’s tau-b.
Figure 7.
Figure 7.. Summary of findings.
Aging-related bioenergetics disturbances, such as brain glucose hypometabolism, are exacerbated by the APOE ε4 allele and AD. These bioenergetics disturbances lead to alterations in the L-carnitine system involved in FAO. Here, we found a pattern of changes in blood acylcarnitine ratios with AD clinical progression which was further mediated by the APOE ε4 allele and female sex. Specifically, decreases in L-carnitine, OCA, LCA, VLCA and increases in SCAs and TMAO ratios (to total acylcarnitines) in the periphery. These suggest changes in fuel use with disturbances in FAO in cognitively impaired individuals, particularly APOE ε4 carriers and females. Plasma SCA levels were also positively correlated with blood glucose levels, indicating a possible link between glucose impairments and FAO dysfunction. Plasma TMAO and acylcarnitine levels were also predictive of cerebrovascular pathology, whereas brain GBB and acylcarnitine levels were correlated with amyloid and tau pathologies in an APOE genotype-dependent manner. Positive correlations are indicated in red and negative correlations in blue in the summary of results tables. Abbreviations; AD: Alzheimer’s Disease, TMAO: trimethylamine-n-oxide, GBB: γ-butyrobetaine, C2:0-CoA: acetyl-CoA, SCFA-CoA: short chain fatty acyl-CoA, SCA: short chain acylcarnitines, OCFA-CoA: odd chain fatty acyl-CoA, OCA: odd chain acylcarnitines, MCFA-CoA: medium chain fatty acyl-CoA, MCA: medium chain acylcarnitines, LCFA-CoA: long chain fatty acyl-CoA, LCA: long chain acylcarnitines, VLCFA-CoA: very long chain fatty acyl-CoA, VLCA: very long chain acylcarnitines, FAO: fatty acid oxidation, AA: amino acid, CAA: cerebral amyloid angiopathy, AtSc: Arteriolosclerosis, CA: cerebral atherosclerosis, Aβ: amyloid beta.

References

    1. Masters CL, Bateman R, Blennow K, Rowe CC, Sperling RA, Cummings JL. Alzheimer’s disease. Nat Rev Dis Prim [Internet]. 2015;1:1–18. Available from: 10.1038/nrdp.2015.56 - DOI - PubMed
    1. Bertram Lars, Lill Christina M., McQueen Matthew B., Roehr Johannes T., Brit-Maren M Schjeide LMS. AlzGene [Internet]. 2010. [cited 2022 Mar 21]. Available from: http://www.alzgene.org/meta.asp?geneID=83
    1. Belloy ME, Napolioni V, Greicius MD. A Quarter Century of APOE and Alzheimer’s Disease: Progress to Date and the Path Forward [Internet]. Vol. 101, Neuron. 2019. [cited 2020 Jun 17]. p. 820–38. Available from: 10.1016/j.neuron.2019.01.056 - DOI - PMC - PubMed
    1. Sweigart B, Andersen SL, Gurinovich A, Cosentino S, Schupf N, Perls TT, et al. APOE E2/E2 Is Associated with Slower Rate of Cognitive Decline with Age. J Alzheimer’s Dis. 2021;83:853–60. - PMC - PubMed
    1. Shinohara M, Kanekiyo T, Tachibana M, Kurti A, Shinohara M, Fu Y, et al. Apoe2 is associated with longevity independent of alzheimer’s disease. Elife. 2020;9:1–16. - PMC - PubMed

Publication types