. 2023 Jan;299(1):102748.
doi: 10.1016/j.jbc.2022.102748. Epub 2022 Nov 24.

Glucose transporter GLUT1 expression is important for oriental river prawn (Macrobrachium nipponense) hemocyte adaptation to hypoxic conditions

Affiliations

Glucose transporter GLUT1 expression is important for oriental river prawn (Macrobrachium nipponense) hemocyte adaptation to hypoxic conditions

Xichao Sun et al. J Biol Chem. 2023 Jan.

Abstract

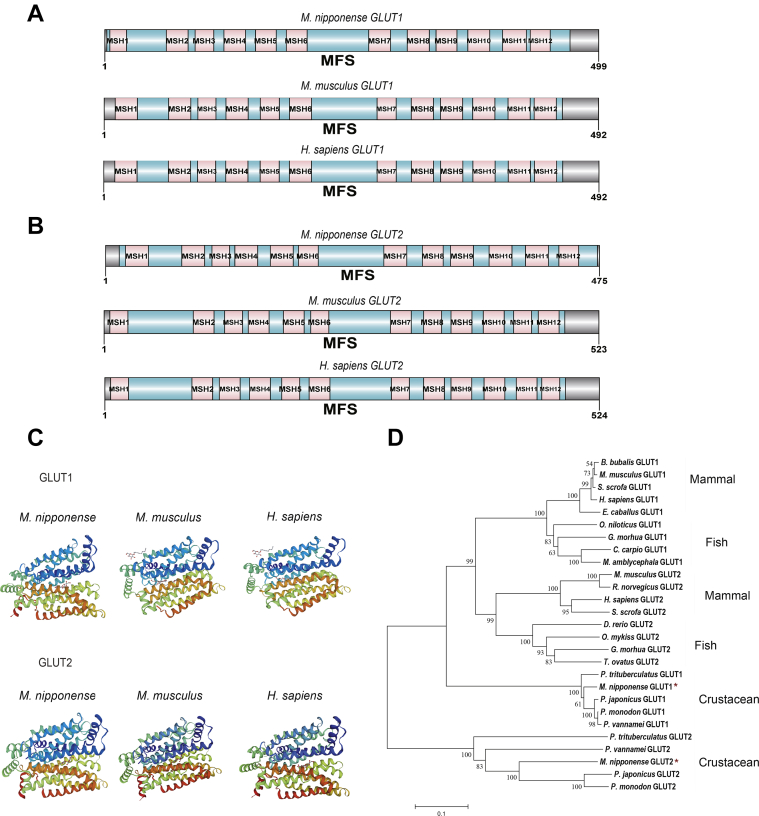
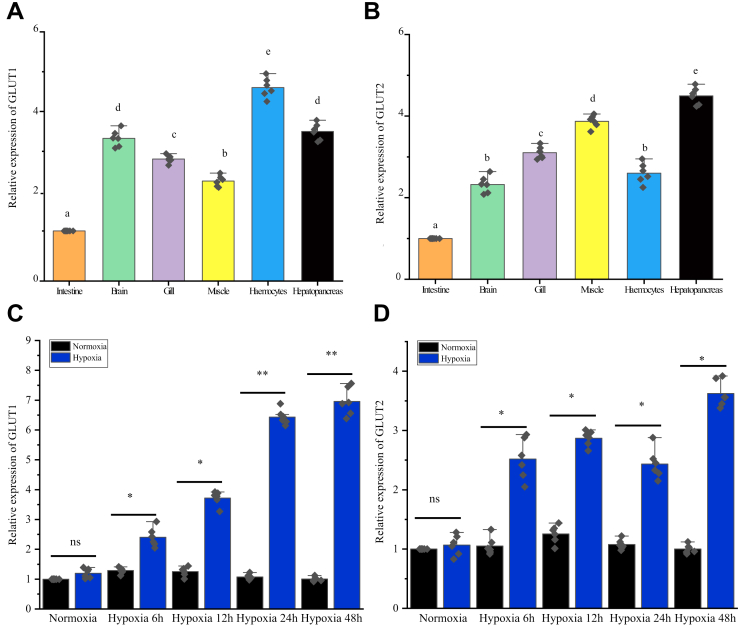
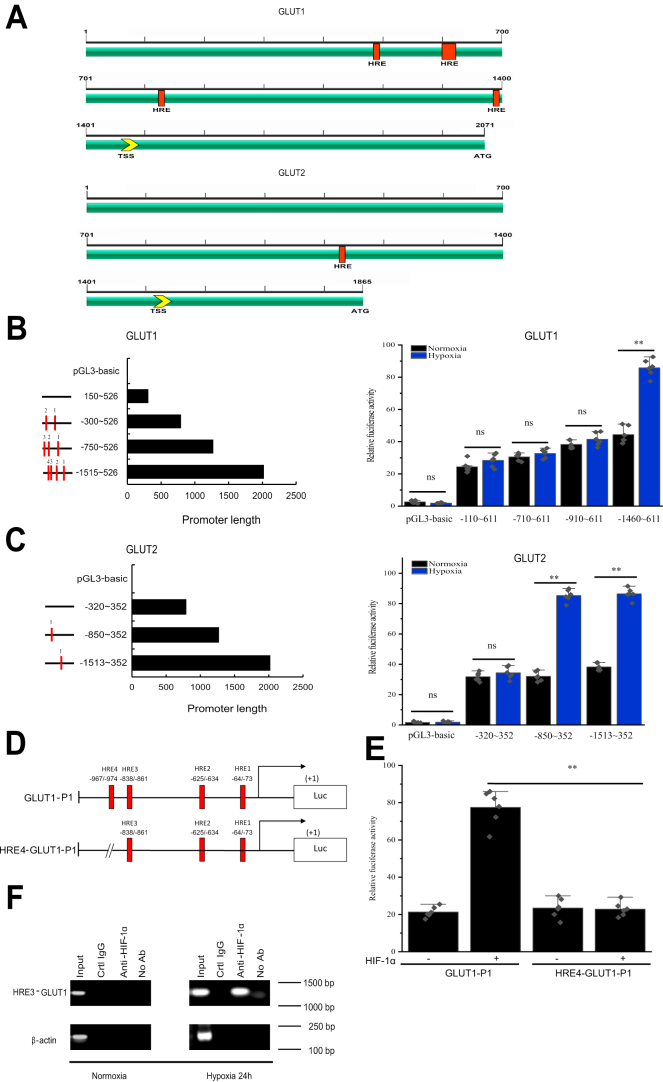
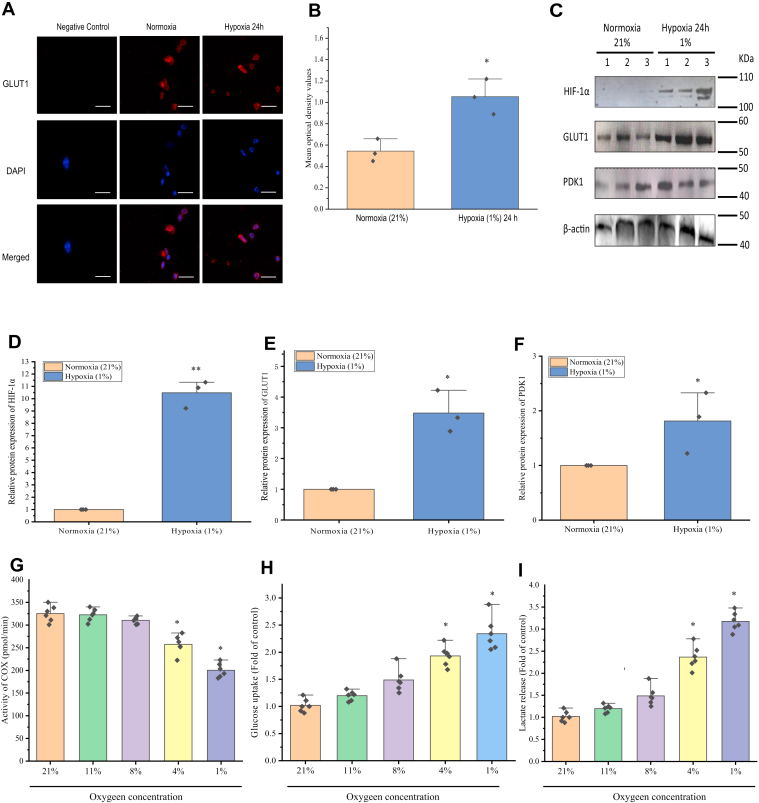
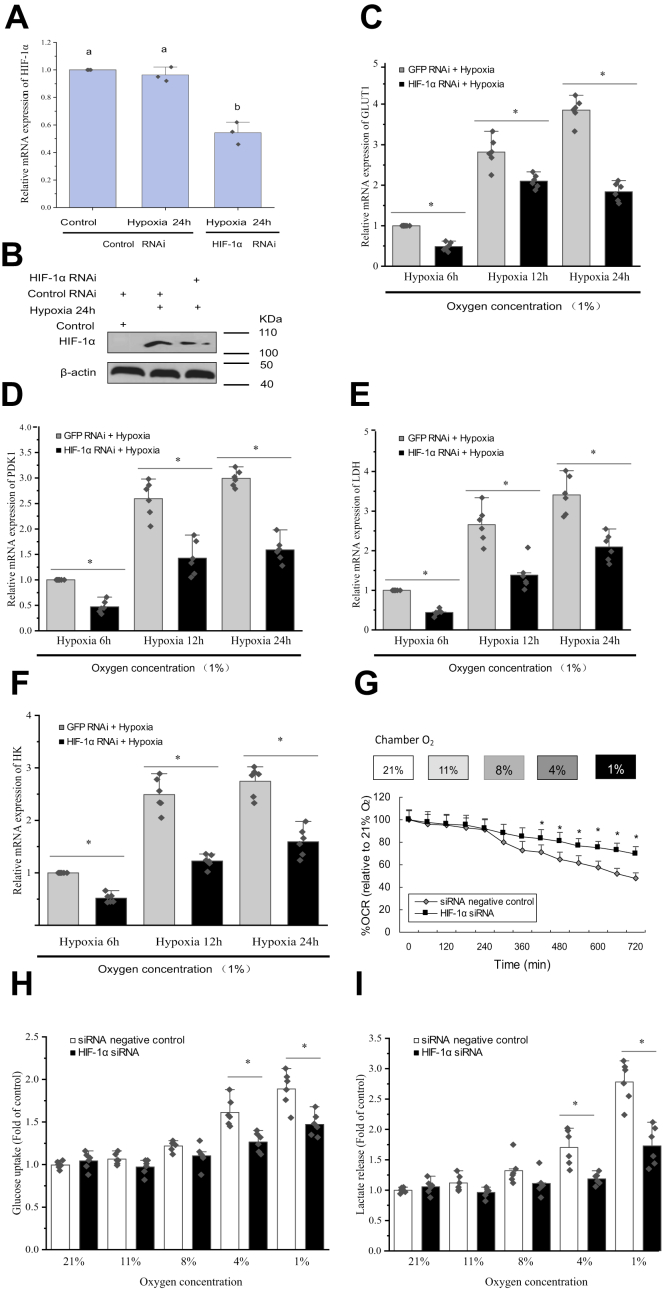
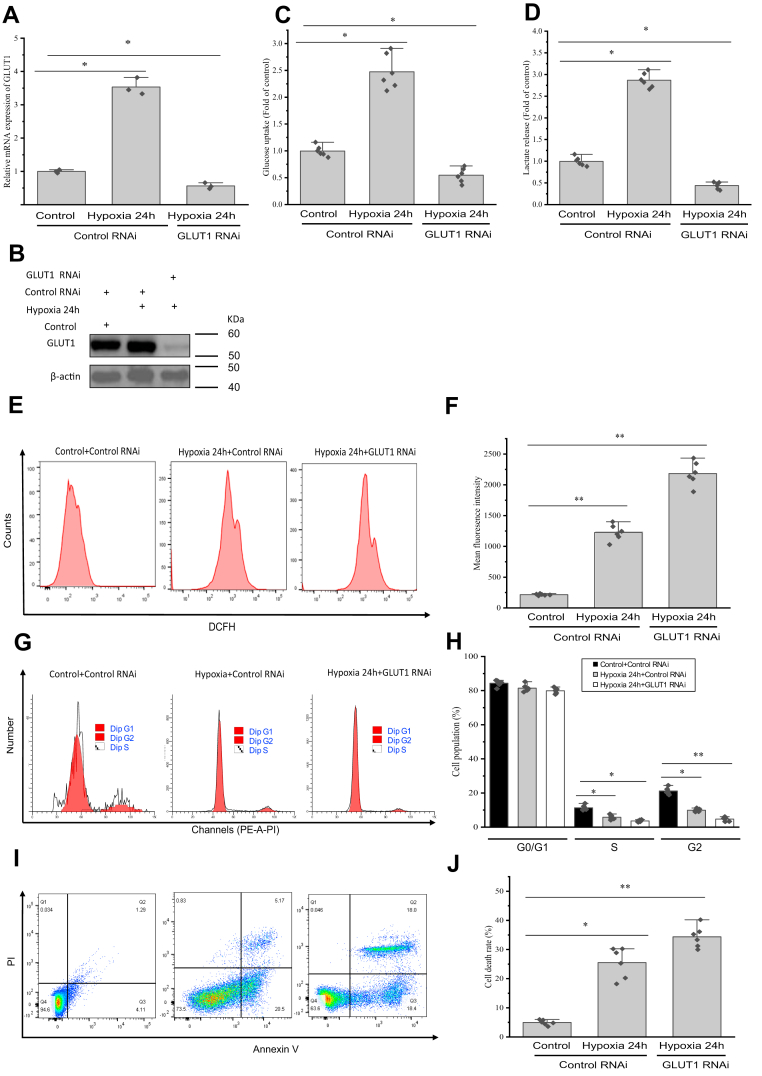
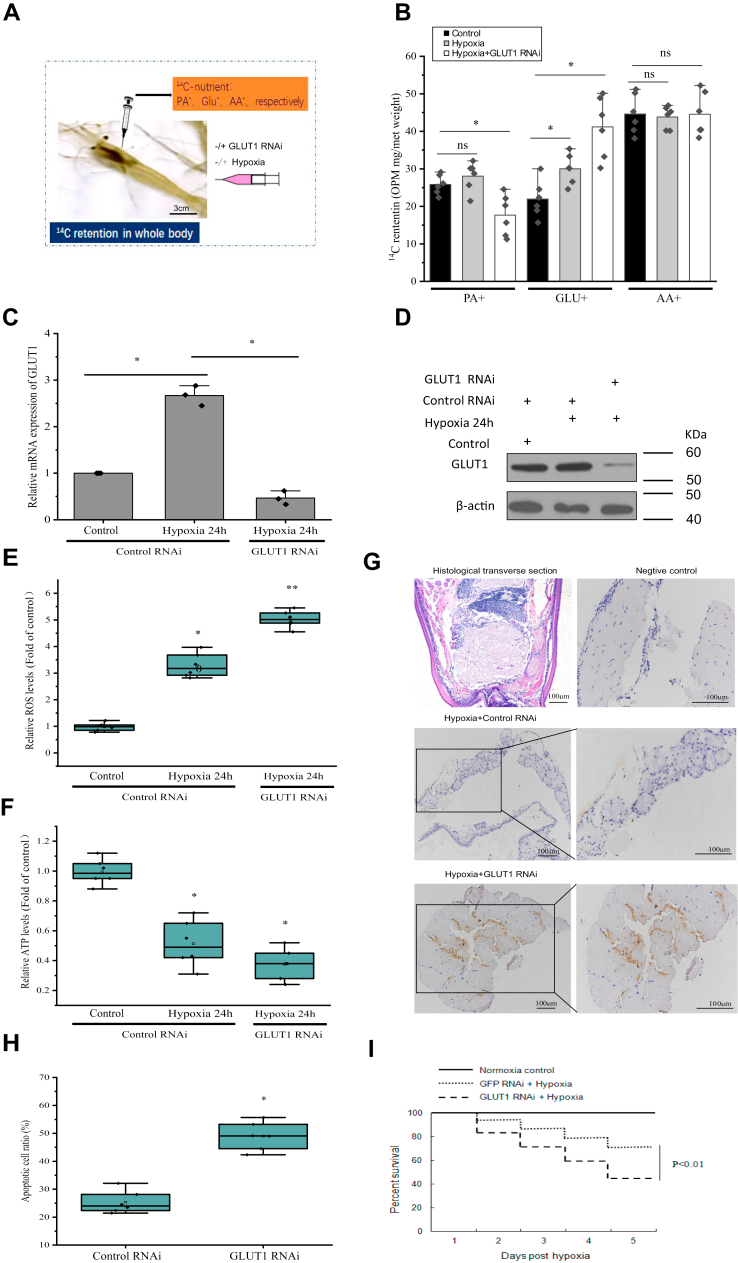
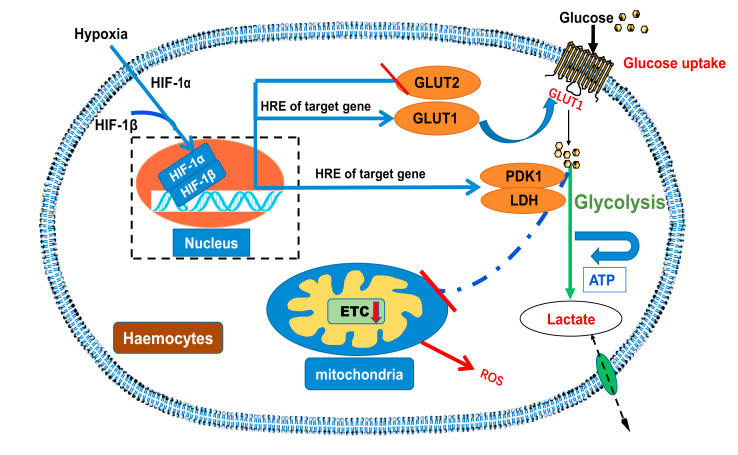
Crustaceans have an open vascular system in which hemocytes freely circulate in hemolymph. Hemocytes are rich in hemocyanin, a specific oxygen-transport protein in crustaceans; therefore, understanding the response of hemocytes to hypoxia is crucial. Although hemocytes take up glucose during hypoxia, the molecular mechanism of glucose uptake in crustaceans remains unclear. Herein, we identified two highly conserved glucose transporters (GLUT1 and GLUT2) in Macrobrachium nipponense (oriental river prawn) and analyzed their tissue-specific expression patterns. Our immunofluorescence assays showed that GLUT1 and GLUT2 are located on the cell membrane, with a strong GLUT1 signal in primary hemocytes under hypoxia. We found that during acute hypoxia, hypoxia-inducible factor-1α-related metabolic alterations result in decreased mitochondrial cytochrome c oxidase activity, implying a classic glycolytic mechanism. As a proof of concept, we replicated these findings in insect S2 cells. Acute hypoxia significantly induced hypoxia-inducible factor-1α, GLUT1, and pyruvate dehydrogenase kinase isozyme 1 expression in primary hemocytes, and hypoxia-induced increases in glucose uptake and lactate secretion were observed. GLUT1 knockdown induced intracellular reactive oxygen species generation and apoptosis in vitro and in vivo, resulting in increased prawn mortality and more apoptotic cells in their brains, implying a vital function of GLUT1 in hypoxia adaptation. Taken together, our results suggest a close relationship between hypoxia-mediated glycolysis and GLUT1 in hemocytes. These results demonstrated that in crustaceans, adaptation to hypoxia involves glucose metabolic plasticity.

Keywords: GLUT1; glucose transport; glycolysis; hypoxia; invertebrate.


Conflict of interest statement

Conflict of interest The authors declare that they have no conflicts of interest with the contents of this article.

Figures

Figure 1
Figure 1
Evolutionary conservation of GLUT1 and GLUT2 in prawn.A and B, the domain organization of GLUT1 and GLUT2 in the oriental river prawn (Macrobrachium nipponense), mouse (Mus musculus), and human (Homo sapiens). Twelve conserved transmembrane domains are shown. Nucleotide and deduced amino acid sequence of the prawn GLUT1 and GLUT2 cDNAs are shown in Figs. S1 and S2. C, prediction of the tertiary structures of prawn (M. nipponense), mouse (Mus musculus), and human (Homo sapiens) GLUT1 and GLUT2 using SWISS-MODEL. D, a phylogenetic tree was constructed using the amino acid sequences of GLUT1 and GLUT2 from the indicated species. The phylogenetic tree was constructed using the neighbor-joining algorithm with the MEGA 4.1 program, based on a multiple sequence alignment generated by ClustalW. Bootstrap values of 1000 replicates (percentages) are indicated on the branches. The accession numbers of the selected sequences are listed in Table S1. cDNA, complementary DNA; GLUT, glucose transporter.
Figure 2
Figure 2
Tissue distribution and mRNA expression profiles of GLUT1 and GLUT2 in oriental river prawns.A and B, the tissue distribution of GLUT1 and GLUT2 mRNA. RNA samples were extracted from healthy prawns, and GLUT1 and GLUT2 expression was studied using qRT–PCR (with β-actin as the internal reference gene). Shown are the means ± standard error (SE; n = 6). Different lowercase letters indicate the significance (determined using one-way ANOVA). C and D, qRT–PCR analysis of the mRNA expression profiles of GLUT1 and GLUT2 in hemocytes under hypoxia (1% O2), using β-actin as the reference gene. Shown are the means ± SE (n = 6). ∗∗p < 0.01, ∗p < 0.05 (Student’s t test). GLUT, glucose transporter; qRT–PCR, quantitative RT–PCR.
Figure 3
Figure 3
The preferentially induction of GLUT1 expression via an HIF-1α binding site under hypoxia.A, a schematic diagram of the GLUT1 and GLUT2 gene promoter region. Putative transcription factor–binding sites are underlined and labeled according to the TRANSFAC database (http://gene-regulation.com/); the nucleotide sequence of the prawn GLUT1 and GLUT2 gene 5′ flanking region is shown in Figs. S3 and S4. B, the expression of GLUT1 and GLUT2 promoter constructs in transiently transected hemocytes. An illustration of the promoter-luciferase reporter constructs is shown on the left. The locations of the potential regulatory elements, HREs, are indicated using red lines. C, the luciferase activity of each construct relative to that of the empty vector (pGL3-basic) in transiently transfected hemocytes. The data are expressed as fold induction relative to the empty vector, and the error bars represent the mean ± standard error (SE) of six replicate trials (n = 6), ∗∗p < 0.01 (Student’s t test). D, a schematic representation of the GLUT1 promoter mutants. ΔHRE4-GLUT1-P1 is a mutated GLUT1 promoter at putative HRE4. E, hemocytes were transiently transfected with each promoter construct along with an HIF-1α expression plasmid. Values represent the means ± SE of six independent experiments (n = 6), ∗∗p < 0.01 (Student’s t test). F, HIF-1α binds to HRE4 in the GLUT1 promoter under hypoxic conditions in prawn hemocytes as determined by ChIP assays. ChIP, chromatin immunoprecipitation; GLUT, glucose transporter; HIF, hypoxia-inducible factor; HRE, hypoxia-response element; TSS, transcription start site.
Figure 4
Figure 4
Involvement of HIF-1α–GLUT1 in the glycolytic reprogramming of primary hemocytes during hypoxia.A, immunofluorescence of GLUT1 in the hemocytes of oriental river prawns under hypoxia for 24 h. Confocal microscopy: fluorescence was developed using secondary antibodies conjugated with Alexa 568 (red). Nuclei were stained with 4′,6-diamidino-2-phenylindole (DAPI) (blue). In the negative control, primary antibodies were replaced with normal nonimmune serum. The white line in the lower right corner represents the scale bar (50 μm). Immunofluorescence of GLUT2 in hemocytes is shown in Fig. S5. B, the mean absorbance values used for quantification of the cell membrane expression of GLUT1 in response to hypoxia 24 h. All values are presented as the mean ± standard error (SE) (n = 3), ∗p < 0.05 (Student’s t test). C, HIF-1α, GLUT1, and PDK1 protein levels in hemocytes under hypoxia for 12 h were determined using Western blotting analysis. β-actin was used as an internal control. DF, the quantitative data for the protein levels in prawn hemocytes under hypoxia for 24 h. ImageJ was used for densitometry quantification of the immunoreactive protein bands on the Western blot. The error bars represent the mean ± SE of three replicate trials (n = 3). ∗∗p < 0.01, ∗p < 0.05 (Student’s t test). G, the cytochrome c oxidase activity of hemocytes was calculated in the presence of ascorbate (100 mM) and TMPD (1 mM; 21% O2, 4 h—11% O2, 4 h—8% O2, 4 h—4% O2, 4 h—1% O2). H and I, the effect of hypoxia on 3H-2-DOG glucose uptake and lactate secretion in hemocytes under hypoxia for 24 h. The abilities of glucose uptake and lactate secretion were expressed as a ratio of the hypoxia treatment sample in the control normoxia sample. The error bars represent the mean ± standard error (SE) of six replicate trials (n = 6). Student’s t test was performed to calculate the significant differences. ∗p < 0.05 represents control (21% O2) versus 11%, 8%, 4%, and 1% O2 concentration, respectively. Glycolysis-related gene expression levels and mitochondrial complex I−IV activities in hemocytes of prawns under hypoxia are shown in Fig. S6, illustrating that hypoxia induced glycolytic remodeling of hemocytes in crustaceans. GLUT, glucose transporter; 3H-2-DOG, 3H-2-deoxy-d-glucose; HIF, hypoxia-inducible factor; PDK1, pyruvate dehydrogenase kinase isozyme 1; TMPD, tetramethyl-p-phenylenediamine.
Figure 5
Figure 5
HIF-1α-dependent glycolytic reprogramming in primary hemocytes during hypoxia.A, the effects of RNAi on HIF-1α. An HIF1αsiRNA (siHIF-1α) was designed to knockdown HIF-1α expression, and HIF-1α expression in prawn hemocytes was determined 24 h posthypoxia with siHIF-1α by qRT–PCR (with siGFP as a control). Shown are the means ± standard error (SE; n = 3). Three independent repeats were performed with different lowercase letters indicating the significance (one-way ANOVA). B, hemocytes were knocked down for HIF-1α, which was confirmed using immunoblotting. CF, knockdown of HIF-1α decreased the hypoxic induction of glucose transporter 1 (GLUT1), pyruvate dehydrogenase kinase isoenzyme 1 (PDK1), hexokinase (HK), and lactate dehydrogenase (LDH) in hemocytes (with siGFP as a control). G, the cellular oxygen consumption rate (OCR) of hemocytes under hypoxia (3 h—11% O2, 3 h–8% O2, 3 h–5% O2, and 3 h–1% O2) was plotted as percent of the OCR in 21% O2 (y-axis) versus time (x-axis). H and I, the glucose uptake by hemocytes was examined using a 2-deoxyglucose (2-DG) uptake assay. Lactate was measured using a lactate assay kit. The glucose uptake and lactate secretion abilities were expressed as a ratio of the hypoxia 24 h treatment sample in the control normoxia sample. The error bars represent the mean ± SE of six replicate trials (n = 6). ∗p < 0.05 (Student’s t test), which marks significant differences in the control RNAi versus HIF-1α RNAi. The critical role of HIF-1α in glycolytic reprogramming in hypoxia was also observed in Drosophila S2 cells (Fig. S7); supporting the notion that HIF-1α plays an essential role in the regulation of mitochondrial activity in invertebrates. GLUT1, glucose transporter 1; HIF-1α, hypoxia-inducible factor-1α; qRT–PCR, quantitative RT–PCR.
Figure 6
Figure 6
Involvement of GLUT1 in glucose uptake and reactive oxygen species (ROS) production in primary hemocytes during hypoxia.A, hemocytes were transfected with an siRNA targeted against GLUT1 or with a nontargeting siRNA as a control. The error bars represent the mean ± standard error (SE) of three replicate trials (n = 3), ∗p < 0.05 (Student’s t test). Forty-eight hours after siRNA transfection, hemocytes were treated with or without hypoxia for 24 h. B, hemocytes were knocked down for GLUT1, which was confirmed using immunoblotting. C and D, the effects of hypoxia on glucose uptake and lactate production in hemocytes were examined and expressed as a ratio of the normoxia treatment sample in the control siRNA sample. E, intracellular ROS in hemocytes treated with hypoxia or GLUT1 knockdown were detected using flow cytometry. F, summarized data showing that GLUT1 knockdown aggravated the effect of hypoxia-induced ROS generation of prawn hemocytes. G, flow cytometry analysis evaluating the influence of hypoxia or GLUT1 knockdown on the cell cycle in hemocytes. H, summarized data showing that GLUT1 knockdown aggravated the effect of the hypoxia-inhibited cell cycle in hemocytes. I, the effect of hypoxia or GLUT1 knockdown on cell apoptosis was determined using flow cytometry. J, summarized data showing that GLUT1 knockdown aggravated the effect of hypoxia-induced cell apoptosis in hemocytes. The error bars represent the mean ± SE of six replicate trials (n = 6). ∗∗p < 0.01 and ∗p < 0.05 (Student’s t test), which mark significant differences between the normoxia treatment sample in the control siRNA sample and the hypoxia groups subjected to control or GLUT1 siRNA. GLUT1, glucose transporter 1.
Figure 7
Figure 7
Involvement of GLUT1 in the regulation of brain cell function of prawns in response to hypoxia in vivo.A, schematic diagram of 14C-labeled nutrient tracking test in prawns injected with 10 μg of siGLUT1 (with siGFP as a control) after 24 h. B, 14C-retention in the whole body at 2 h after the injection of PA or Glu, or AA in siGFP and siGLUT1 knockdown prawns (n = 6), ∗p < 0.05 (Student’s t test). C, prawns were each injected with 10 μg of siGLUT1 (with siGFP as a control), and GLUT1 expression in prawn hemocytes was determined at 24 h posthypoxia using qRT–PCR. The error bars represent the mean ± standard error (SE) of three replicate trials (n = 3), ∗p < 0.05 (Student’s t test). D, hemocytes were knocked down for GLUT1 in vivo, which was also confirmed using immunoblotting. E and F, intracellular reactive oxygen species (ROS) and ATP levels in GLUT1-silenced prawn under hypoxia. Prawns were each injected with 10 μg of siGLUT1 (with siGFP as a control), and intracellular ROS and ATP levels in the prawn brains were determined at 24 h after injection with siGLUT1. Values are normalized to those of normoxic conditions. The error bars represent mean ± SE of six replicate trials (n = 6). ∗∗p < 0.01, ∗p < 0.05 (Student’s t test), which mark significant differences between the normoxia and the hypoxia groups subjected to GLUT1 or control siRNA. G, knockdown of GLUT1 exacerbates hypoxia-induced apoptosis in adult prawn brains. TUNEL staining of the brains of GLUT1-silenced prawns in response to hypoxia for 24 h. Apoptotic cells are colored gray; healthy cells are colored baby blue. The black line in the lower right corner represents the scale bar (100 or 50 μm). H, the ratio of apoptotic brain cells to healthy brain cells in GLUT1-silenced prawns. The error bars represent ± SE of six replicate trials (n = 6). ∗p < 0.05 (Student’s t test), which marks significant differences between the hypoxia treatment sample in the control siRNA sample and the hypoxia groups subjected to control or GLUT1 siRNA. I, knockdown of GLUT1 aggravated prawn hypoxic death. Prawns were each injected with 10 μg of siGLUT1 (with siGFP as a control), and their 5-day survival posthypoxia (1.8 mg/l) was assessed. The error bars represent ±SE of triplicate trials (n = 3). ∗∗p < 0.01 (Student’s t test), which marks significant differences between the hypoxia treatment sample in the control siRNA sample and the hypoxia groups subjected to control or GLUT1 siRNA. GLUT1, glucose transporter 1; qRT–PCR, quantitative RT–PCR.
Figure 8
Figure 8
The schematic representation of HIF-1α–GLUT1-mediated hypoxia regulation of glucose metabolism and cell function. ETC, electron transfer chain; GLUT, glucose transporter; HIF-1α, hypoxia-inducible factor-1α; HRE, hypoxia response element; LDH, lactate dehydrogenase; PDK1, pyruvate dehydrogenase kinase isozyme 1; ROS, reactive oxygen species.

Similar articles

Cited by

References

    1. Rytkönen K.T., Vuori K.A.M., Primmer C.R., Nikinmaa M. Comparison of hypoxia-inducible factor-1alpha in hypoxia-sensitive and hypoxia-tolerant fish species. Comp. Biochem. Physiol. Part D Genom. Proteom. 2007;2:177–186. - PubMed
    1. Wu R.S.S. Hypoxia: from molecular responses to ecosystem responses. Mar. Pollut. Bull. 2002;45:35–45. - PubMed
    1. Wu R.S., Zhou B.S., Randall D.J., Woo N.Y., Lam P.K. Aquatic hypoxia is an endocrine disruptor and impairs fish reproduction. Environ. Sci. Technol. 2003;37:1137–1141. - PubMed
    1. Abdel-Tawwab M., Monier M.N., Hoseinifar S.H., Faggio C. Fish response to hypoxia stress: growth, physiological, and immunological biomarkers. Fish Physiol. Biochem. 2019;45:997–1013. - PubMed
    1. Wang S.Y., Lau K., Lai K.P., Zhang J.W., Tse C.K., Li J.W., et al. Hypoxia causes transgenerational impairments in reproduction of fish. Nat. Commun. 2016;7:12114. - PMC - PubMed

Publication types

MeSH terms

Substances