. 2023 Feb;38(1):108-118.
doi: 10.1016/j.virs.2022.11.008. Epub 2022 Nov 24.

Persistent inflammation and neuronal loss in the mouse brain induced by a modified form of attenuated herpes simplex virus type I

Affiliations

Persistent inflammation and neuronal loss in the mouse brain induced by a modified form of attenuated herpes simplex virus type I

Erlin Wang et al. Virol Sin. 2023 Feb.

Abstract

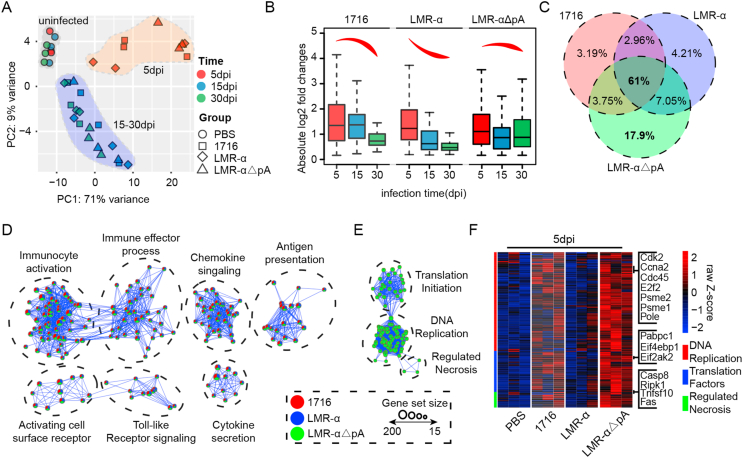
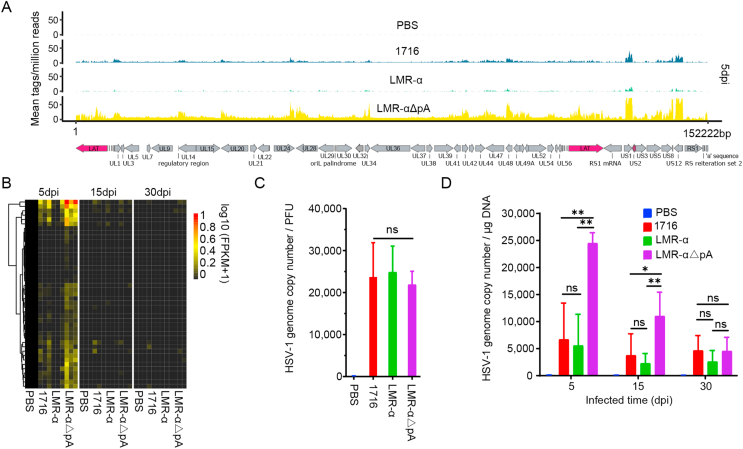
Herpes simplex virus-1 (HSV-1) is a widespread neurotropic virus that can reach the brain and cause a rare but acute herpes simplex encephalitis (HSE) with a high mortality rate. Most patients present with changes in neurological and behavioral status, and survivors suffer long-term neurological sequelae. To date, the pathogenesis leading to brain damage is still not well understood. HSV-1 induced encephalitis in the central nervous system (CNS) in animals are usually very diffuse and progressing rapidly, and mostly fatal, making the analysis difficult. Here, we established a mouse model of HSE via intracerebral inoculation of modified version of neural-attenuated strains of HSV-1 (deletion of ICP34.5 and inserting a strong promoter into the latency-associated transcript region), in which the LMR-αΔpA strain initiated moderate productive infection, leading to strong host immune and inflammatory response characterized by persistent microglia activation. This viral replication activity and prolonged inflammatory response activated signaling pathways in neuronal damage, amyloidosis, Alzheimer's disease, and neurodegeneration, eventually leading to neuronal loss and behavioral changes characterized by hypokinesia. Our study reveals detailed pathogenic processes and persistent inflammatory responses in the CNS and provides a controlled, mild and non-lethal HSE model for studying long-term neuronal injury and increased risk of neurodegenerative diseases due to HSV-1 infection.

Keywords: Herpes simplex encephalitis (HSE); Herpes simplex virus-1 (HSV-1); ICP34.5; Neuroinflammation; Neuronal loss.


Conflict of interest statement

Conflict of interest The authors declare that they have no conflict of interest.

Figures

Fig. 1
Fig. 1
Establishment of encephalitis model of neural-attenuated HSV-1 in mice. A Schematic diagram of ICP34.5 deficient recombinant viruses. 17+ is the wild-type HSV-1 strain, and 17+ variant 1716, which has a 759 bp deletion in ICP34.5 gene. The two RFP gene expression elements shown in the figure were recombined into the first STY1 restriction site of LAT exon of strain 1716 to obtain LMR-α and LMR-αΔpA strains. CBh, chicken β-actin short promoter; RFP, red fluorescent protein; poly A, human growth hormone poly A signal. B Establish and validate the intracranial injection mouse model. By intracranial injection, the virus is precisely localized in the cerebral cortex. The figure shows the wild-type virus infection for 24 ​h, the green signal indicates HSV-1, and the blue signal indicates nuclear staining. C Survival rates of mice after intracranial infection. P-values between 17+ and ICP34.5 deficient viruses were calculated by a log-rank (Mantel-Cox) test.
Fig. 2
Fig. 2
ICP34.5 deficient viruses elicit distinct transcriptional responses in mouse brains. A Principal component analysis of the encephalitis model transcriptomic data. The graph shows clustering of samples under two factors, infection group and time, with each point representing transcriptomic data from one mouse brain. B Trend analysis of host transcriptional homeostasis under virus infection. The distribution of absolute log2 fold changes for host genes between adjacent time points in each infection group is shown, which was used to measure changes in the host transcriptome. Lines represent medians, boxes represent 25%–75% intervals, and whiskers represent 5%–95% intervals. Outliers are not shown. Differences in fold changes were tested by ANOVA. C Venn diagram showing the proportion of GO terms shared among virus infected samples. Identification of virus infection (5 dpi)-associated biological processes by gene set enrichment analysis, and significantly differed GO terms (hypergeometric P-value < 0.005) were selected for analysis. D The enrichment network shows shared biological processes of infection by different strains. Each significantly enriched gene set (hypergeometric P value ​< ​0.005) is represented by a node. Node sizes are proportional to the number of genes within the respective gene set, and the edges indicate overlapping member genes. Highly similar gene sets tend to form clusters, which were manually circled and labeled with appropriate summarizing terms. Visualization of GO term networks were performed with the Cytoscape Enrichment Map plug-in (v3.3) (Merico et al., 2010) using a Jaccard coefficient cutoff of >0.5. Clusters of gene sets were manually marked and named according to their GO annotation using the Cytoscape Word Cloud plug-in (v3.1). E The enriched network shows biological processes unique affected by the LMR-αΔpA strain. The analysis procedure is as in panel (D). F Heatmap showing significantly differentially transcribed genes in biological processes unique affected by LMR-αΔpA. Adjust P -value ≤ 0.05 and absolute log2 fold change ≥2 were used as thresholds.
Fig. 3
Fig. 3
LMR-αΔpA could establish a productive infection in vivo.A Coverage profiles of viral genome from each infection group. Bedtools (v2.27.1) software and ‘genomecov’ arithmetic was used to compute the depth over the entire HSV-1 genome. Viral genome elements are indicated at the bottom and infection time (dpi) are shown in the right. Data represents the average count from three biological replicates. B Heatmap reflecting expression intensity of viral genes. C Absolute quantification of viral genome copy number used for intracranial injection. Data are represented as mean ​± ​SD. ns, not significant, ∗ P ​< ​0.05, ∗∗ P ​< ​0.01 by two-tailed t-test. D Quantitative real-time PCR enumeration of viral genome copy number at the indicated time points. The statistical method is the same as in panel (C).
Fig. 4
Fig. 4
Functional diffusion of exogenous promoter causes productive infection of LMR-αΔpA. A Schematic representation of the functional diffusion of exogenous promoter. Regulatory relationships among LAT promoter (LAP), chicken β-actin short promoter (cBh) and LAT intron were shown. LAP, LAT promoter. B LAT intron transcript numbers were detected by absolute quantification. Data are represented as mean ​± ​SD. ns, not significant, ∗∗ P ​< ​0.01 by two-tailed t-test. C Line chart representing the total number of viral genes (read count >10) at the indicated time points. Data are represented as mean ​± ​standard deviation (SD), and means were labeled around points. D Heatmaps reflecting expression intensity of differentially transcribed viral genes. Viral genes with log2 fold change> 0 and adjusted P value ​≤ ​0.01 were considered differentially expressed and were displayed in the heat map by red color. White areas indicate viral genes that below the differentially expressed genes (DEGs) threshold. log2FC: log2 fold change. E Absolute quantitative real-time RT-PCR was used to detect the transcription level of ICP27 gene. Data are represented as mean ​± ​SD. ns, not significant, ∗ P ​< ​0.05, ∗∗ P ​< ​0.01 by two-tailed t-test. F Detection of HSV-1 antigen in injection sites of mouse brain. The graph shows the test results at 5 dpi. The red box marks the virus-infected region, and the red arrow marks the virus antigen signal. The HSV-1 antigen-positive cells were quantified by counting at a one square millimeter frame of view within the injection site. Data are represented as mean ​± ​SD. ∗ P ​< ​0.05, and ∗∗ P ​< ​0.01 by two-tailed t-test.
Fig. 5
Fig. 5
LMR-αΔpA induces persistent neuroinflammatory response. A Heatmap shows trends in host immune response following viral infection. Gene set enrichment analysis based on the KEGG pathway database, and immune signaling pathway were selected. B Heatmap analysis of transcriptional changes in microglia marker genes. The list of microglia signature genes in the mouse brain was obtained from the CellMarker database (Zhang X. et al., 2019). C The bar graph represents the changes in the mean percentages of selected brain cells. Differences between LMR-αΔpA infection and PBS-treated groups were analyzed, and two-tailed t tests were conducted to test significance. D Microglial cells were identified with immunofluorescence staining. The brains of infected mice were harvested at 30 dpi to detect the enrichment of microglia at the injection site in cerebral cortex, and graphs show the difference between 1716 and LMR-αΔpA infection. Iba1, microglial marker. The Iba1-positive cells were quantified by counting at a one square millimeter frame of view within the injection site. E Absolute quantification of viral genome copy number in late-phase infection. Data are represented as mean ​± ​SD. ns, not significant. F Absolute quantification of LAT intron transcripts in late-phase infection. Data are represented as mean ​± ​SD. ∗ P ​< ​0.05, ∗∗ P ​< ​0.01 by two-tailed t-test.
Fig. 6
Fig. 6
Potential neurological risk is activated during viral infection. A Venn diagram indicates shared DEGs among the three ICP34.5 deficient viruses at 30dpi; heatmap represents an expression pattern of 725 genes that were differentially expressed only in LMR-αΔpA infected samples. B The enriched network shows biological processes of the 725 genes in panel (A). Gene functional enrichment analysis was performed using g:Profiler (Raudvere et al., 2019), and the network diagram was drawn in the same way as described in panel (Fig. 2B). C Heatmap reflecting expression intensity of key genes of LMR-αΔpA infection-related biological functions. D Gene-disease phenotypic association analysis of host transcriptome affected by viral infection. The mouse genes were mapped to their human orthologs, and then disease pathway enrichment was analyzed by gene set enrichment analysis.
Fig. 7
Fig. 7
LMR-αΔpA infection causes neuronal damage and abnormal autonomic behavior. A Neurons were identified with immunofluorescence staining. Brain tissues were collected at 60dpi and density of neurons at the injection site were detected. NeuN, neuron marker. The NeuN-positive cells were quantified by counting at a one square millimeter frame of view within the injection site. Data are represented as mean ​± ​SD. ns, not significant, ∗∗ P ​< ​0.01 by two-tailed t-test. BH Changes in autonomic behavior of mice after virus infection were assessed using open field test. Open field testing was performed at 90 dpi and each group contained at least 8 mice. B, Total distance moved in the open field; C, Average moving speed in the open field; D, Time in the central sector of the open field; E, Total distance moved in the central area; F, Total distance moved in the out ring; G, Total time resting; H, Total time resting in the four corners. Data are represented as mean ​± ​SD. P value is calculated by two-tailed t-test.

Similar articles

Cited by

References

    1. Alexander D.E., Leib D.A. Xenophagy in herpes simplex virus replication and pathogenesis. Autophagy. 2008;4:101–103. - PMC - PubMed
    1. Armien A.G., Hu S., Little M.R., Robinson N., Lokensgard J.R., Low W.C., Cheeran M.C. Chronic cortical and subcortical pathology with associated neurological deficits ensuing experimental herpes encephalitis. Brain Pathol. 2010;20:738–750. - PMC - PubMed
    1. Asai M., Hattori C., Szabo B., Sasagawa N., Maruyama K., Tanuma S., Ishiura S. Putative function of adam9, adam10, and adam17 as app alpha-secretase. Biochem. Biophys. Res. Commun. 2003;301:231–235. - PubMed
    1. Barker K.R., Sarafino-Wani R., Khanom A., Griffiths P.D., Jacobs M.G., Webster D.P. Encephalitis in an immunocompetent man. J. Clin. Virol. 2014;59:1–3. - PubMed
    1. Bohmwald K., Andrade C.A., Galvez N.M.S., Mora V.P., Munoz J.T., Kalergis A.M. The causes and long-term consequences of viral encephalitis. Front. Cell. Neurosci. 2021;15 - PMC - PubMed