. 2022 Nov 27;12(1):20379.
doi: 10.1038/s41598-022-24746-w.

The effect of scalable PDMS gas-entrapping microstructures on the dynamics of a single cavitation bubble

Affiliations

The effect of scalable PDMS gas-entrapping microstructures on the dynamics of a single cavitation bubble

Vicente Robles et al. Sci Rep. .

Abstract

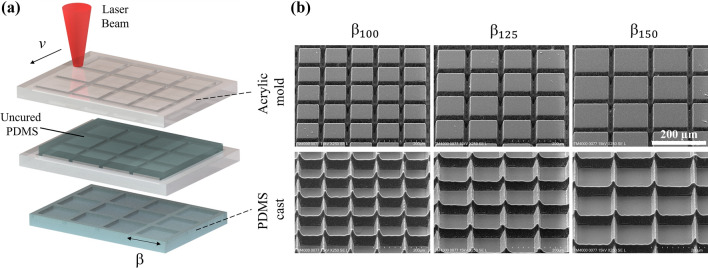
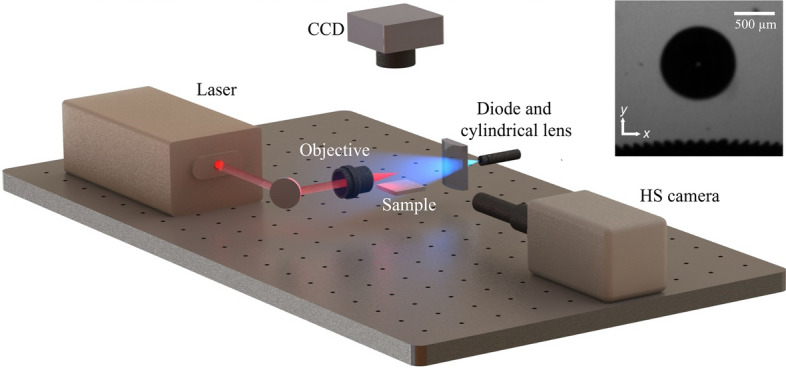
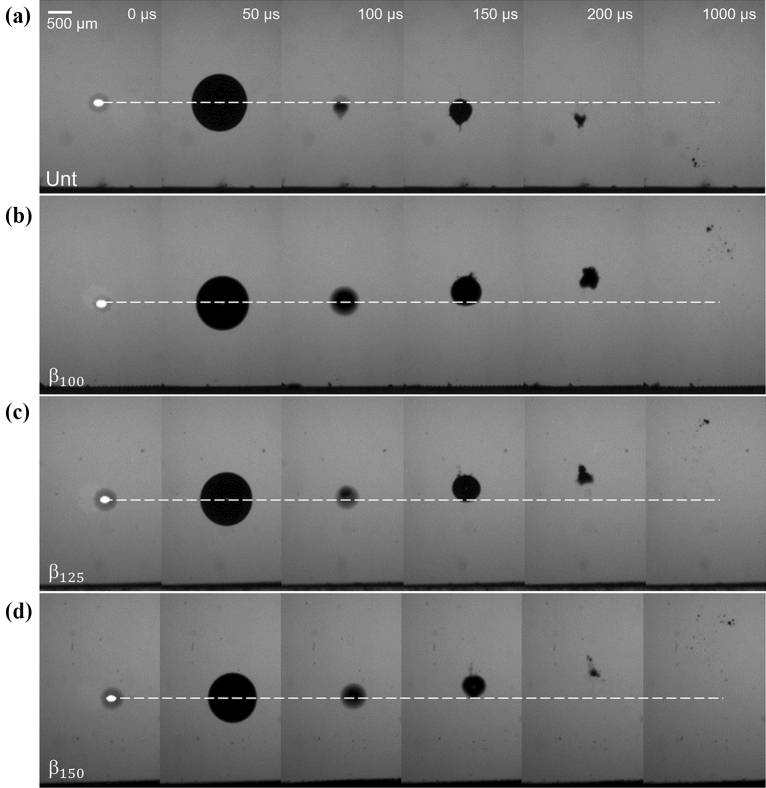
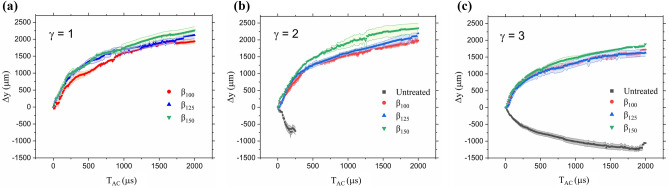
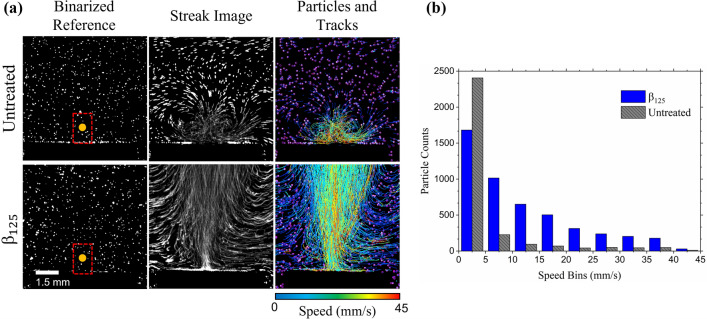
The effect of gas-entrapping polydimethylsiloxane (PDMS) microstructures on the dynamics of cavitation bubbles laser-induced next to the PDMS surface is investigated and compared against the cavitation dynamics next to a flat smooth boundary. Local pressure gradients produced by a cavitation bubble cause the air pockets entrapped in the PDMS microstructures to expand and oscillate, leading to a repulsion of the cavitation bubble. The microstructures were fabricated as boxed crevices via a simple and scalable laser ablation technique on cast acrylic, allowing for testing of variable structure sizes and reusable molds. The bubble dynamics were observed using high speed photography and the surrounding flows were visualized and quantified using particle tracking velocimetry. Smaller entrapped air pockets showed an enhanced ability to withstand deactivation at three stand-off distances and over 50 subsequent cavitation events. This investigation provides insight into the potential to direct the collapse of a cavitation bubble away from a surface to mitigate erosion or to enhance microfluidic mixing in low Reynolds number flows.


Conflict of interest statement

The authors declare no competing interests.

Figures

Figure 1
Figure 1
(a) Schematic of microstructure fabrication process, (b) SEM images at 45° tilt of negative acrylic molds (top row) and cured PDMS casted microstructures (bottom row). Scale bar (200 µm) is uniform across images.
Figure 2
Figure 2
(a) Visual comparison of sensile DI water droplet on a smooth, untreated PDMS and on the β100 microstructure sample. (b) Average of three contact angle measurements for each of the four samples studied.
Figure 3
Figure 3
Schematic representation of the experimental setup to induce cavitation (cuvette not shown), record the bubble dynamics (white light not shown) and perform PTV visualization. Inset shows representative HS image of a cavitation bubble above a microstructured surface. Dark ridges seen at the bottom surface are the expanded EAPs.
Figure 4
Figure 4
Comparison of a single cavitation bubble collapsing at a stand-off distance of γ = 1 from (a) untreated PDMS, (b) β100, (c) β125, and (d) β150 microstructures. The black line at the bottom of each image corresponds to the sample surface.
Figure 5
Figure 5
Comparison of a single cavitation bubble collapsing at a stand-off distance of γ = 2 from (a) untreated PDMS, (b) β100, (c) β125, and (d) β150 microstructures. The black line at the bottom of each image is the surface.
Figure 6
Figure 6
Sequence of images showing micro-jet evolution during cavitation bubble collapse (γ = 2, β100). The scale bar is 500 µm.
Figure 7
Figure 7
Comparison of a single cavitation bubble collapsing at a stand-off distance of γ = 3 from (a) untreated PDMS, (b) β100, (c) β125, and (d) β150 microstructures. The black line at the bottom of each image is the surface.
Figure 8
Figure 8
Average displacement of cavitation bulk volume following collapse near microstructure samples and an untreated PDMS at (a) γ = 1, (b) γ = 2, and (c) γ = 3. Displacements shown correspond to a single cavitation event formed above pristine samples. TAC = 0 µs depicts moment of cavitation bubble collapse. Positive displacement is migration away from surface.
Figure 9
Figure 9
(a) Average wetted region of each microstructure sample following a sequence of cavitation events. Data points are highlighted to show their corresponding stand-off distances (pink, yellow and blue for γ = 1, γ = 2, and γ = 3 respectively). (b) Representative top view (CCD camera) of β125 microstructures after 50 cavitation events for each stand-off distance. Red dashed circle represents the projection of the maximum bubble size. The length of the blue triangle shown in the images is 500 µm.
Figure 10
Figure 10
(a) Top view of microstructures showing wetting progression. Red dashed circle represents the projection of the maximum bubble size. Scale bar is 500 µm. (b) Displacement of cavitation bubble after 1, 25 and 50 events.
Figure 11
Figure 11
(a) Pathlines of seeded fluorescent particles to show dynamics following cavitation bubble collapses near, (b) an untreated PDMS surface and (b) a β125 microstructure surface.

References

    1. Lauterborn W, Kurz T, Mettin R, Ohl CD. Advances in Chemical Physics. Wiley; 2007. Experimental and theoretical bubble dynamics; pp. 295–380.
    1. Hellman AN, et al. Laser-induced mixing in microfluidic channels. Anal. Chem. 2007;79:4484–4492. doi: 10.1021/ac070081i. - DOI - PubMed
    1. Dijkink R, Ohl CD. Laser-induced cavitation based micropump. Lab Chip. 2008;8:1676–1681. doi: 10.1039/b806912c. - DOI - PubMed
    1. García-Morales NG, et al. Numerical modeling of a micropump without mobile parts actuated by thermocavitation bubbles. Microsyst. Technol. 2021;27:801–812. doi: 10.1007/s00542-020-04998-0. - DOI
    1. Luo JC, et al. Laser cavitation rheology for measurement of elastic moduli and failure strain within hydrogels. Sci. Rep. 2020;10:1–13. doi: 10.1038/s41598-020-68621-y. - DOI - PMC - PubMed