. 2023 Jan;145(1):49-69.
doi: 10.1007/s00401-022-02516-2. Epub 2022 Nov 27.

Amplification of the PLAG-family genes-PLAGL1 and PLAGL2-is a key feature of the novel tumor type CNS embryonal tumor with PLAGL amplification

Michaela-Kristina Keck  1   2 Martin Sill  1   3 Andrea Wittmann  1   2 Piyush Joshi  1 Damian Stichel  4   5 Pengbo Beck  1   3   6 Konstantin Okonechnikow  1   3 Philipp Sievers  4   5 Annika K Wefers  7 Federico Roncaroli  8 Shivaram Avula  9 Martin G McCabe  10 James T Hayden  11 Pieter Wesseling  12   13 Ingrid Øra  14 Monica Nistér  15 Mariëtte E G Kranendonk  12 Bastiaan B J Tops  12 Michal Zapotocky  16   17 Josef Zamecnik  18 Alexandre Vasiljevic  19 Tanguy Fenouil  19 David Meyronet  19 Katja von Hoff  20 Ulrich Schüller  7   21   22 Hugues Loiseau  23 Dominique Figarella-Branger  24 Christof M Kramm  25 Dominik Sturm  1   2   26 David Scheie  27 Tuomas Rauramaa  28 Jouni Pesola  29 Johannes Gojo  30 Christine Haberler  31 Sebastian Brandner  32   33 Tom Jacques  34 Alexandra Sexton Oates  35 Richard Saffery  35 Ewa Koscielniak  36 Suzanne J Baker  37 Stephen Yip  38 Matija Snuderl  39 Nasir Ud Din  40 David Samuel  41 Kathrin Schramm  1   2 Mirjam Blattner-Johnson  1   2 Florian Selt  1   42   43 Jonas Ecker  1   42   43 Till Milde  1   42   43 Andreas von Deimling  4   5 Andrey Korshunov  1   4   5 Arie Perry  44 Stefan M Pfister  1   3   26 Felix Sahm  1   4   5 David A Solomon #  45 David T W Jones #  46   47
Affiliations

Amplification of the PLAG-family genes-PLAGL1 and PLAGL2-is a key feature of the novel tumor type CNS embryonal tumor with PLAGL amplification

Michaela-Kristina Keck et al. Acta Neuropathol. 2023 Jan.

Erratum in

  • Correction to: Amplification of the PLAG-family genes-PLAGL1 and PLAGL2-is a key feature of the novel tumor type CNS embryonal tumor with PLAGL amplification.
    Keck MK, Sill M, Wittmann A, Joshi P, Stichel D, Beck P, Okonechnikow K, Sievers P, Wefers AK, Roncaroli F, Avula S, McCabe MG, Hayden JT, Wesseling P, Øra I, Nistér M, Kranendonk MEG, Tops BBJ, Zapotocky M, Zamecnik J, Vasiljevic A, Fenouil T, Meyronet D, von Hoff K, Schüller U, Loiseau H, Figarella-Branger D, Kramm CM, Sturm D, Scheie D, Rauramaa T, Pesola J, Gojo J, Haberler C, Brandner S, Jacques T, Sexton Oates A, Saffery R, Koscielniak E, Baker SJ, Yip S, Snuderl M, Ud Din N, Samuel D, Schramm K, Blattner-Johnson M, Selt F, Ecker J, Milde T, von Deimling A, Korshunov A, Perry A, Pfister SM, Sahm F, Solomon DA, Jones DTW. Keck MK, et al. Acta Neuropathol. 2023 Apr;145(4):511-514. doi: 10.1007/s00401-023-02538-4. Acta Neuropathol. 2023. PMID: 36786841 Free PMC article. No abstract available.

Abstract

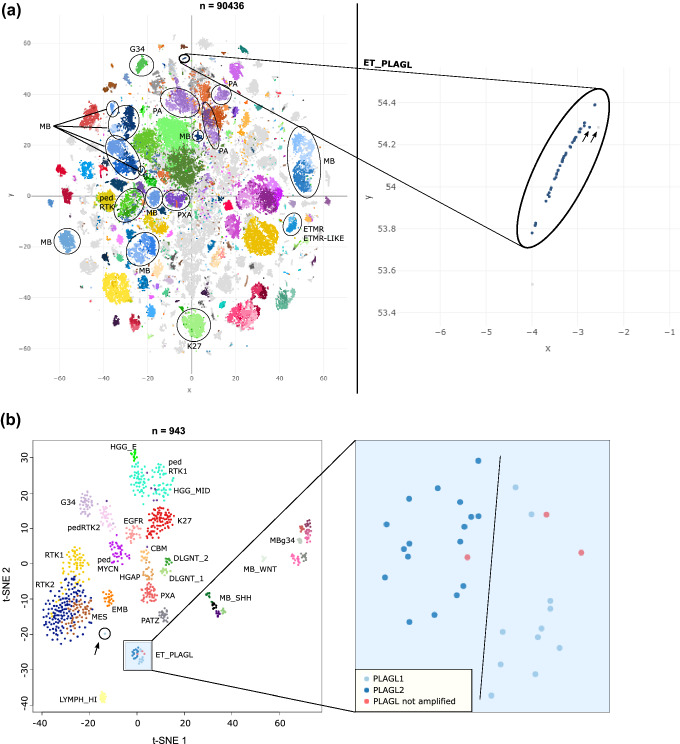
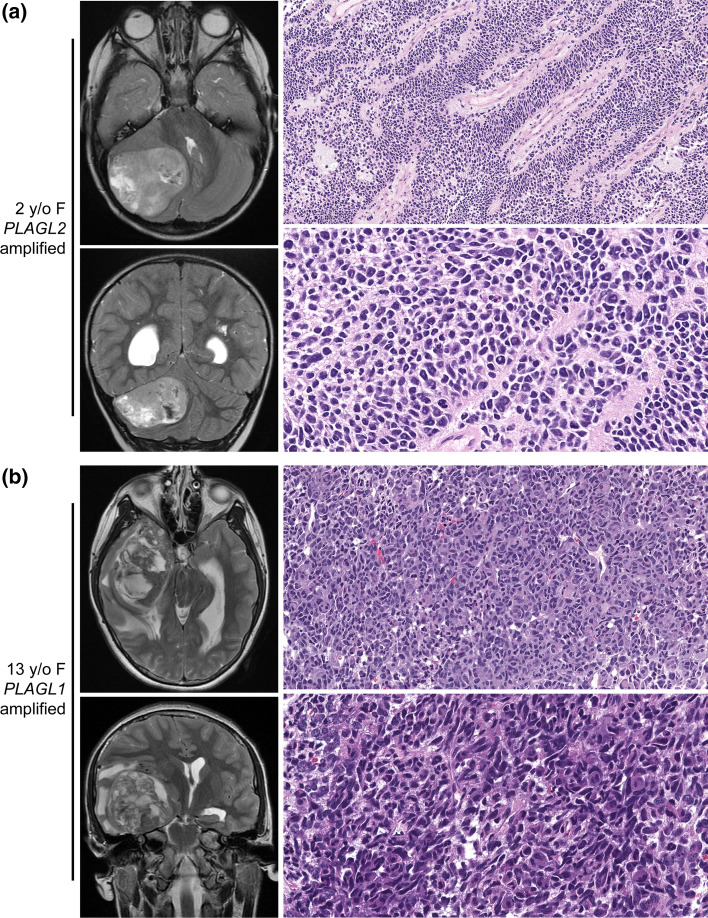
Pediatric central nervous system (CNS) tumors represent the most common cause of cancer-related death in children aged 0-14 years. They differ from their adult counterparts, showing extensive clinical and molecular heterogeneity as well as a challenging histopathological spectrum that often impairs accurate diagnosis. Here, we use DNA methylation-based CNS tumor classification in combination with copy number, RNA-seq, and ChIP-seq analysis to characterize a newly identified CNS tumor type. In addition, we report histology, patient characteristics, and survival data in this tumor type. We describe a biologically distinct pediatric CNS tumor type (n = 31 cases) that is characterized by focal high-level amplification and resultant overexpression of either PLAGL1 or PLAGL2, and an absence of recurrent genetic alterations characteristic of other pediatric CNS tumor types. Both genes act as transcription factors for a regulatory subset of imprinted genes (IGs), components of the Wnt/β-Catenin pathway, and the potential drug targets RET and CYP2W1, which are also specifically overexpressed in this tumor type. A derived PLAGL-specific gene expression signature indicates dysregulation of imprinting control and differentiation/development. These tumors occurred throughout the neuroaxis including the cerebral hemispheres, cerebellum, and brainstem, and were predominantly composed of primitive embryonal-like cells lacking robust expression of markers of glial or neuronal differentiation (e.g., GFAP, OLIG2, and synaptophysin). Tumors with PLAGL1 amplification were typically diagnosed during adolescence (median age 10.5 years), whereas those with PLAGL2 amplification were diagnosed during early childhood (median age 2 years). The 10-year overall survival was 66% for PLAGL1-amplified tumors, 25% for PLAGL2-amplified tumors, 18% for male patients, and 82% for female patients. In summary, we describe a new type of biologically distinct CNS tumor characterized by PLAGL1/2 amplification that occurs predominantly in infants and toddlers (PLAGL2) or adolescents (PLAGL1) which we consider best classified as a CNS embryonal tumor and which is associated with intermediate survival. The cell of origin and optimal treatment strategies remain to be defined.

Keywords: Molecular neuro-oncology; PLAGL1; PLAGL2; Pediatric cancer.


Conflict of interest statement

Stephen Yip is a member of advisory boards and has received honorarium from Amgen, AstraZeneca, Bayer, Incyte, and Roche. P. Wesseling, U. Schüller, A. Perry, F. Sahm, and D.A. Solomon are members of the Editorial Board of Acta Neuropathologica. They were not involved in the assessment or decision making for this manuscript.

Figures

Fig. 1
Fig. 1
DNA methylation clustering identifies a novel epigenetically distinct subtype of CNS embryonal tumor characterized by focal PLAG-family gene amplification. a Left: DNA methylation-based t-SNE analysis of > 90,000 pediatric and adult tumor samples. Circled are different medulloblastoma (MB) and embryonal tumor with multilayered rosettes (ETMR) subtypes, the ET, PLAGL type, and various low grade and high grade glioma subtypes—pilocytic astrocytoma (PA), pleomorphic Xanthoastrocytoma (PXA), H3 G34-mutant diffuse hemispheric glioma (G34), H3 K27-altered diffuse midline glioma (K27), diffuse pediatric-type high grade glioma, RTK subtype (pedRTK). Right: enlarged depiction of samples belonging to the ET, PLAGL type. The arrows mark two slightly outlying samples based on t-SNE. Methylation classes are color-coded as described in [12], grey color means the sample could not be matched to any of the existing methylation classes. b DNA methylation-based analysis using t-SNE dimensionality reduction on 33 ET, PLAGL tumors and a reference cohort of 910 different CNS tumors including 780 gliomas/glioneuronal tumors and 130 medulloblastomas. Methylation classes are color-coded and labeled using the respective group abbreviations. ET, PLAGL tumors are differentially colored according to their amplified PLAG-family gene. Two outlying ET, PLAGL samples are circled and marked with an arrow. Samples belonging to the ET, PLAGL type are depicted enlarged on the right. Full group names are: adult-type diffuse high grade glioma, IDH-wild type, subtype E (HGG_E), diffuse pediatric-type high grade glioma, RTK1 and 2 subtype (pedRTK1, pedRTK2), HGG-IDH wild type-subclass midline (HGG_MID), diffuse hemispheric glioma, H3 G34-mutant (G34), diffuse midline glioma, H3 K27-altered, subtype EGFR-altered (EGFR), diffuse midline glioma, H3 K27-altered (K27), glioblastoma, IDH-wild type, subtype posterior fossa (CBM), Glioblastoma, IDH-wild type, RTK1 and 2 subtype (RTK1, RTK2), Glioblastoma, IDH-wild type, mesenchymal subtype (MES), diffuse pediatric-type high grade glioma, MYCN subtype (pedMYCN), embryonal tumor, not otherwise specified (EMB), high-grade astrocytoma with piloid features (HGAP), Pleomorphic Xanthoastrocytoma (PXA), diffuse leptomeningeal glioneuronal tumor, subtype 1 and 2 (DLGNT_1, DLGNT_2), Medulloblastoma, SHH-activated (MB_SHH), Medulloblastoma, WNT-activated (MB_WNT), Medulloblastoma, non-WNT/non-SHH, Group 3 and 4 subtype (MBg34), Inflammatory microenvironment (LYMPH_HI), neuroepithelial tumor with PATZ1 fusion (PATZ), embryonal tumor with PLAG-family gene amplification (ET, PLAGL)
Fig. 2
Fig. 2
Copy number analysis of CNS embryonal tumors with PLAGL gene amplification. a Copy number summary plots were derived per subgroup for PLAGL1-amplified and PLAGL2-amplified tumors. b, c Chromosome 6 and chromosome 20 amplifications in ET, PLAGL tumors were verified using IGV. Samples are grouped according to their amplification status. b Shown are focal amplifications on chromosome 6 and chromosome 20 for PLAGL1 and PLAGL2, respectively. c Zooming in on the amplified regions around PLAGL1 and PLAGL2 (with co-amplification). d GISTIC amplification plot of all 31 samples belonging to the ET, PLAGL type. The genome is displayed vertically on the y-axis and genomic positions of amplified regions are indicated. Normalized amplification signals (G-score) and q values (log scale) are indicated on the X-axis on the top and bottom, respectively. The green line represents the significance cutoff (q value = 0.25)
Fig. 3
Fig. 3
Imaging and histologic features of CNS embryonal tumors with PLAGL gene amplification. Shown are pre-operative T2-weighted MR images and low/high resolution H&E-stained histology images of a a PLAGL2-amplified tumor in a 2-year-old female patient (#A110) and b a PLAGL1-amplified tumor in a 13-year-old female patient (#A387)
Fig. 4
Fig. 4
Immunohistochemical features of CNS embryonal tumors with PLAGL gene amplification. Shown are representative immunostains of a a PLAGL2-amplified tumor in a 1-year-old female patient and b a PLAGL1-amplified tumor in a 13-year-old female patient. c Summary of IHC results in PLAGL1/2-amplified tumor samples
Fig. 5
Fig. 5
Gene expression profiles of CNS embryonal tumors with PLAGL gene amplification. a, b Volcano plots showing fold-change and p-value for the comparison of differential gene expression of 11 PLAGL1/2-amplified tumors versus 117 embryonal tumors from different types and subtypes. Highlighted are a 86 human IGs (ocher) and 13 IGs with high connectivity (lilac) as described in reference [5]. Shown in black: selection of genes with large magnitude fold-changes (x axis) and high statistical significance (− log10 of p-value, y-axis). b Genes with differential expression in different brain regions and during different developmental states as described in reference [56] c Boxplots comparing gene expression between CNS tumor types for a select set of genes. The subset of 117 embryonal tumor samples (atrt, etmr, med) is identical to a and b. plagl, ET,PLAGL; pa, pilocytic astrocytoma; pxa, pleomorphic xanthoastrocytoma; hgg, high-grade gliomas (G34R/V, K27M, pedRTK1/2); norm, normal brain tissues; atrt, atypical teratoid rhabdoid tumor; etmr, embryonal tumor with multilayered rosettes; med, medulloblastomas (WNT, SHH, group 3, group 4); red: samples with PLAGL1 amplification, blue: samples with PLAGL2 amplification. Significance bars indicate groups whose differences in gene expression are statistically significant when compared to samples with PLAGL1/2 amplification (t-test, Bonferroni-corrected p-value = 0.00714286). PLAGL1/2 upregulation is statistically significant compared to all other groups when looking at PLAGL1 or PLAGL2 tumors separately
Fig. 6
Fig. 6
Clinical outcomes of patients with CNS embryonal tumor with PLAGL gene amplification. a Kaplan–Meier plots showing OS and PFS stratified by subgroup and sex. The log-rank test was used to show differences between the curves, p-values of the log-rank test are shown in each graph. b Swimmer plot showing available OS and PFS times per patient, including treatment information and clinical response/relapse. Samples are stratified by sex, PLAGL1/2 amplification status is indicated. Information about surgical resection (SUR) and presence of metastasis (MET) at the time point of primary diagnosis is displayed in the squares on the left where available (resections or metastases at later time points are not displayed), GTR, gross total resection; STR, subtotal resection; RES, resection (unknown, if GTR or STR). Information about chemotherapy (CT) and radiotherapy (RT) treatment regarding the entire follow-up time is displayed in the squares on the left where available

References

    1. Central Nervous System Tumours (2021) WHO classification of tumours, 5th edition, volume 6. Edited by the WHO Classification of Tumours Editorial Board. 2021: International Agency for Research on Cancer
    1. Abdollahi A. LOT1 (ZAC1/PLAGL1) and its family members: mechanisms and functions. J Cell Physiol. 2007;210(1):16–25. doi: 10.1002/jcp.20835. - DOI - PubMed
    1. Abdollahi A, Pisarcik D, Roberts D, Weinstein J, Cairns P, Hamilton TC. LOT1 (PLAGL1/ZAC1), the candidate tumor suppressor gene at chromosome 6q24-25, is epigenetically regulated in cancer. J Biol Chem. 2003;278(8):6041–6049. doi: 10.1074/jbc.M210361200. - DOI - PubMed
    1. Adnani L, Dixit R, Chen X, Balakrishnan A, Modi H, Touahri Y, et al. Plag1 and Plagl2 have overlapping and distinct functions in telencephalic development. Biol Open. 2018 doi: 10.1242/bio.038661. - DOI - PMC - PubMed
    1. Al Adhami H, Evano B, Le Digarcher A, Gueydan C, Dubois E, Parrinello H, et al. A systems-level approach to parental genomic imprinting: the imprinted gene network includes extracellular matrix genes and regulates cell cycle exit and differentiation. Genome Res. 2015;25(3):353–367. doi: 10.1101/gr.175919.114. - DOI - PMC - PubMed

Publication types