Review
. 2023 Mar;50(4):1051-1083.
doi: 10.1007/s00259-022-05997-1. Epub 2022 Nov 28.

In vivo methods for imaging blood-brain barrier function and dysfunction

Affiliations
Review

In vivo methods for imaging blood-brain barrier function and dysfunction

William James Harris et al. Eur J Nucl Med Mol Imaging. 2023 Mar.

Abstract

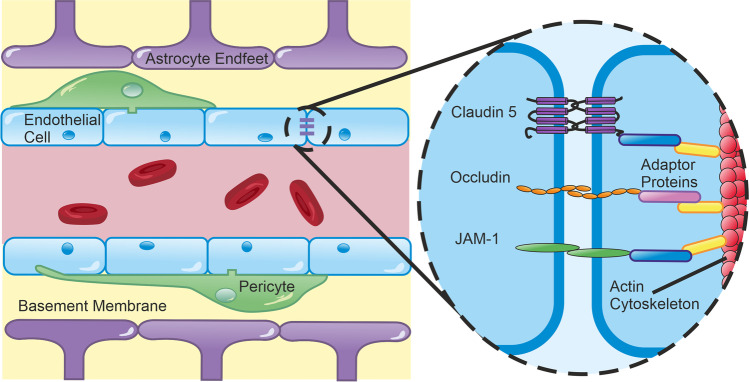
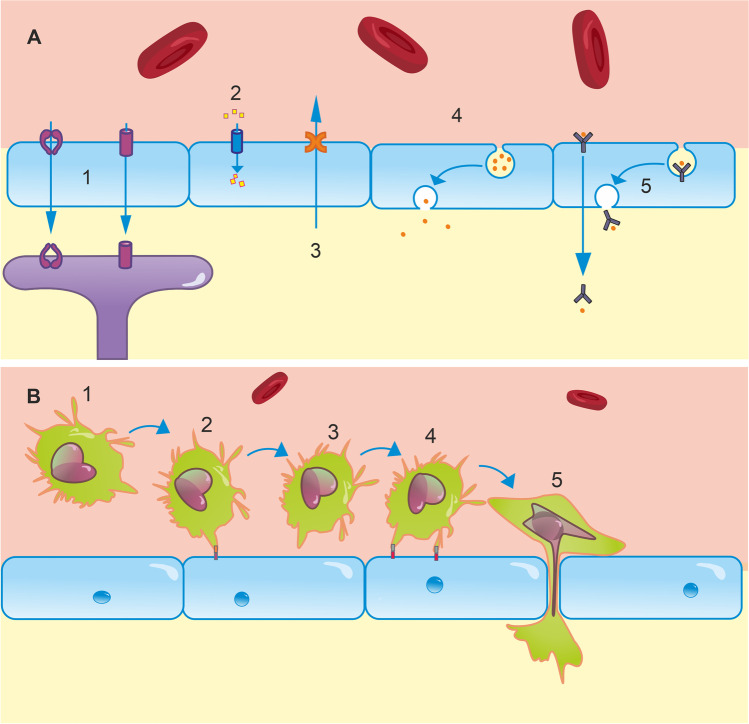
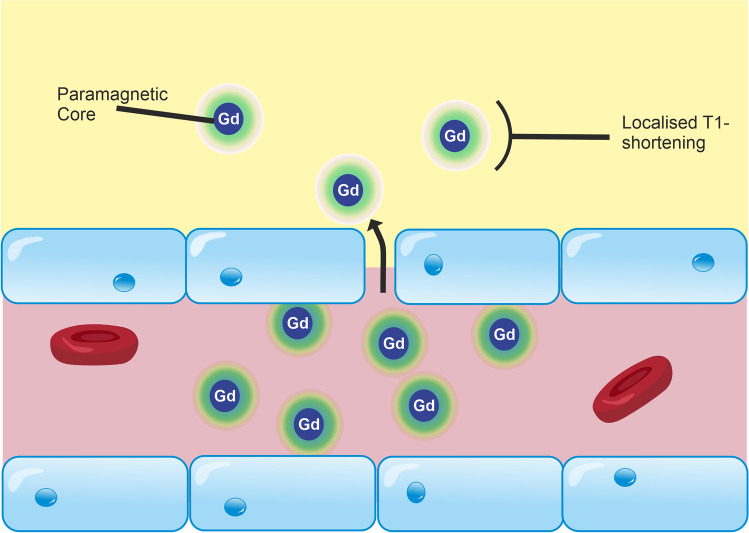
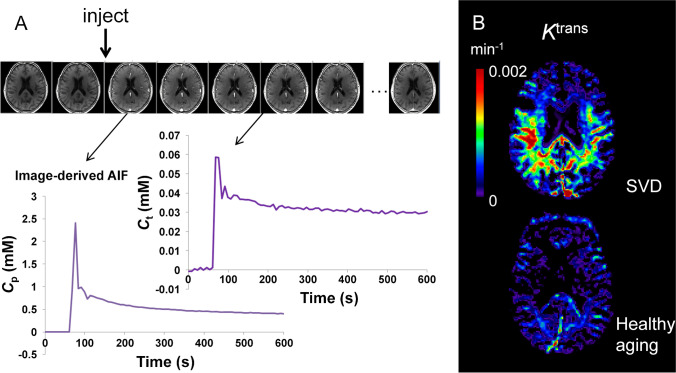
The blood-brain barrier (BBB) is the interface between the central nervous system and systemic circulation. It tightly regulates what enters and is removed from the brain parenchyma and is fundamental in maintaining brain homeostasis. Increasingly, the BBB is recognised as having a significant role in numerous neurological disorders, ranging from acute disorders (traumatic brain injury, stroke, seizures) to chronic neurodegeneration (Alzheimer's disease, vascular dementia, small vessel disease). Numerous approaches have been developed to study the BBB in vitro, in vivo, and ex vivo. The complex multicellular structure and effects of disease are difficult to recreate accurately in vitro, and functional aspects of the BBB cannot be easily studied ex vivo. As such, the value of in vivo methods to study the intact BBB cannot be overstated. This review discusses the structure and function of the BBB and how these are affected in diseases. It then discusses in depth several established and novel methods for imaging the BBB in vivo, with a focus on MRI, nuclear imaging, and high-resolution intravital fluorescence microscopy.

Keywords: Alzheimer’s disease; BBB; Dementia; Imaging; MRI; Metabolic imaging; Neuroimaging; PET; Stroke.


Conflict of interest statement

The authors declare no competing interests.

Figures

Fig. 1
Fig. 1
Structural Elements of the BBB. Endothelial cells are the principal component of the BBB, expressing an array of tight junctions, adherens junctions, and junctional adhesion molecules which restrict large molecules from diffusing between cells. These proteins are tethered to the actin cytoskeleton by adaptor proteins, such as ZO-1. Pericytes extend processes along and around vessels. These physically attach to endothelial cells via peg-and-socket junctions, which contribute to BBB formation and maintenance and may also actively modulate microvascular tone. Astrocytes extend endfeet to wrap cerebral vasculature. These form the glia limitans, a key element in the neurovascular unit, mediating neural control of regional blood supply and transport of a wide array of molecules and ions between circulation and neurones. The basement membrane is formed of proteins, such as laminins and collagen-IV, which are secreted by endothelium, pericytes, and astrocytes. The basement membrane is essential for BBB maintenance and is the rate-limiting step in leukocyte extravasation
Fig. 2
Fig. 2
Transport mechanisms at the BBB. A (1) An array of transporters are expressed for a number of molecules in endothelial cells. For example, GLUT1 facilitates glucose transport from the blood to the brain down its concentration gradient. Astrocyte endfeet also express a variety of these, including a 45-kDa isoform of GLUT1, and AQP4, which regulates water uptake. (2) Ion channels in the endothelium regulate the transport of numerous ions including Na+, K+, Cl, HCO3, and Ca.2+. These support neural function and dysregulation contributes to pathologies including oedema. (3) The BBB is also fundamental in clearance of neurotoxic compounds via efflux transporters, such as P-gp and LRP1. P-gp and LRP1 dysfunction has been implicated in amyloid burden in AD. (4) Brain endothelial cells are capable of bulk transport via lipid raft invaginations known as caveolae, which play a key role in focused ultrasound-enhanced BBB permeability [32]. (5) Receptor-mediated transcytosis is a final mechanism of transport, typically responsible for transporting peptides and proteins, such as insulin, into the brain. B (1) At resting state, leukocytes circulate in blood and are excluded from the brain by the BBB. To enter the brain, a complex series of molecular interactions must occur [33]. (2) Rolling: endothelial receptors, e.g. E- and P-selectin, are upregulated in inflammatory states. Leukocyte plasma membrane glycoproteins bind to these, which allows them to roll along the endothelium to the site of inflammation [38]. Due to significantly reduced blood flow in the postcapillary venules of inflamed regions, these interactions are most likely to occur in postcapillary venules, rather than at other levels of the arteriovenous axis. (3) Leukocyte activation: Rolling brings leukocytes into close proximity with other inflammatory agents on the luminal surface of the endothelium. These agents activate G protein-coupled receptors, initiating intracellular cascades in leukocytes, which activate integrins expressed on leukocyte plasma membranes [33]. (4) Adhesion: integrins typically bind to extracellular matrix proteins secreted by endothelial cells, such as ICAM-1, VCAM-1, and PECAM-1 [39]. This tight binding halts rolling. Leukocytes crawl along the endothelium to cell borders either with or against the direction of blood flow. (5) Diapedesis: leukocytes cross the BBB between or through endothelial cells. This is dependent on homophilic interactions between receptors on leukocytes and those on endothelial cells, basement membrane, and pericytes [33]
Fig. 3
Fig. 3
Leakage of GBCA across the BBB in DCE-MRI. DCE-MRI uses an intravenous injection of T1-shortening GBCAs. Under normal conditions, GBCA molecules are restricted from the CNS by the BBB. Inflammation reduces the junctional expression of TJ proteins in endothelial cells, which increases the size of molecules that are able to cross the BBB. As a result, GBCA molecules are able to permeate the CNS. These molecules consist of a paramagnetic core, which interacts with adjacent water molecules to increase the rate of T1 relaxation, which is detected as a signal enhancement on T1-weighted MRI. By scanning dynamically and applying kinetic models to the change in signal over time, the leakage rate of GBCA can be estimated and used as a measure of paracellular integrity
Fig. 4
Fig. 4
Dynamic contrast-enhanced MRI for the estimation of contrast agent leakage rate (Ktrans) across the BBB. A Gadolinium-based contrast agent is injected during dynamic collection of T1-weighted images. The contrast agent enhances the signal, first in the blood, and later in the tissue as the contrast agent leaks across the BBB. The concentration of contrast agent in the blood plasma (Cp) of a feeding artery and each tissue voxel (Ct) can be measured over time. A kinetic model is fitted to this data in order to calculate Ktrans in each voxel of the brain. B Example Ktrans images in a patient with small vessel disease (SVD) aged 73 years (top) and a woman with no health problems aged 68 years (bottom). Elevated Ktrans can be seen in SVD, predominantly in the white matter. Note that the dynamic series of images in A is from the gentleman with cSVD shown in B. The images kindly provided by Dr Laura Parkes were taken from a study acquiring DCE-MRI data in people with Parkinson’s disease and/or cerebrovascular disease [186]
Fig. 5
Fig. 5
Tracer kinetic models for subtle BBB leakage. Two common models for estimating gadolinium leakage across the BBB rely on different assumptions and are appropriate in different contexts. The Patlak model assumes that backflux of the compound of interest into the blood is negligible during the timeframe of the imaging experiment, a condition that is met when leakage is very low such that the concentration of contrast agent in plasma (Cp) is always in significant excess of that in tissue (Ce). The extended Tofts model allows for some backflux of tracer into the blood (represented by the constant, kep, which is equal to Ktrans/ve, where ve is the extravascular extracellular volume fraction), and is considered a more suitable model in cases of more significant BBB impairment
Fig. 6
Fig. 6
Dynamic glucoCESL MRI for the estimation of glucose transport across the BBB. A D-glucose is injected during the dynamic collection of R-weighted images. This enhances the signal, first in the blood, and later in the tissue as the glucose is transported across the BBB. At each tissue voxel, the change in glucose concentration from baseline (ΔCt) over time is calculated from the change in R using known R relaxivity of glucose, usually measured before the experiment in a test object. A kinetic model can be fitted to this data in order to calculate the maximal rate of transport (Tmax) and the half-saturation constant of the glucose transporters (Kt) in each voxel of the brain [240]. B Example Tmax and Kt images in a Sprague–Dawley rat (unpublished data)
Fig. 7
Fig. 7
Different markers indicate different aspects of BBB function/dysfunction. A Tight junctions restrict the majority of molecules from crossing the BBB. Detection of molecules such as dextrans and fibrinogen is generally considered to indicate that these junctions are impaired, as these molecules do not have specific transport mechanisms. B Molecules such as glucose and amino acids have specific transport proteins, so alterations in the transport of these substances may indicate disruption to these mechanisms. Alternatively, they may indicate changes to free diffusion resulting from tight junction impairment. C Very small molecules, such as water, are able to cross the BBB even when junctions are intact, although the rate of exchange increases when junction integrity is compromised. Water is also a cofactor for many transport proteins, including GLUT1. These numerous routes of movement across the BBB complicate the interpretation of readouts from water-exchange techniques
Fig. 8
Fig. 8
Parametric maps of the plasma-to-brain transport rate constant K1 of the P-glycoprotein (P-gp) substrate PET tracer (R)-[11C]verapamil estimated from the single-tissue compartment model with blood volume using a metabolites-corrected plasma input function. Administration of the P-gp inhibitor Tariquidar at 2 mg/kg increased brain uptake by 54% compared to baseline in this 36-year-old healthy male volunteer. The images kindly provided by Dr Marie-Claude Asselin were acquired as part of the EURIPIDES study [267]
Fig. 9
Fig. 9
Parametric maps from [18F]fluorodeoxyglucose brain PET scans in an AD subject (right column) and a control participant (left column) calculated with spectral analysis [285]. The top row shows the values of the impulse response function at 1 min which are similar (although not identical) to the plasma-to-brain transport rate constant K1. In the bottom row, regional cerebral metabolic rates of glucose are shown with clearly lower rates in the cortical grey matter of the AD subject than the control participant. As a characteristic imaging feature, the glucose hypometabolism is particularly noticeable in the parietal cortex of the AD subject with marked left–right asymmetry. In contrast to rCMRglc, the differences between the two IRF1min images are much smaller. Images reproduced by courtesy of Edison et al. [286]
Fig. 10
Fig. 10
Increased BBB permeability imaged with intravital two-photon microscopy following acute experimental stroke. Changes in BBB permeability after experimental stroke: Mice were injected via tail vein with fluorescent dextran 3 kDa (green) and albumin (red). Before the procedure (A) and 45 min after acute middle cerebral artery occlusion (B), both the dextran and albumin are detected mainly in the vessel resulting in yellow appearance. In the following 2 h, there is an increase in the BBB permeability with the green dextran leaking into parenchyma while the red albumin stays inside the vessel (C). In vivo imaging using two-photon microscopy, Schiessl lab. Unpublished data

References

    1. Villabona-Rueda A, Erice C, Pardo CA, Stins MF. The evolving concept of the blood brain barrier (BBB): from a single static barrier to a heterogeneous and dynamic relay center. Front Cell Neurosci. 2019;13:405. doi: 10.3389/fncel.2019.00405. - DOI - PMC - PubMed
    1. Kadry H, Noorani B, Cucullo L. A blood–brain barrier overview on structure, function, impairment, and biomarkers of integrity. Fluids Barriers CNS. 2020;17:1–24. doi: 10.1186/s12987-020-00230-3. - DOI - PMC - PubMed
    1. Zlokovic BV. The blood-brain barrier in health and chronic neurodegenerative disorders. Neuron. 2008;57:178–201. doi: 10.1016/j.neuron.2008.01.003. - DOI - PubMed
    1. Thomsen MS, Routhe LJ, Moos T. The vascular basement membrane in the healthy and pathological brain. J Cereb Blood Flow Metab. 2017;37:3300–3317. doi: 10.1177/0271678X17722436. - DOI - PMC - PubMed
    1. Petersen MA, Ryu JK, Akassoglou K. Fibrinogen in neurological diseases: mechanisms, imaging and therapeutics. Nat Rev Neurosci. 2018;19:283–301. doi: 10.1038/nrn.2018.13. - DOI - PMC - PubMed