. 2022 Nov 27;17(1):58.
doi: 10.1186/s40793-022-00453-x.

Expanding known viral diversity in plants: virome of 161 species alongside an ancient canal

Affiliations

Expanding known viral diversity in plants: virome of 161 species alongside an ancient canal

Shixing Yang et al. Environ Microbiome. .

Abstract

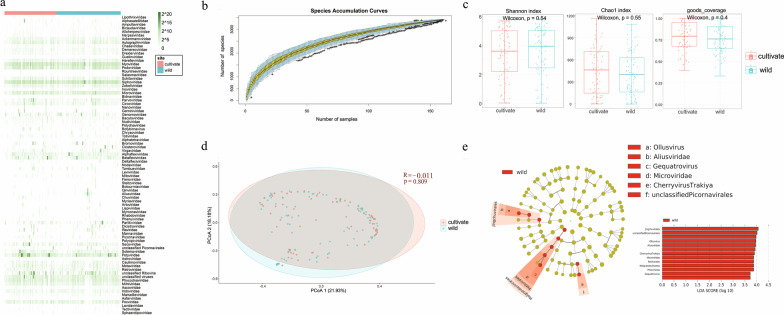
Background: Since viral metagenomic approach was applied to discover plant viruses for the first time in 2006, many plant viruses had been identified from cultivated and non-cultivated plants. These previous researches exposed that the viral communities (virome) of plants have still largely uncharacterized. Here, we investigated the virome in 161 species belonging to 38 plant orders found in a riverside ecosystem.

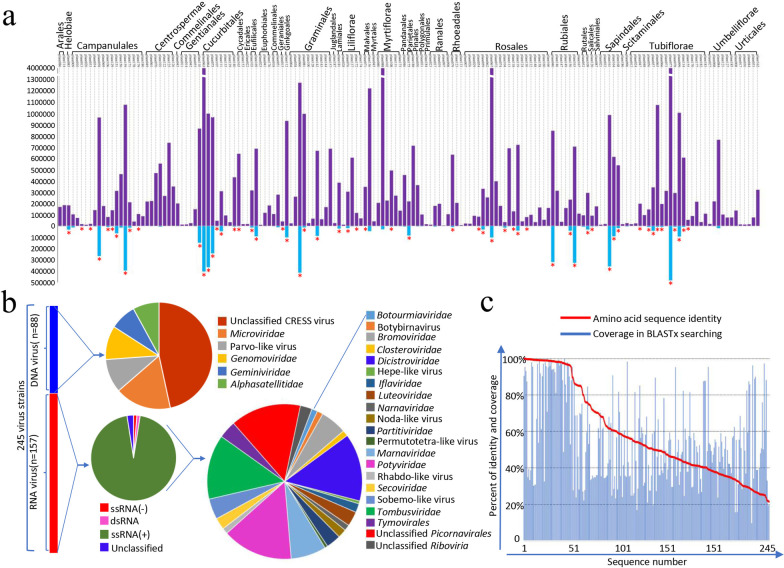
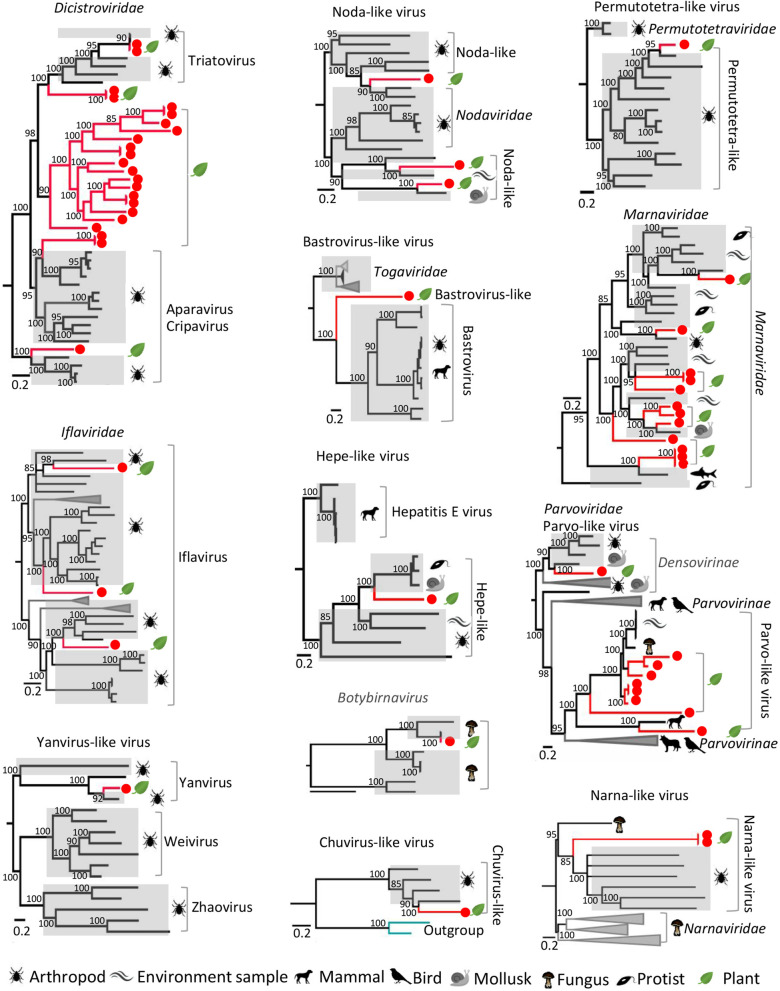
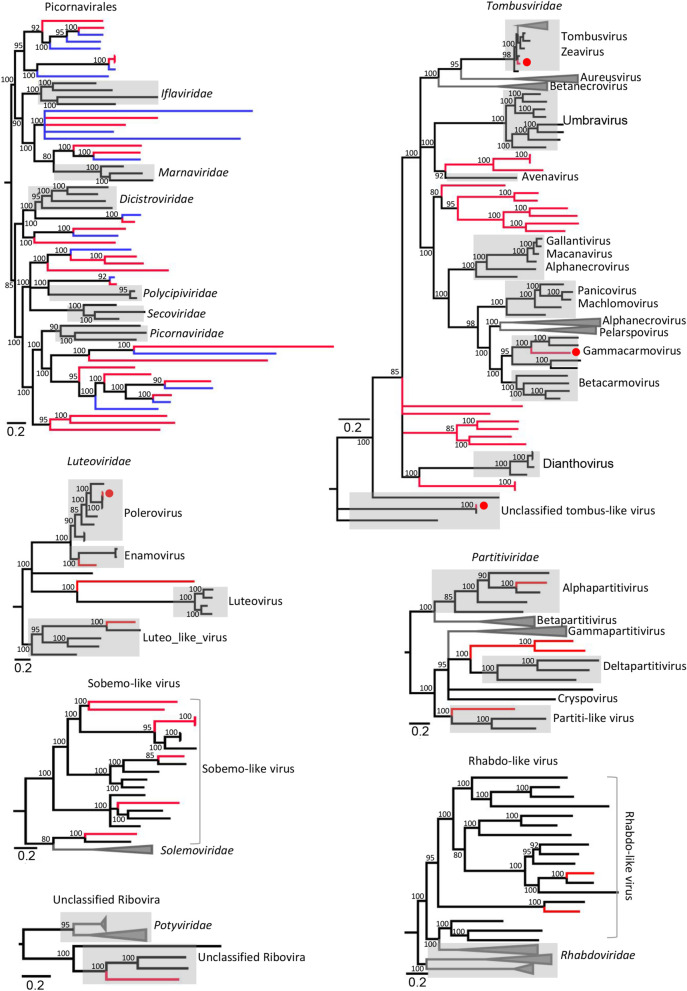
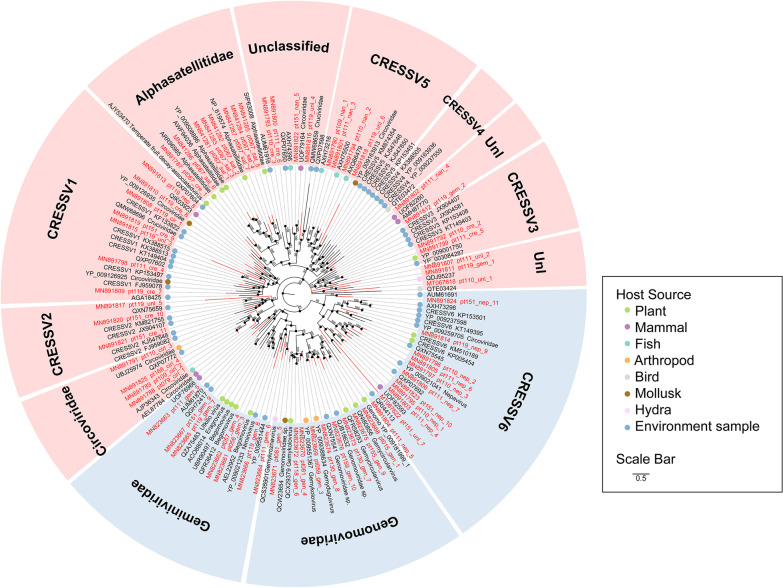
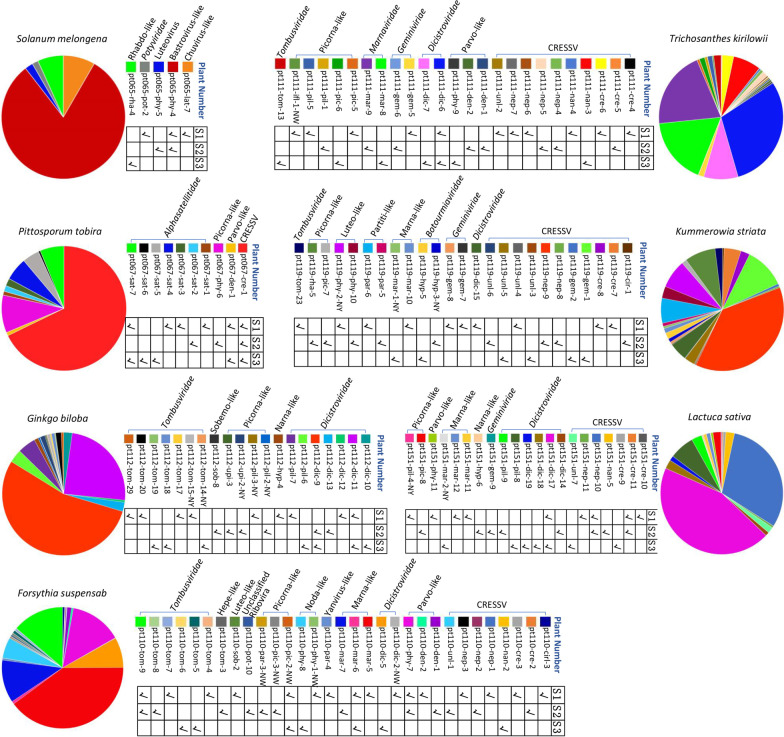
Results: We identified 245 distinct plant-associated virus genomes (88 DNA and 157 RNA viruses) belonging to 27 known viral families, orders, or unclassified virus groups. Some viral genomes were sufficiently divergent to comprise new species, genera, families, or even orders. Some groups of viruses were detected that currently are only known to infect organisms other than plants. It indicates a wider host range for members of these clades than previously recognized theoretically. We cannot rule out that some viruses could be from plant contaminating organisms, although some methods were taken to get rid of them as much as possible. The same viral species could be found in different plants and co-infections were common.

Conclusions: Our data describe a complex viral community within a single plant ecosystem and expand our understanding of plant-associated viral diversity and their possible host ranges.

Keywords: Co-infection; Phylogenetic analysis; Phytocommunity; Plant virome; Virus host switching.


Conflict of interest statement

The authors declare that they have no competing interests.

Figures

Fig. 1
Fig. 1
Identification of viruses in different species of plants. a The abundance of plant-associated viruses in different species of plant. The top graph shows the total number of unique reads in each library. The library IDs are shown on top of each bar, while the host Orders are shown above the bar graph. The bottom graph shows the number of virus hits passed NR filter in viral metagenomic bioinformatic analysis. The red asterisk shows those libraries from which we have determined complete or nearly complete genome of viruses. b The number and diversity of plant-associated viruses. The left histogram shows the numbers of DNA viruses (blue bar) and RNA viruses (red bar). The right pie charts show the virus classification identified in this study. c The amino acid sequence identity and coverage of plant-associated viruses with the best matched virus strains in BLASTx searching based on the 245 complete genome sequence determined in plant species
Fig. 2
Fig. 2
Analysis of virus community diversity in cultivated and wild plants. a Taxonomic analyses at the family level. The heatmap shows the reads counts of each virus family on a log2 scale. Plant types are indicated by the corresponding colors (see color legend). The row name on the right represents the name of the virus family. b Species accumulation curve. The abscissa represents the number of libraries, and the ordinate represents the number of species found. The blue shading indicates the 95% confidence interval. c Comparison of alpha diversity between the two groups (Shannon index, Chao1 index, and goods_coverage). The horizontal bars inside boxes represent medians. The tops and bottoms of boxes represent the 75th and 25th percentiles, respectively. The upper and lower whiskers extend to data no more than 1.5 × the interquartile range from the upper edge and lower edge of the box, respectively. The plant types are indicated with the corresponding colors (see color legend). d Principal coordinates (PCoA) analysis. The PCoA analysis shows the differences in species composition based on the Bray–Curtis ecological distance matrix. The P-value is calculated by ANOSIM. e Linear discriminant analysis Effect Size (Lefse). Circles radiating from inside to outside represent taxonomic classes from phylum to genus. Each small circle at a different taxonomic level represents a taxon at that level, and the small circle diameter size is proportional to the relative abundance size. Species without significant difference are uniformly colored yellow, and differential species Biomarker follows the group for staining. Red nodes indicate microbial groups that play an important role in red groups. Only taxa with LDA values of 3.0 or higher are shown
Fig. 3
Fig. 3
Phylogenies of viral genomes identified from plants. Twelve Bayesian inference trees were constructed using MrBayes v3.2 based on virus RdRp domain of RNA viruses or NS protein of parvovirus-like viruses, within each tree, the viruses found in this study are marked with red line. Hosts are indicated with different silhouette of mammal, bird, arthropod, plant leaf, or waves standing for virus environmental source. The name of the virus family or genus is shown on the right side of each cluster. Each scale bar indicates 0.5 amino acid substitutions per site. The posterior probability scores is labelled on each nodes of the phylogenetic tree as the percentage value
Fig. 4
Fig. 4
The phylogenies of potentially new viruses. Seven Bayesian inference trees were constructed using MrBayes v3.2 based on virus RdRp domains, within each tree, the viruses found in this study are marked with red line. In the phylogenetic tree of Picornavirales the best matched virus based BLASTp searching using RdRp sequence of each novel virus are labeled with blue color. The name of the virus family or genus is shown on the right side of each cluster. Each scale bar indicates 0.2 amino acid substitutions per site. The posterior probability scores is labelled on each nodes of the phylogenetic tree as the percentage value
Fig. 5
Fig. 5
The phylogenetic tree of potentially new CRESS DNA viruses. The phylogenetic tree was established using MrBayes v3.2 based on Rep amino acid sequences, and the viruses found in this study are indicated by red lines. The host source of reference sequences are marked with corresponding colors (see color legend). Different virus groups are labeled on the diagram. The size of the black dots on nodes is positively correlated with the corresponding bootstrap score. The scale bar indicates 0.5 amino acid substitutions per site. The posterior probability scores is labelled on each nodes of the phylogenetic tree as the percentage value
Fig. 6
Fig. 6
Co-infecting viruses in plants. Pie charts describe the viruses with complete genome in those libraries containing more than 3 different viruses. Sector area in each pie chart represents the proportion of the number of reads mapped to the complete viral genome in the library. Three individual plant in the same plant species are marked with S1, S2 and S3, respectively. Check marks below virus names show positive of virus in (RT-)PCR screening

References

    1. Roossinck MJ. Symbiosis versus competition in plant virus evolution. Nat Rev Microbiol. 2005;3:917–924. doi: 10.1038/nrmicro1285. - DOI - PubMed
    1. Roossinck MJ, Martin DP, Roumagnac P. Plant virus metagenomics: advances in virus discovery. Phytopathology. 2015;105:716–727. doi: 10.1094/PHYTO-12-14-0356-RVW. - DOI - PubMed
    1. Wu Q, Ding S-W, Zhang Y, Zhu S. Identification of viruses and viroids by next-generation sequencing and homology-dependent and homology-independent algorithms. Annu Rev Phytopathol. 2015;53:425–444. doi: 10.1146/annurev-phyto-080614-120030. - DOI - PubMed
    1. Li L, Deng X, Mee ET, Collot-Teixeira S, Anderson R, Schepelmann S, et al. Comparing viral metagenomics methods using a highly multiplexed human viral pathogens reagent. J Virol Methods. 2015;213:139–146. doi: 10.1016/j.jviromet.2014.12.002. - DOI - PMC - PubMed
    1. Wang Y, Yang S, Liu D, Zhou C, Li W, Lin Y, et al. The fecal virome of red-crowned cranes. Arch Virol. 2019;164:3–16. doi: 10.1007/s00705-018-4037-x. - DOI - PMC - PubMed

LinkOut - more resources