Meta-Analysis
. 2023 Mar;102(3):349-356.
doi: 10.1177/00220345221132268. Epub 2022 Nov 27.

Novel Genetic Determinants of Dental Maturation in Children

Affiliations
Meta-Analysis

Novel Genetic Determinants of Dental Maturation in Children

O Grgic et al. J Dent Res. 2023 Mar.

Abstract

Dental occlusion requires harmonious development of teeth, jaws, and other elements of the craniofacial complex, which are regulated by environmental and genetic factors. We performed the first genome-wide association study (GWAS) on dental development (DD) using the Demirjian radiographic method. Radiographic assessments from participants of the Generation R Study (primary study population, N1 = 2,793; mean age of 9.8 y) were correlated with ~30 million genetic variants while adjusting for age, sex, and genomic principal components (proxy for population stratification). Variants associated with DD at genome-wide significant level (P < 5 × 10⁻⁸) mapped to 16q12.2 (IRX5) (lead variant rs3922616, B = 0.16; P = 2.2 × 10⁻⁸). We used Fisher's combined probability tests weighted by sample size to perform a meta-analysis (N = 14,805) combining radiographic DD at a mean age of 9.8 y from Generation R with data from a previous GWAS (N2 = 12,012) on number of teeth (NT) in infants used as proxy of DD at a mean age of 9.8 y (including the ALSPAC and NFBC1966). This GWAS meta-analysis revealed 3 novel loci mapping to 7p15.3 (IGF2BP3: P = 3.2 × 10⁻⁸), 14q13.3 (PAX9: P = 1.9 × 10⁻⁸), and 16q12.2 (IRX5: P = 1.2 × 10⁻⁹) and validated 8 previously reported NT loci. A polygenic allele score constructed from these 11 loci was associated with radiographic DD in an independent Generation R set of children (N = 703; B = 0.05, P = 0.004). Furthermore, profiling of the identified genes across an atlas of murine and human stem cells observed expression in the cells involved in the formation of bone and/or dental tissues (>0.3 frequency per kilobase of transcript per million mapped reads), likely reflecting functional specialization. Our findings provide biological insight into the polygenic architecture of the pediatric dental maturation process.

Keywords: GWAS; child health; gene expression; odontogenesis; tooth calcification; tooth eruption.


Conflict of interest statement

The authors declared no potential conflicts of interest with respect to the research, authorship, and/or publication of this article.

Figures

Figure 1.
Figure 1.
Manhattan plot of association statistics for dental development in the joint meta-analysis (2,216,657 single-nucleotide polymorphisms [SNPs] tested; N = 14,805). Each dot represents 1 SNP. The x-axis is its chromosomal position-build 37 NCBI; on the y-axis, the –log10 (P value) is reported. Horizontal grey/grey dotted lines mark the genome-wide significant (GWS) threshold (P < 5 × 10−8) and suggestive threshold (P < 1 × 10−5), respectively. SNPs that were GWS in a previously published meta-analysis investigating number of teeth (NT) are colored in red. Q-Q plot (in the upper left corner) is obtained from the joint meta-analysis; the plot shows the distribution expected against observed P values, and the diagonal red line represents the null distribution.
Figure 2.
Figure 2.
Regional plots for 3 novel loci associated with dental development: 16q12.2 (A), 7p15.3 (B), and 14q13.3 (C). The lead variant in the locus is presented as a purple diamond and the flanking variants as circles in different colors according to the level of their linkage disequilibrium (LD) with the lead variant. The x-axis shows all the genes in the region in the window of ±500 Kb from the lead variant. The y-axis presents the –log10 (P value). Regional plot was created using http://locuszoom.org.
Figure 3.
Figure 3.
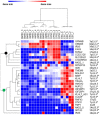
Heatmap representation of expression patterns of the genes mapping to genome-wide significant (GWS) loci reported in the joint meta-analysis across ameloblasts and osteoblasts. Expression is measured by RNA sequencing analysis with values expressed as frequency per kilobase of transcript per million mapped reads (FPKM). Expression of the genes was available for 3 samples per cell line. Gene expression level is shown in the legend, with the darkest blue representing the lowest expression in a certain row (gene min) and the darkest red the highest expression in that row (gene max). Gene clusters are marked with dots (cluster 1, black dot; cluster 2, green dot). The cytogenetic band is presented next to each gene. *Genes in the novel loci. Expression from SLC25A21 (14q13.3), NKX2-1 (14q13.3), STK31 (7p15.3), and IRX6 (16q12.2) was below the detection threshold in both cell lines. Figure was created in https://software.broadinstitute.org/morpheus/.
Figure 4.
Figure 4.
Heatmap representation of expression patterns of the genes mapping to genome-wide significant (GWS) loci reported in the joint meta-analysis across 4 types of cell lines. Expression measured by RNA sequencing analysis with values expressed as frequency per kilobase of transcript per million mapped reads (FPKM). Expression of the genes was available for 5 donors for every cell line. Gene expression level is shown in the legend, with the darkest blue representing the lowest expression in a certain row (gene min) and the darkest red the highest expression in that row (gene max). Gene clusters are marked with dots (cluster 1, black dot; cluster 2, green dot). The cytogenetic band is presented next to each gene. *Genes in the novel loci. Expression from IRX6 (16q12.2), STK31 (7p15.3), CLK2P (7p15.3), KLHL7-AS1 (7p15.3), RPS2P32 (7p15.3), NKX2-1 (14q13.3), NKX2-8 (14q13.3), and SFTA3 (14q13.3) was close to the detection threshold in all cell lines. AMSC, adipose tissue–derived mesenchymal stromal cell; BMSC, bone marrow stromal cell; DPSC, dental pulp stem cell; ESC, embryonic stem cell. Figure was created in https://software.broadinstitute.org/morpheus/.

References

    1. Bonnard C, Strobl AC, Shboul M, Lee H, Merriman B, Nelson SF, Ababneh OH, Uz E, Guran T, Kayserili H, et al.. 2012. Mutations in IRX5 impair craniofacial development and germ cell migration via SDF1. Nat Genet. 44(6):709–713. - PubMed
    1. Cardoso HFV, Heuzé Y, Júlio P. 2010. Secular change in the timing of dental root maturation in Portuguese boys and girls. Am J Hum Biol. 22(6):791–800. - PubMed
    1. Danze A, Jacox LA, Bocklage C, Whitley J, Moss K, Hardigan P, Garcia-Godoy CE, Jackson TH. 2021. Influence of BMI percentile on craniofacial morphology and development in children and adolescents. Eur J Orthod. 43(2):184–192. - PubMed
    1. Demirjian A, Goldstein H, Tanner JM. 1973. A new system of dental age assessment. Hum Biol. 45(2):211–227. - PubMed
    1. Demirjian A, Levesque G.1980. Sexual differences in dental development and prediction of emergence. J Dent Res. 59(7):1110–1122. - PubMed

Publication types