

Flavonoids and Devosia sp SL43 cell-free supernatant increase early plant growth under salt stress and optimal growth conditions
- PMID: 36438103
- PMCID: PMC9690568
- DOI: 10.3389/fpls.2022.1030985
Flavonoids and Devosia sp SL43 cell-free supernatant increase early plant growth under salt stress and optimal growth conditions
Abstract
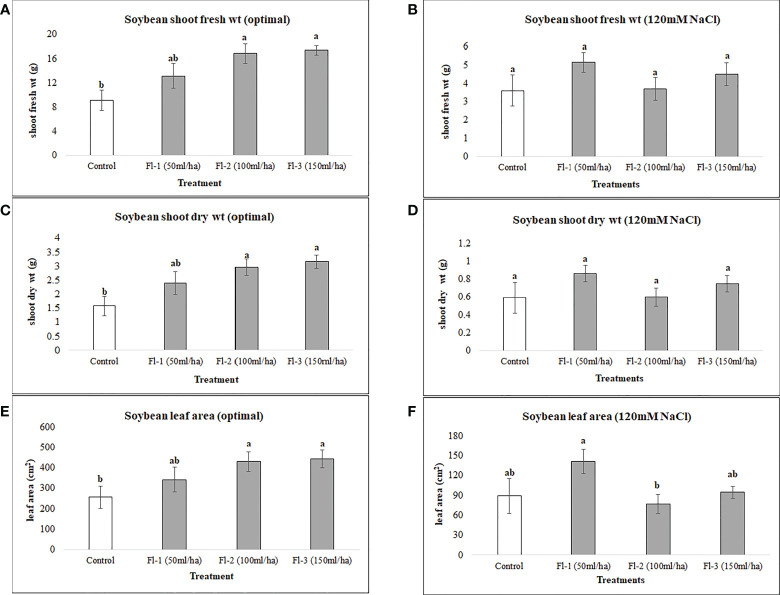
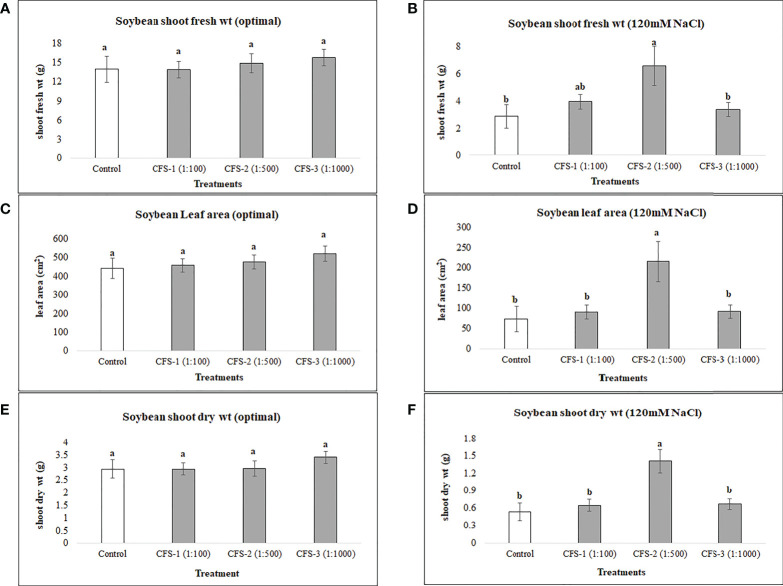
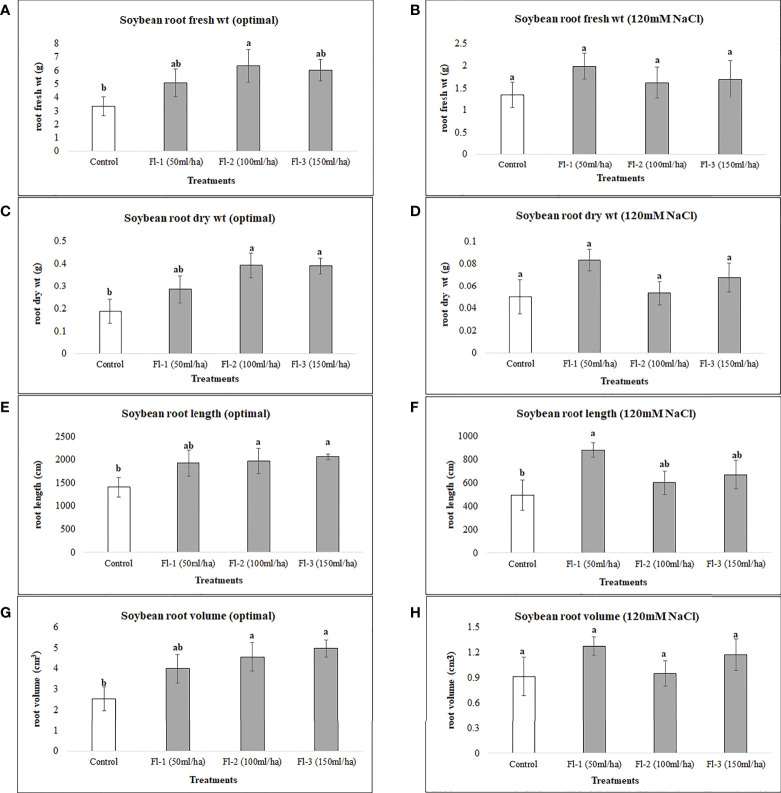
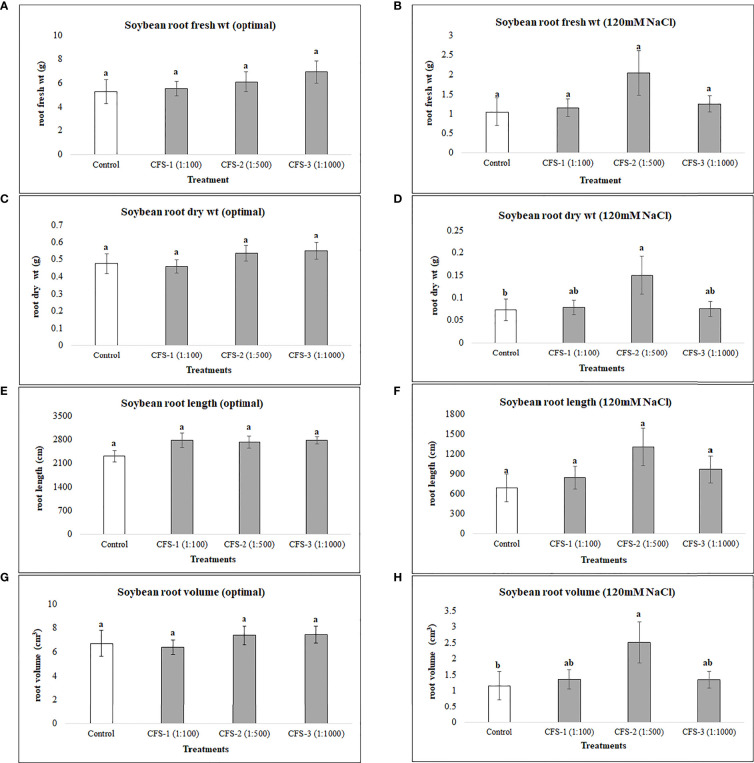
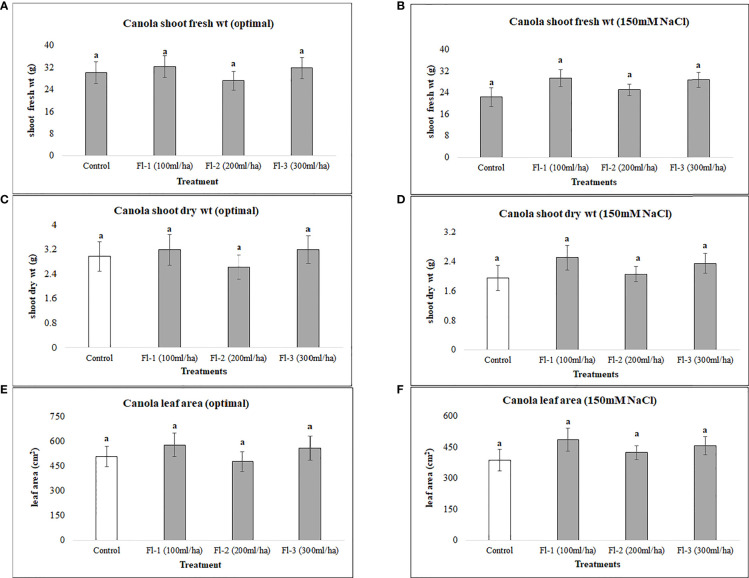
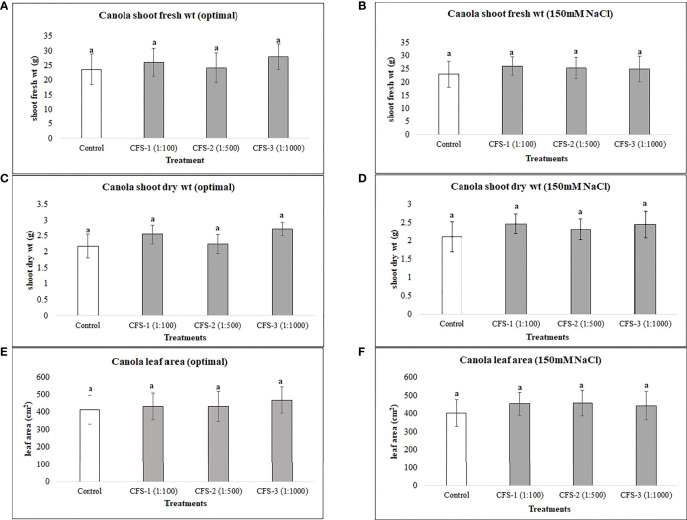
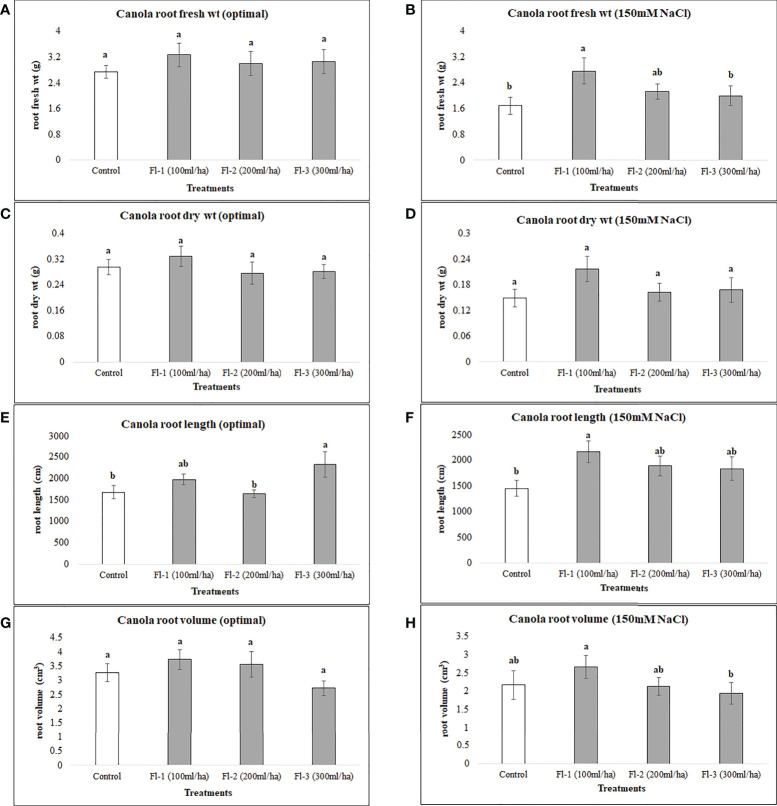
Salt stress is a major threat to modern agriculture, significantly affecting plant growth and yield, and causing substantial economic losses. At this crucial time of increasing climate change conditions, soil salinity will continue to develop and become an even more serious challenge to crop agriculture. Hence, there is a pressing need for sustainable techniques in agricultural production that could meet the dual challenges of crop productivity and environmental instability. The use of biostimulants in agricultural production has greatly influenced plant health and global food production. In particular, the application of bioactive materials produced by beneficial microbes is becoming a common practice in agriculture and provides numerous benefits to plant growth and resistance to stressful conditions. In this research two biostimulants; a type of plant secondary metabolite (flavonoids) and a microbe-based material (CFS: Cell-Free Supernatant) containing active compounds secreted by a novel bacterial strain isolated from Amphecarpaea bracteata root nodules (Devosia sp - SL43), have been utilized to improve the growth and stress resistance of two major oil seed crops; canola and soybean, under optimal and salt stress conditions. Our findings suggested significant improvements in crop growth of canola and soybean following the application of both biostimulants. Under optimal growth conditions, soybean growth was significantly affected by foliar spray of flavonoids with increases in shoot fresh and dry weight, and leaf area, by 91, 99.5, and 73%, respectively. However, soybean growth was unaffected by flavonoids under salt stress. In contrast, CFS with a meaningful capacity to mitigate the negative effects of salinity stress improved soybean shoot fresh biomass, dry biomass, and leaf area by 128, 163 and 194%, respectively, under salt stress conditions. Canola was less responsive to both biostimulants, except for canola root variables which were substantially improved by flavonoid spray. Since this was the first assessment of these materials as foliar sprays, we strongly encourage further experimentation to confirm the findings reported here and to determine the full range of applicability of each of these potential technologies.
Keywords: biostimulants; canola; cell-free supernatant; flavonoids; plant abiotic stress; plant growth; salt stress; soybean.
Copyright © 2022 Shah, Subramanian and Smith.
Conflict of interest statement
The authors declare that the research was conducted in the absence of any commercial or financial relationships that could be construed as a potential conflict of interest.
Figures
Similar articles
-
Seed Priming with Devosia sp. Cell-Free Supernatant (CFS) and Citrus Bioflavonoids Enhance Canola and Soybean Seed Germination.Molecules. 2022 May 25;27(11):3410. doi: 10.3390/molecules27113410. Molecules. 2022. PMID: 35684348 Free PMC article.
-
Cell-free supernatant of Devosia sp. (strain SL43) mitigates the adverse effects of salt stress on soybean (Glycine max L.) seed vigor index.Front Plant Sci. 2023 Mar 28;14:1071346. doi: 10.3389/fpls.2023.1071346. eCollection 2023. Front Plant Sci. 2023. PMID: 37056501 Free PMC article.
-
Agroindustrial By-Products as a Source of Biostimulants Enhancing Responses to Abiotic Stress of Horticultural Crops.Int J Mol Sci. 2024 Mar 20;25(6):3525. doi: 10.3390/ijms25063525. Int J Mol Sci. 2024. PMID: 38542496 Free PMC article. Review.
-
Halotolerant bacteria mitigate the effects of salinity stress on soybean growth by regulating secondary metabolites and molecular responses.BMC Plant Biol. 2021 Apr 12;21(1):176. doi: 10.1186/s12870-021-02937-3. BMC Plant Biol. 2021. PMID: 33845762 Free PMC article.
-
The power of seaweeds as plant biostimulants to boost crop production under abiotic stress.Plant Cell Environ. 2022 Sep;45(9):2537-2553. doi: 10.1111/pce.14391. Epub 2022 Jul 19. Plant Cell Environ. 2022. PMID: 35815342 Review.
Cited by
-
Pathogen-driven Pseudomonas reshaped the phyllosphere microbiome in combination with Pseudostellaria heterophylla foliar disease resistance via the release of volatile organic compounds.Environ Microbiome. 2024 Aug 25;19(1):61. doi: 10.1186/s40793-024-00603-3. Environ Microbiome. 2024. PMID: 39182153 Free PMC article.
-
Microbial Biocontrol Agents and Natural Products Act as Salt Stress Mitigators in Lactuca sativa L.Plants (Basel). 2024 Sep 6;13(17):2505. doi: 10.3390/plants13172505. Plants (Basel). 2024. PMID: 39273989 Free PMC article.
References
-
- Chutipaijit S., Cha-Um S., Sompornpailin K. (2009). Differential accumulations of proline and flavonoids in indica rice varieties against salinity. Pak. J. Bot. 41, 2497–2506.
-
- Corwin D. L. (2021). Climate change impacts on soil salinity in agricultural areas. Eur. J. Soil Sci. 72, 842–862. doi: 10.1111/ejss.13010 - DOI
-
- Davies K. M., Albert N. W., Zhou Y., Schwinn K. E. (2018). Functions of flavonoid and betalain pigments in abiotic stress tolerance in plants. Annu. Plant Rev. Online, 1, 21–62. doi: 10.1002/9781119312994.apr0604 - DOI
-
- Di Ferdinando M., Brunetti C., Fini A., Tattini M. (2012). “Flavonoids as antioxidants in plants under abiotic stresses,” in Abiotic Stress Responses in Plants, ed. Parvaiz A., Prasad M.N.V.. 159–179. doi: 10.1007/978-1-4614-0634-1_9 - DOI
-
- Eryılmaz F. (2006). The relationships between salt stress and anthocyanin content in higher plants. Biotechnol. Biotechnol. Equip. 20, 47–52. doi: 10.1080/13102818.2006.10817303 - DOI
LinkOut - more resources
Full Text Sources