. 2022 Nov 10:13:1012669.
doi: 10.3389/fpls.2022.1012669. eCollection 2022.

A graph-based approach for simultaneous semantic and instance segmentation of plant 3D point clouds

Affiliations

A graph-based approach for simultaneous semantic and instance segmentation of plant 3D point clouds

Katia Mirande et al. Front Plant Sci. .

Abstract

Accurate simultaneous semantic and instance segmentation of a plant 3D point cloud is critical for automatic plant phenotyping. Classically, each organ of the plant is detected based on the local geometry of the point cloud, but the consistency of the global structure of the plant is rarely assessed. We propose a two-level, graph-based approach for the automatic, fast and accurate segmentation of a plant into each of its organs with structural guarantees. We compute local geometric and spectral features on a neighbourhood graph of the points to distinguish between linear organs (main stem, branches, petioles) and two-dimensional ones (leaf blades) and even 3-dimensional ones (apices). Then a quotient graph connecting each detected macroscopic organ to its neighbors is used both to refine the labelling of the organs and to check the overall consistency of the segmentation. A refinement loop allows to correct segmentation defects. The method is assessed on both synthetic and real 3D point-cloud data sets of Chenopodium album (wild spinach) and Solanum lycopersicum (tomato plant).

Keywords: Fiedler vector; instance segmentation; phenotyping; quotient graph; semantic segmentation.


Conflict of interest statement

The authors declare that the research was conducted in the absence of any commercial or financial relationships that could be construed as a potential conflict of interest.

Figures

Figure 1
Figure 1
Semantic segmentation results on the tomato plant data set. (A) F1-score with respect to the stage of development of the tomato plants. (B) Semantic segmentation results (in % ) on the real tomato plant data set containing two plants at 7 stages of development each. Semantic segmentation IoU obtained by (Schunck et al., 2021) with three different neural network on the entire Pheno4D tomato data set. (C) Computation time with respect to the size of the point cloud (the four biggest point clouds correspond to the tomato plants).
Figure 2
Figure 2
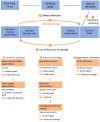
General principle of the mixed instance/semantic segmentation method.
Figure 3
Figure 3
Illustration of the behavior of the Fiedler eigenvector on a toy example. (A) Simple example: a linear graph with two side branches. The vertical axis is composed of a hundred nodes chained together. The two remaining branches contain 20 nodes each chained together and connected to a node of the main chain through the first node in their chain. The overall structure makes up a tree of node chains. We computed the Fiedler eigenvector on this graph and its values are shown with a rainbow color scale (red = highest values, blue = lowest values). Arrows indicate the directions of increasing values for the Fiedler eigenvector. (B) Values of the Fiedler eigenvector for each node from the bottom to the top of the graph in a) without the two side branches. (C) Values of the Fiedler eigenvector on the whole graph in (A) with side branches. Slope breaks correspond to extremal nodes or nodes connecting several branches. With the Fiedler eigenvector, we obtain the Fiedler ADG vector field. (D) The norm of the vectors drops between the petiole and the leaf blade. (E) Unit vectors of the Fiedler ADG vector field are displayed, demonstrating that the directions of the vectors follow the axes of the plant. (F) K -means clustering obtained using the norm of the Fiedler ADG vector field, with K=4 . 2− and 3− dimensional shapes (leaves and apices) are in green while linear shapes are divided into red, yellow and blue. (G) Instance segmentation obtained at the end of the first stage of our algorithm. Each instance is in a different color.
Figure 4
Figure 4
Construction of a quotient graph. (A–C) shows the construction pipeline of the quotient graph from the similarity graph. (A) Similarity graph. (B) Similarity graph with instance segmentation. (C) Quotient graph of the similarity graph in (B). (D–F) show the same stages on a 3D point cloud. (D) Similarity graph with a zoom to see its structure. (E) Segmented similarity graph, each color representing an instance of the segmentation. (F) Superposition of a segmented point cloud with its associated quotient graph.
Figure 5
Figure 5
Locally extremal values for the Fiedler eigenvector on three different organs represented by red dots. (A) A simple leaf blade, (B) an apex and (C) a serrated leaf blade.
Figure 6
Figure 6
Determination of the main stem using the quotient graph. The root node corresponding to the main stem is shown in red, the nodes representing linear organs are in light blue and the apex or leaf blade nodes are in dark blue. (A-C) We compute the shortest paths from each leaf blade or apex node to the root node and add one unit load to each blue node on each path. At the end of the process, the load on each blue node corresponds to the number of shortest paths it belongs to. (D) Segmentation color-coded with the loads, from blue (0) to red (3). The blue is associated with the leaf blades and apices.
Figure 7
Figure 7
Examples of results of the refinement algorithm, when clusters detected as False are clustered again. The purple circle shows a leaf together with an apex and its branch that were classified in the semantic class (Apex). The brown circle shows a cotyledon. As it is not detected differently from the leaf blades, the algorithm considered that the leaf blade of the cotyledon was directly connected to the main stem and therefore clustered it again.
Figure 8
Figure 8
Plant data sets used for the assessment of our pipeline. Pictures of typical architectures from a: (A) real Chenopodium, (B) synthetic Chenopodium, (C) real tomato plant (our photo) illustrating the Pheno4D data set from Schunck et al. (2021). Corresponding raw point clouds processed by our pipeline are respectively shown in (D-F). Point clouds (D, E) have the same view angles as pictures (A, B).
Figure 9
Figure 9
Semantic segmentation results. (A, B) Semantic segmentation of two different synthetic Chenopodiums. Points labelled in blue, (resp. green, orange, red, yellow) correspond to leaf blade (resp. stem, petiole, branch, apex) labels. (C, D) Same segmentations as in a) and b) where labels of the apex class have been relabeled as leaf blades. (E, F) Semantic segmentation of two real Chenopodiums. (G, H) Semantic segmentation of two real tomato plants.
Figure 10
Figure 10
Main segmentation errors and refinement corrections. Five examples of semantic segmentations of different plant parts (A-J). (A-F) are presented without (top row, a, c, e) and with (bottom row, b, d, f) refinement. (G, I) are the ground truth labelled point clouds of the part segmented by our algorithm in (H, J). Points labelled as on a petiole are in orange, on a branch in red, on a leaf blade in blue, on an apex in yellow-green and on a stem in green.

References

    1. CloudCompare (2022). “GPL Software,” in Cloudcompare.
    1. Bengfort B., Bilbro R., Danielsen N., Gray L., McIntyre K., Roman P., et al. . Yellowbrick.(2018) doi: 10.5281/zenodo.1206264 - DOI
    1. Boogaard F., Van Henten E., Kootstra G. (2022). Improved point-cloud segmentation for plant phenotyping through class-dependent sampling of training data to battle class imbalance. Front. Plant Sci. 13. doi: 10.3389/fpls.2022.838190 - DOI - PMC - PubMed
    1. Boudon F., Pradal C., Cokelaer T., Prusinkiewicz P., Godin C. (2012). L-py: An l-system simulation framework for modeling plant architecture development based on a dynamic language. Front. Plant Sci. 3. doi: 10.3389/fpls.2012.00076 - DOI - PMC - PubMed
    1. Boudon F., Preuksakarn C., Ferraro P., Diener J., Nacry P., Nikinmaa E., et al. . (2014). Quantitative assessment of automatic reconstructions of branching systems obtained from laser scanning. Ann. Bot. 114, 853–862. doi: 10.1093/aob/mcu062 - DOI - PMC - PubMed

LinkOut - more resources