

Exposure to environmental occupational constraints and all-cause mortality: Results for men and women from a 20-year follow-up prospective cohort, the VISAT study. Be aware of shift-night workers!
- PMID: 36438211
- PMCID: PMC9687385
- DOI: 10.3389/fpubh.2022.1014517
Exposure to environmental occupational constraints and all-cause mortality: Results for men and women from a 20-year follow-up prospective cohort, the VISAT study. Be aware of shift-night workers!
Abstract
Objective: To determine the predictive value of the large panel of occupational constraints (OC) on all-cause mortality with a 20-year follow-up, in general population of workers.
Methods: In VISAT prospective cohort study, 3,138 workers (1,605 men; 1,533 women) were recruited during the periodic work health visits conducted by occupational physicians. OC (physical, organizational, psychological and employment categories) were collected through self-questionnaires. Exposure durations of each OC were divided by tertile distribution. Cox-regression models were performed to analyze the associations between all-cause mortality and each OC first separately and simultaneously in a single model.
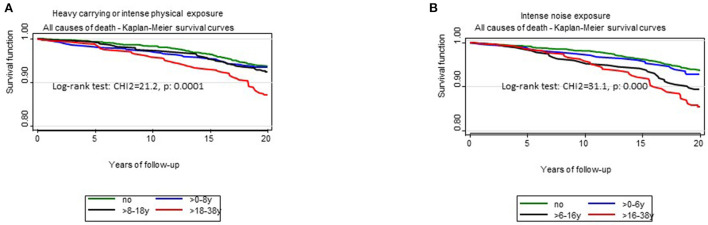
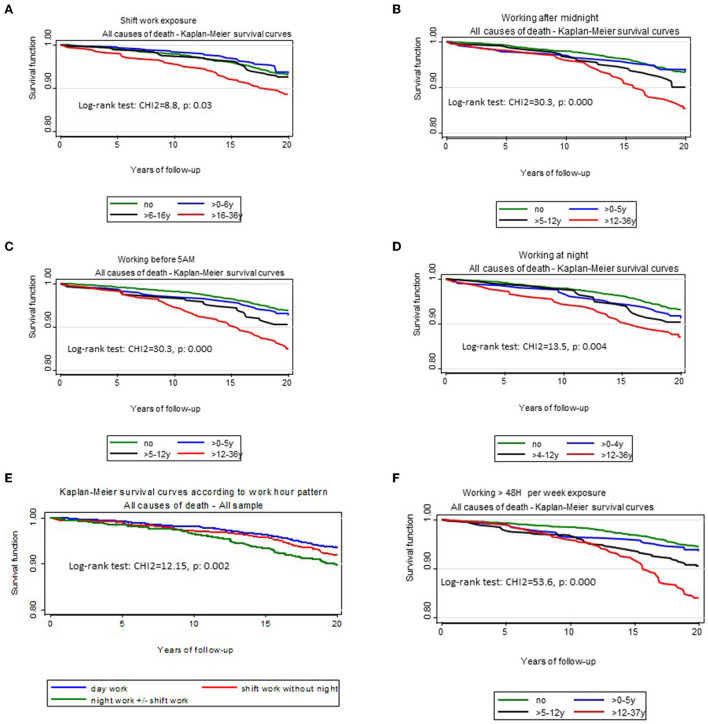
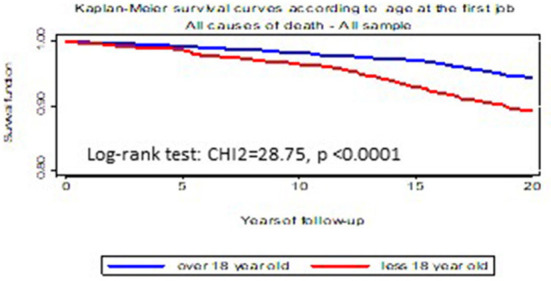
Results: The mortality rates were higher among exposed participants to most of OC compared to those unexposed. Being exposed and longer exposure increased the risks of all-cause mortality for exposures to carrying heavy loads, loud noise, working more than 48 h/week, starting its first job before 18 years old although these risks became non-significant after adjustments for cardiovascular risk factors. Shift work and night work confirmed a high risk of mortality whatever the adjustments and notably when the other occupational exposures were taking into account, with, respectively: HR: 1.38 (1.01-1.91) and 1.44 (1.06-1.95). After adjustments being exposed more than 13 years to a work requiring getting-up before 5:00 a.m. and more than 16 years in rotating shift work significantly increased the risk of mortality by one and a half.
Conclusion: The links between each OC and all-cause mortality and the role of individual factors were stressed. For night-shift workers, it is urgent to implement preventive strategies at the workplace.
Keywords: mortality; occupational exposed workers; occupational physical activity; organizational factors; psychological factor; shift work; work environment.
Copyright © 2022 Esquirol, Huo Yung Kai, Carles, Marquié, Fernandez, Bongard and Ferrières.
Conflict of interest statement
The authors declare that the research was conducted in the absence of any commercial or financial relationships that could be construed as a potential conflict of interest.
Figures
Similar articles
-
Occupation and cancer - follow-up of 15 million people in five Nordic countries.Acta Oncol. 2009;48(5):646-790. doi: 10.1080/02841860902913546. Acta Oncol. 2009. PMID: 19925375
-
Cardiovascular mortality in a Swedish cohort of female industrial workers exposed to noise and shift work.Int Arch Occup Environ Health. 2021 Feb;94(2):285-293. doi: 10.1007/s00420-020-01574-x. Epub 2020 Sep 6. Int Arch Occup Environ Health. 2021. PMID: 32892225 Free PMC article.
-
Associations between shift work and use of prescribed medications for the treatment of hypertension, diabetes, and dyslipidemia: a prospective cohort study.Scand J Work Environ Health. 2019 Sep 1;45(5):465-474. doi: 10.5271/sjweh.3813. Epub 2019 Mar 8. Scand J Work Environ Health. 2019. PMID: 30847495
-
Associations of shift work and night work with risk of all-cause, cardiovascular and cancer mortality: a meta-analysis of cohort studies.Sleep Med. 2021 Oct;86:90-98. doi: 10.1016/j.sleep.2021.08.017. Epub 2021 Aug 21. Sleep Med. 2021. PMID: 34479052 Review.
-
Working Time Society consensus statements: Psychosocial stressors relevant to the health and wellbeing of night and shift workers.Ind Health. 2019 Apr 1;57(2):175-183. doi: 10.2486/indhealth.SW-3. Epub 2019 Jan 31. Ind Health. 2019. PMID: 30700668 Free PMC article. Review.
Cited by
-
Night Shift Work Associates with All-Cause and Cause-Specific Mortality: A Large Prospective Cohort Study.J Gen Intern Med. 2025 May;40(7):1635-1645. doi: 10.1007/s11606-024-08946-w. Epub 2024 Sep 10. J Gen Intern Med. 2025. PMID: 39254778
References
Publication types
MeSH terms
LinkOut - more resources
Full Text Sources