. 2022 Oct 31;12(17):7624-7639.
doi: 10.7150/thno.72853. eCollection 2022.

The landscape of cancer-associated fibroblasts in colorectal cancer liver metastases

Affiliations

The landscape of cancer-associated fibroblasts in colorectal cancer liver metastases

Ambre Giguelay et al. Theranostics. .

Abstract

Rationale: Patients with colorectal cancer die mainly due to liver metastases (CRC-LM). Although the tumor microenvironment (TME) plays an important role in tumor development and therapeutic response, our understanding of the individual TME components, especially cancer-associated fibroblasts (CAFs), remains limited. Methods: We analyzed CRC-LM CAFs and cancer cells by single-cell transcriptomics and used bioinformatics for data analysis and integration with related available single-cell and bulk transcriptomic datasets. We validated key findings by RT-qPCR, western blotting, and immunofluorescence. Results: By single-cell transcriptomic analysis of 4,397 CAFs from six CRC-LM samples, we identified two main CAF populations, contractile CAFs and extracellular matrix (ECM)-remodeling/pro-angiogenic CAFs, and four subpopulations with distinct phenotypes. We found that ECM-remodeling/pro-angiogenic CAFs derive from portal resident fibroblasts. They associate with areas of strong desmoplastic reaction and Wnt signaling in low-proliferating tumor cells engulfed in a stiff extracellular matrix. By integrating public single-cell primary liver tumor data, we propose a model to explain how different liver malignancies recruit CAFs of different origins to this organ. Lastly, we found that LTBP2 plays an important role in modulating collagen biosynthesis, ECM organization, and adhesion pathways. We developed fully human antibodies against LTBP2 that depleted LTBP2+ CAFs in vitro. Conclusion: This study complements recent reports on CRC-LM CAF heterogeneity at the single-cell resolution. The number of sequenced CAFs was more than one order of magnitude larger compared to existing data. LTBP2 targeting by antibodies might create opportunities to deplete ECM-remodeling CAFs in CRC-LMs. This might be combined with other therapies, e.g., anti-angiogenic compounds as already done in CRC. Moreover, we showed that in intrahepatic cholangiocarcinoma, in which ECM-remodeling CAF proportion is similar to that of CRC-LM, several genes expressed by ECM-remodeling CAFs, such as LTBP2, were associated with survival.

Keywords: CAF; LTBP2.; liver metastasis; single-cell; tumor microenvironment.


Conflict of interest statement

Competing Interests: The authors have declared that no competing interest exists.

Figures

Figure 1
Figure 1
CAF heterogeneity. A. Analysis of the individual transcriptomes of 4,397 CAFs identified two main populations (ECM- and Ctr-CAFs) and four more specialized populations. B. Expression of the 30-gene signatures for each CAF population and subpopulation. C. Biological processes showing the different activity levels in the CAF populations. D. LTBP2 and ACTA2 expression in CAFs. E. Protein expression of Pan-CK (cancer cells), α-SMA (all CAFs) and LTBP2 (ECM-CAFs) in CRC-LM. Representative image of nine CRC-LM samples; scale bars,100 μm. Nuclei were counterstained with DAPI.
Figure 2
Figure 2
CAF origin. A. Machine learning (ML) prediction of CAF origin using mesenchymal cell transcriptome data from healthy and cirrhotic human livers (the table on the right shows the rate of closest mesenchymal phenotype assignment to each CAF population.) B. RNA velocity analysis indicating a seamless flow between ECM-CAF subtypes, in agreement with a common SAMes origin. Conversely, transitions between ECM- and Ctr-CAFs, and Ctr-CAF-II and Ctr-CAF-II seem more random, in agreement with their distinct origins. C. Portal fibroblast genes not expressed by HSCs strongly associate with ECM-CAFs. D. Multiplexed immunofluorescence staining of Pan-CK (hepatocytes), α-SMA (HSCs), and LTBP2. The presence of LTBP2+ CAFs in CRC-LM samples is limited to portal regions of the normal adjacent liver tissue. LM, liver metastasis; D, desmoplasia; and NL, normal liver. Representative images of nine CRC-LM samples; scale bars, 100μm. Nuclei were counterstained with DAPI. E-F. RT-qPCR analysis of C3, POSTN, and LTBP2 expression in LX2 and CCD18Co cells, and CRC-LM-CAFs incubated with CM from CRC cell lines (HT29, SW1222, and LoVo). Basal levels (E) and gene fold-change relative to control (F). G. Western blot analysis of LTBP2 abundance in conditioned medium samples. Panels E and F: *P < 0.05, **P < 0.01, ***P < 0.001.
Figure 3
Figure 3
Expression of Pan-CK (cancer cells), α-SMA (CAFs) and LTBP2 (ECM-CAFs) in CRC-LM samples at the invasion front of replacement, and in the pushing and desmoplastic HGPs. LM, liver metastasis; D, desmoplasia; and NL, normal liver. Representative images of nine CRC-LM samples; scale bars, 100 μm. Nuclei were counterstained with DAPI. Histograms indicate the mean values from nine samples and two different locations per sample; error bars are the standard deviations; *P ≤ 0.05, **P ≤ 0.01 (Mann-Whitney-U-Test).
Figure 4
Figure 4
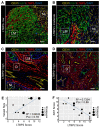
Features of ECM-CAF dense areas. A-D. Immunofluorescence analysis of endothelial cells (CD31), cancer cell proliferation (Ki67), and ECM-CAFs (LTBP2) in different configurations representative of 20 CRC-LM samples. A. ECM-CAF low concentration area at the invasive front of a CRC-LM with replacement HGP. B. Moderate ECM-CAF concentration at the invasive front of a CRC-LM with pushing HGP. C. High ECM-CAF concentration at the invasive front of a CRC-LM with desmoplastic HGP. D. High ECM-CAF concentration at the center of a CRC-LM with replacement HGP. LM, liver metastasis; D, desmoplasia; and NL, normal liver. Scale bar, 100 μm; nuclei were counterstained with DAPI. E. Correlation analysis of CD31+ vessel size (1-small, 2-medium, 3-large) and ECM-CAF (LTBP2+) presence. F. Correlation analysis of cancer cell Ki67-positivity and ECM-CAF (LTBP2+) presence. E and F: analyses restricted to LM areas, nine tumors, two different fields per tumor; Pcc = Pearson correlation coefficient, P = P-value.
Figure 5
Figure 5
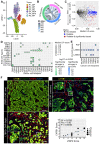
Cell interactions. A. Two-dimensional projection of the cancer cell transcriptomes. B. Number of reliable LR interactions among the three cell populations. C. Schematics of the selection of reliable and significantly Ctr- or ECM-CAF-biased LR interactions. Vertical axis: differences between the median LR-scores for Ctr- and ECM-CAFs. D. Chosen subset of significantly stronger LR interactions from ECM-CAFs to cancer cells. E. Significantly stronger LR interactions from Ctr-CAFs to cancer cells. F. Multiplexed immunofluorescence staining of cancer cells (CADH1), Wnt canonical signaling (CTNB1), and ECM-CAFs. Images show three liver metastasis zones with high, medium and low ECM-CAF proportions. Representative images of nine CRC-LM samples; scale bar, 100μm; nuclei were counterstained with DAPI. G. Correlation analysis of nuclear CTNB1 positivity in cancer cells and presence of adjacent ECM-CAFs: nine CRC-LMs and two different fields per sample; Pcc = Pearson correlation coefficient, P = P-value.
Figure 6
Figure 6
LTBP2 is essential for fibroblast viability and functions. A. MTT assay showing the proliferation of CCD18Co cells exposed to HT29 conditioned medium (CM) and incubated with different antibodies against LTBP2 (F5, C6, F7, D2), or an irrelevant antibody (rituximab, against CD20) for 96h. Mean values were normalized to the non-treated condition (NT). Error bars represent the standard deviation. P-values were obtained with the t-test. B. Expression (z-scores) of 496 genes significantly deregulated (edgeR analysis, FDR < 0.01 and fold-change > 2) between CCD18Co cells transfected with siRNAs anti-LTBP2 and non-target (siNT) for 48h. C. Selected GO biological processes modulated by LTBP2 silencing in CCD18Co fibroblasts. Panels A and C: *P < 0.05, **P < 0.01, ***P < 0.001, ****P < 0.0001 (hypergeometric test).
Figure 7
Figure 7
A. Expression profiles of ECM- and Ctr-CAF signature genes in different liver tumor types. B. ML-inferred CAF composition in CRC-LM, hepatocellular carcinoma (HCC), and intrahepatic cholangiocarcinoma (iCCA). P-values by multinomial testing (#P < 7E-11). C. Survival curves in function of LTBP2 and FAP expression. D. CAF origin model. CAFs mainly derive from three major sources: hepatic stellate cells (HSC), portal fibroblasts (PF), and vascular smooth muscle cells (VSMC). CRC-LM initiate by the arrival of CRC cells from the colon through the portal vein into the portal space of liver. There, they extravasate, activate PFs, and orient them to a CAF phenotype. The lesions grow and invade the liver parenchyma where they subsequently convert HSCs into CAFs. In HCC, the opposite occurs. Tumors originate in the liver parenchyma where they first activate HSCs.

References

    1. Dekker E, Tanis PJ, Vleugels JLA, Kasi PM, Wallace MB. Colorectal cancer. Lancet. 2019;394:1467–80. - PubMed
    1. Aranda E, Aparicio J, Alonso V, Garcia-Albeniz X, Garcia-Alfonso P, Salazar R. et al. SEOM clinical guidelines for diagnosis and treatment of metastatic colorectal cancer 2015. Clin Transl Oncol. 2015;17:972–81. - PMC - PubMed
    1. Junttila MR, de Sauvage FJ. Influence of tumour micro-environment heterogeneity on therapeutic response. Nature. 2013;501:346–54. - PubMed
    1. Emambux S, Tachon G, Junca A, Tougeron D. Results and challenges of immune checkpoint inhibitors in colorectal cancer. Expert Opin Biol Ther. 2018;18:561–73. - PubMed
    1. Ronca R, Van Ginderachter JA, Turtoi A. Paracrine interactions of cancer-associated fibroblasts, macrophages and endothelial cells: tumor allies and foes. Curr Opin Oncol. 2018;30(1):45–53. - PubMed

Publication types

MeSH terms

Substances