

Machine learning-based identification of a novel prognosis-related long noncoding RNA signature for gastric cancer
- PMID: 36438557
- PMCID: PMC9691877
- DOI: 10.3389/fcell.2022.1017767
Machine learning-based identification of a novel prognosis-related long noncoding RNA signature for gastric cancer
Abstract
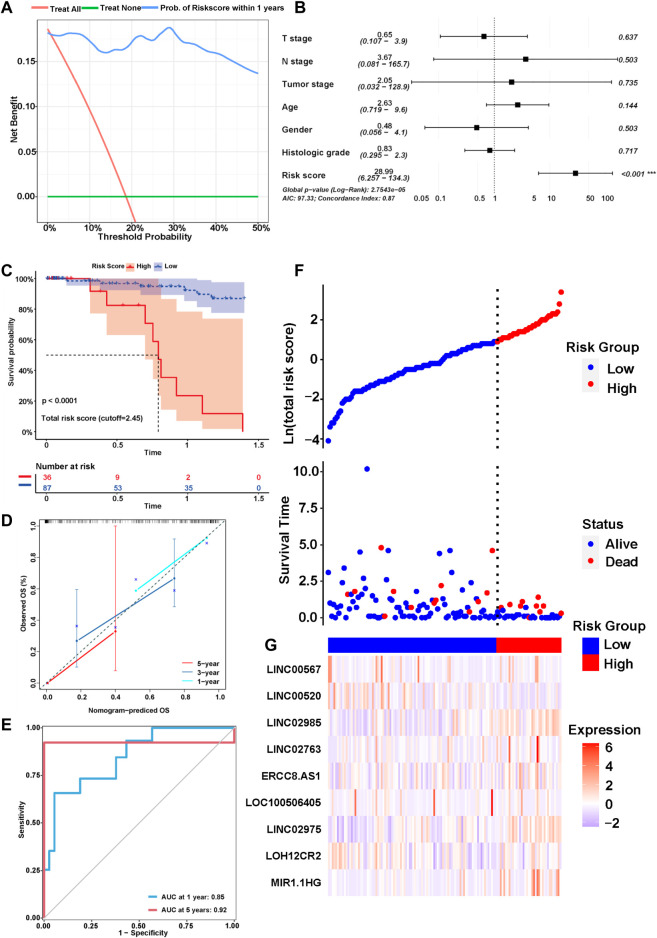
Gastric cancer (GC) is one of the most common malignancies with a poor prognosis. Immunotherapy has attracted much attention as a treatment for a wide range of cancers, including GC. However, not all patients respond to immunotherapy. New models are urgently needed to accurately predict the prognosis and the efficacy of immunotherapy in patients with GC. Long noncoding RNAs (lncRNAs) play crucial roles in the occurrence and progression of cancers. Recent studies have identified a variety of prognosis-related lncRNA signatures in multiple cancers. However, these studies have some limitations. In the present study, we developed an integrative analysis to screen risk prediction models using various feature selection methods, such as univariate and multivariate Cox regression, least absolute shrinkage and selection operator (LASSO), stepwise selection techniques, subset selection, and a combination of the aforementioned methods. We constructed a 9-lncRNA signature for predicting the prognosis of GC patients in The Cancer Genome Atlas (TCGA) cohort using a machine learning algorithm. After obtaining a risk model from the training cohort, we further validated the model for predicting the prognosis in the test cohort, the entire dataset and two external GEO datasets. Then we explored the roles of the risk model in predicting immune cell infiltration, immunotherapeutic responses and genomic mutations. The results revealed that this risk model held promise for predicting the prognostic outcomes and immunotherapeutic responses of GC patients. Our findings provide ideas for integrating multiple screening methods for risk modeling through machine learning algorithms.
Keywords: gastric cancer; immunotherapy; long noncoding RNA; machine learning algorithm; prognostic signature.
Copyright © 2022 Zhao, Teng, Liu, Chen, Chong, Du, Xiao, Sang, Ma, Cui, Shang and Zhang.
Conflict of interest statement
Author JC was employed by the company Shanghai BioGenius Biotechnology Center. The remaining authors declare that the research was conducted in the absence of any commercial or financial relationships that could be construed as a potential conflict of interest.
Figures


Similar articles
-
A Novel Glycolysis-Related Long Noncoding RNA Signature for Predicting Overall Survival in Gastric Cancer.Pathol Oncol Res. 2022 Nov 7;28:1610643. doi: 10.3389/pore.2022.1610643. eCollection 2022. Pathol Oncol Res. 2022. PMID: 36419649 Free PMC article.
-
An exosome-derived lncRNA signature identified by machine learning associated with prognosis and biomarkers for immunotherapy in ovarian cancer.Front Immunol. 2024 Feb 9;15:1228235. doi: 10.3389/fimmu.2024.1228235. eCollection 2024. Front Immunol. 2024. PMID: 38404588 Free PMC article.
-
A Cuproptosis-Related LncRNA Risk Model for Predicting Prognosis and Immunotherapeutic Efficacy in Patients with Hepatocellular Carcinoma.Biochem Genet. 2024 Jun;62(3):2332-2351. doi: 10.1007/s10528-023-10539-x. Epub 2023 Oct 29. Biochem Genet. 2024. PMID: 37898914
-
Integrating multiple machine learning algorithms for prognostic prediction of gastric cancer based on immune-related lncRNAs.Front Genet. 2023 Apr 4;14:1106724. doi: 10.3389/fgene.2023.1106724. eCollection 2023. Front Genet. 2023. PMID: 37082204 Free PMC article.
-
Unlocking the predictive potential of long non-coding RNAs: a machine learning approach for precise cancer patient prognosis.Ann Med. 2023;55(2):2279748. doi: 10.1080/07853890.2023.2279748. Epub 2023 Nov 20. Ann Med. 2023. PMID: 37983519 Free PMC article. Review.
Cited by
-
Big Data and Artificial Intelligence in Drug Discovery for Gastric Cancer: Current Applications and Future Perspectives.Curr Med Chem. 2025;32(10):1968-1986. doi: 10.2174/0929867331666230913105829. Curr Med Chem. 2025. PMID: 37711014 Review.
References
LinkOut - more resources
Full Text Sources
Miscellaneous