. 2022 Sep:2:851-866.
doi: 10.1038/s43587-022-00279-9. Epub 2022 Sep 13.

3-deazaadenosine (3DA) alleviates senescence to promote cellular fitness and cell therapy efficiency in mice

Affiliations

3-deazaadenosine (3DA) alleviates senescence to promote cellular fitness and cell therapy efficiency in mice

Ana Guerrero et al. Nat Aging. 2022 Sep.

Abstract

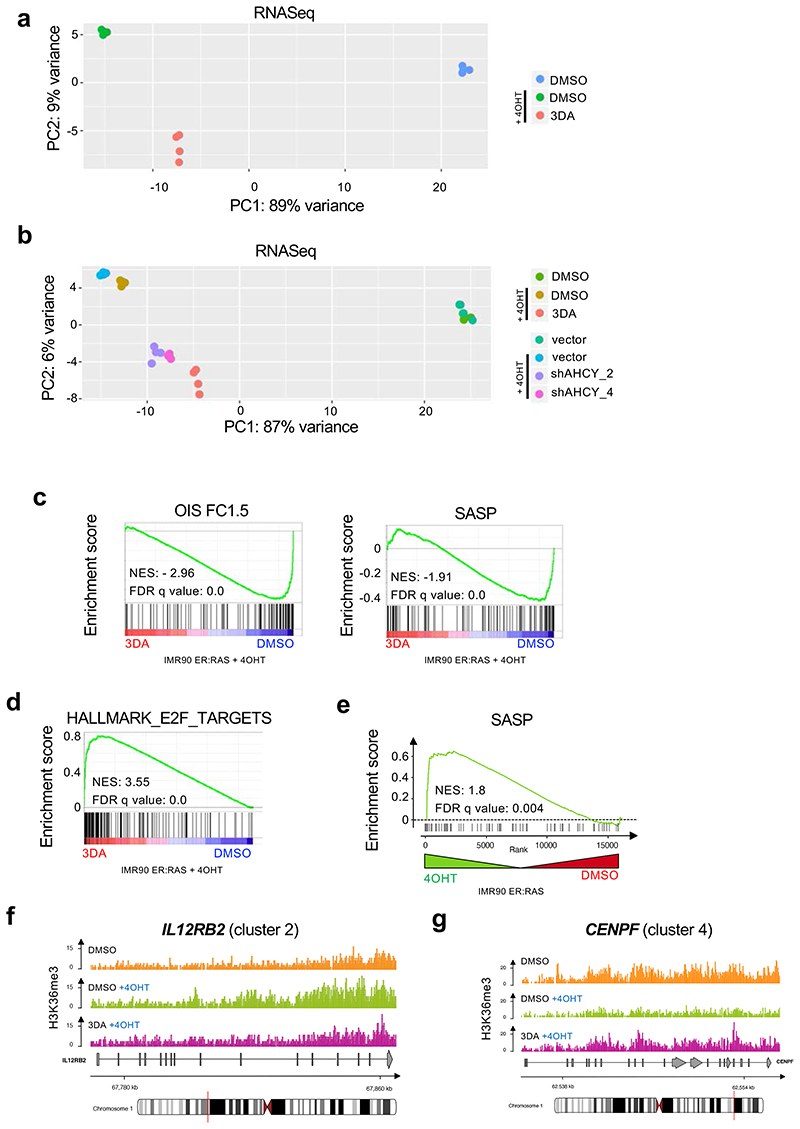
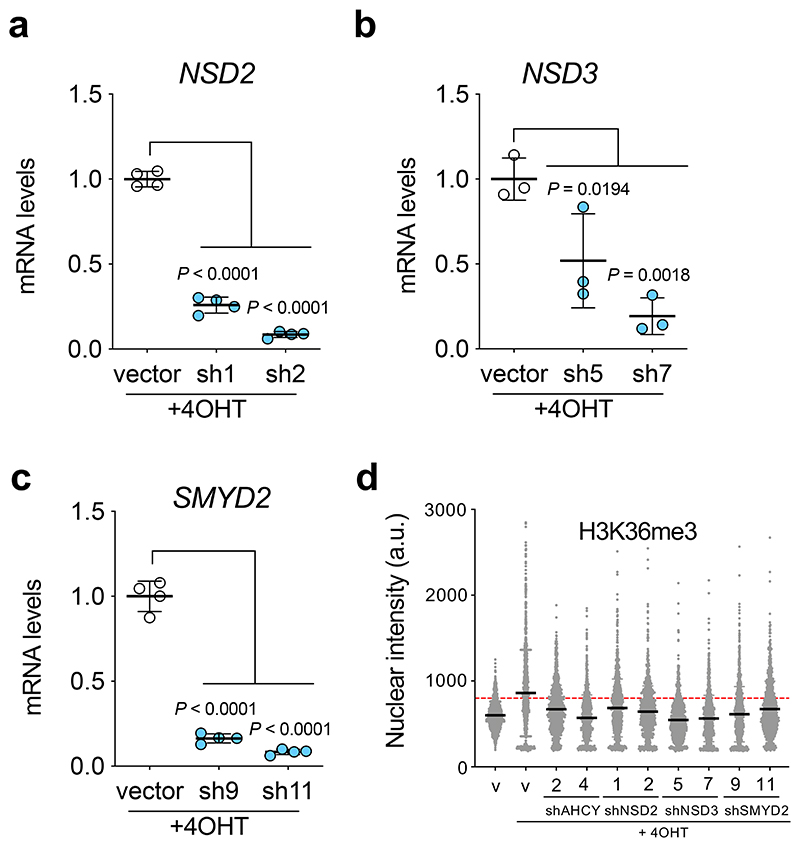
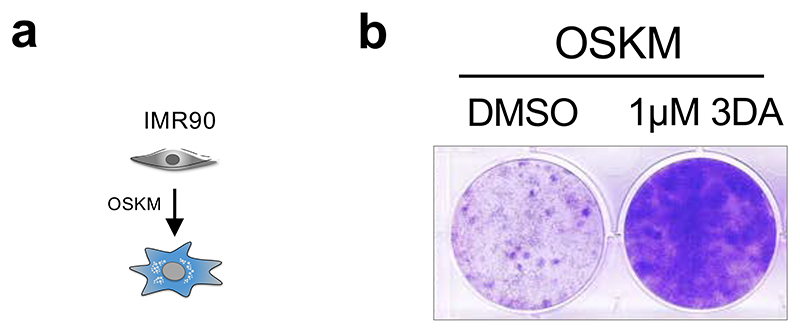
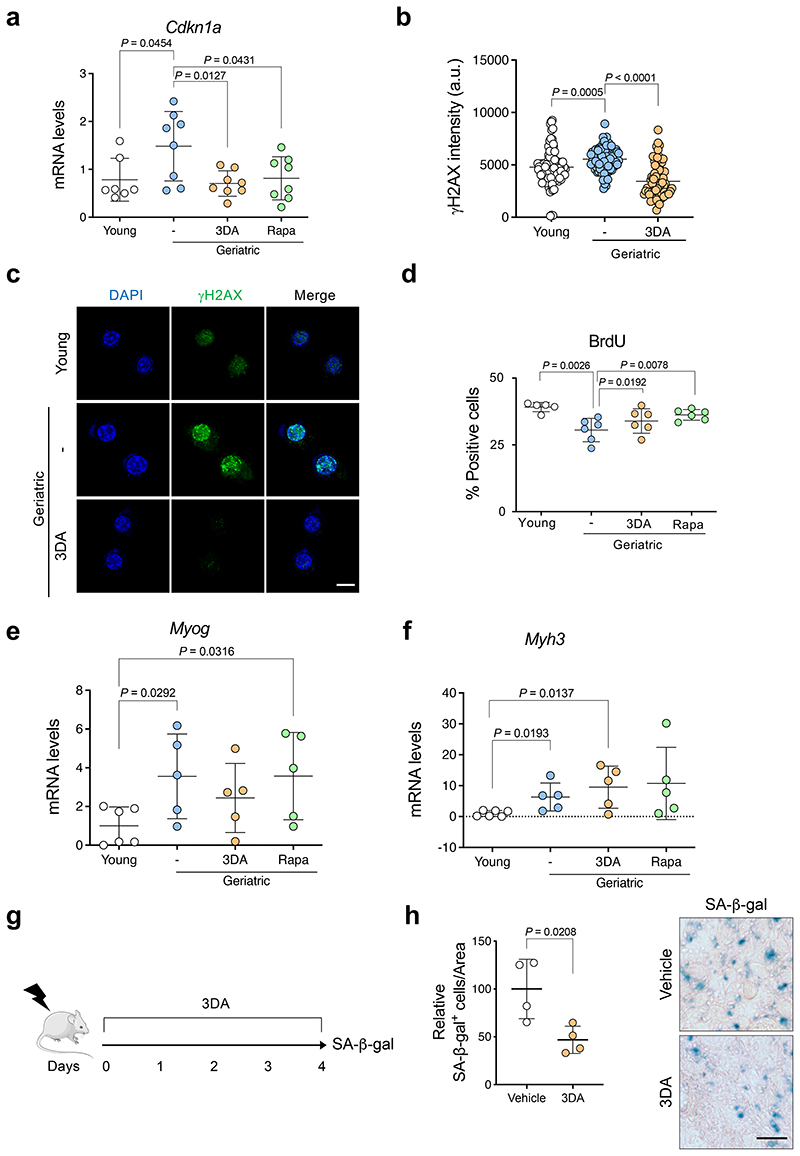
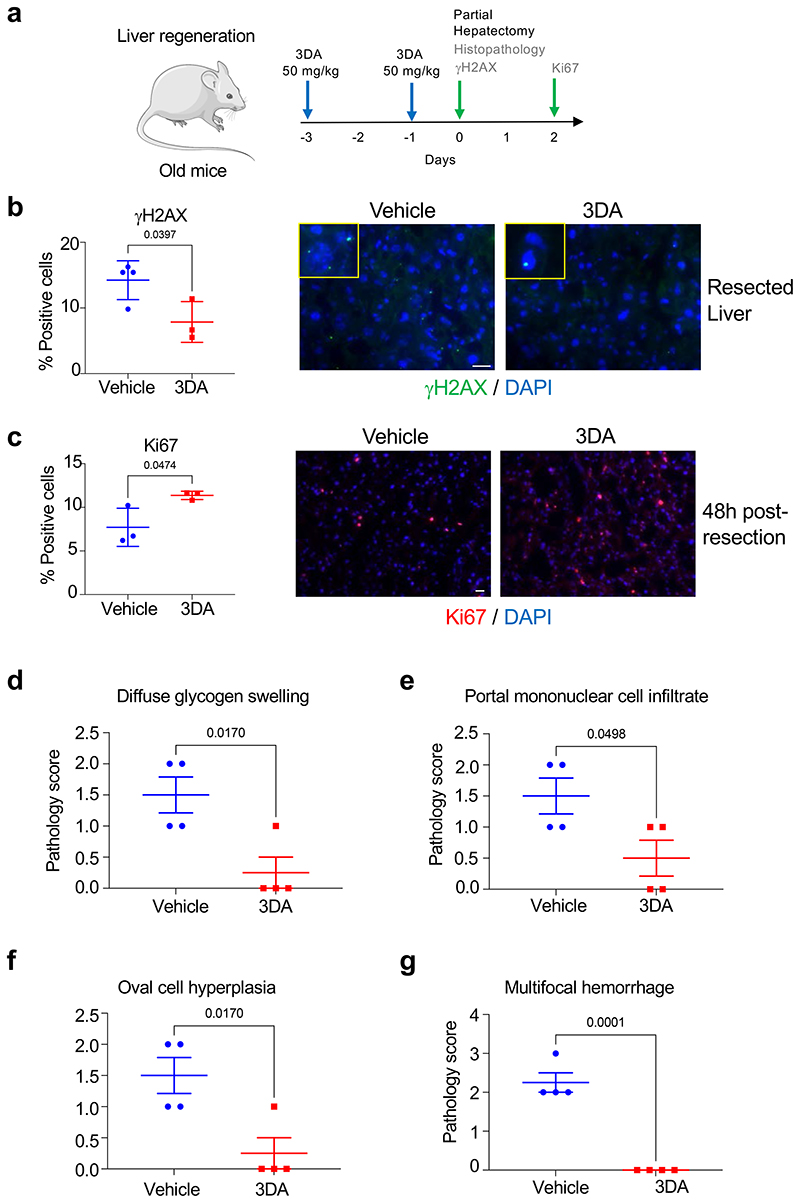
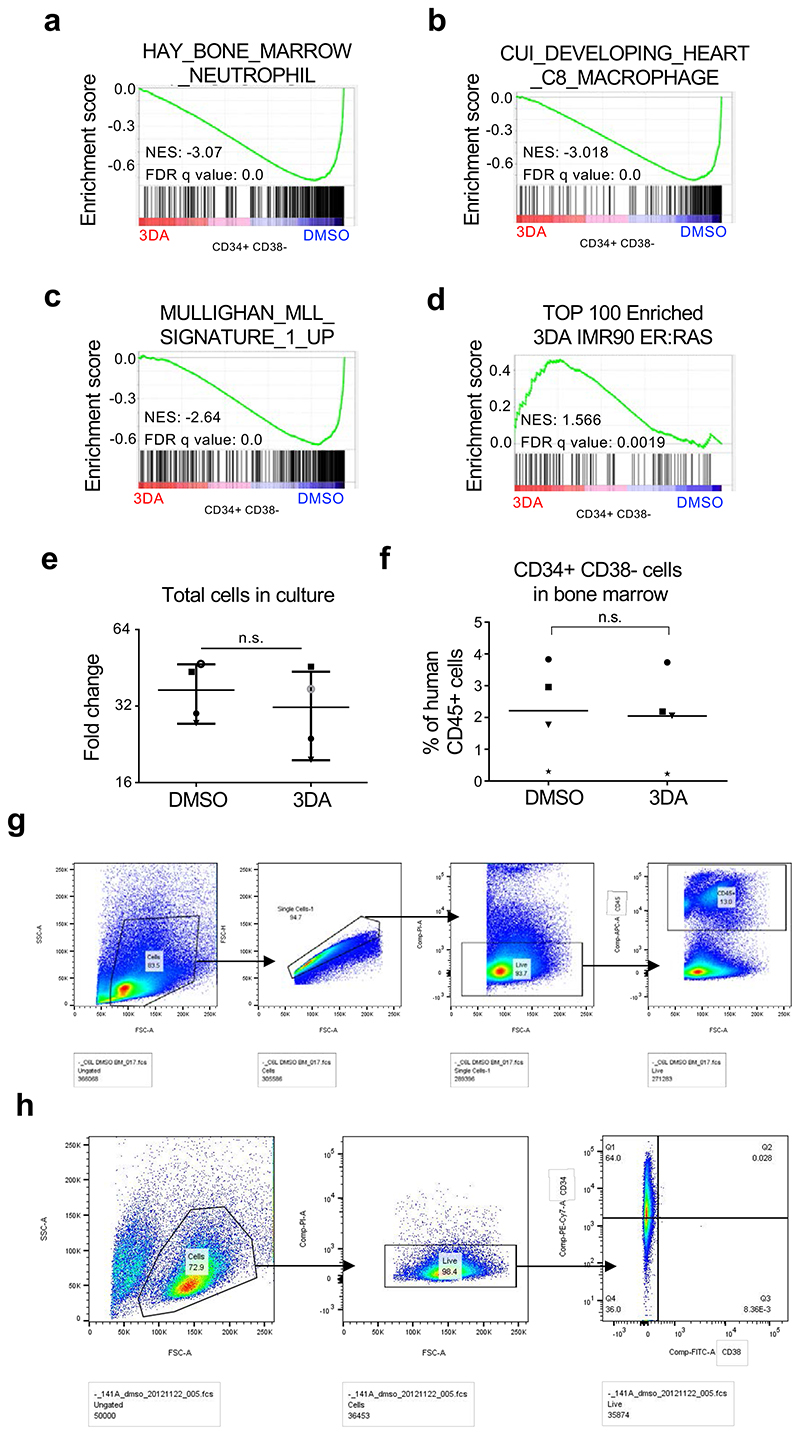
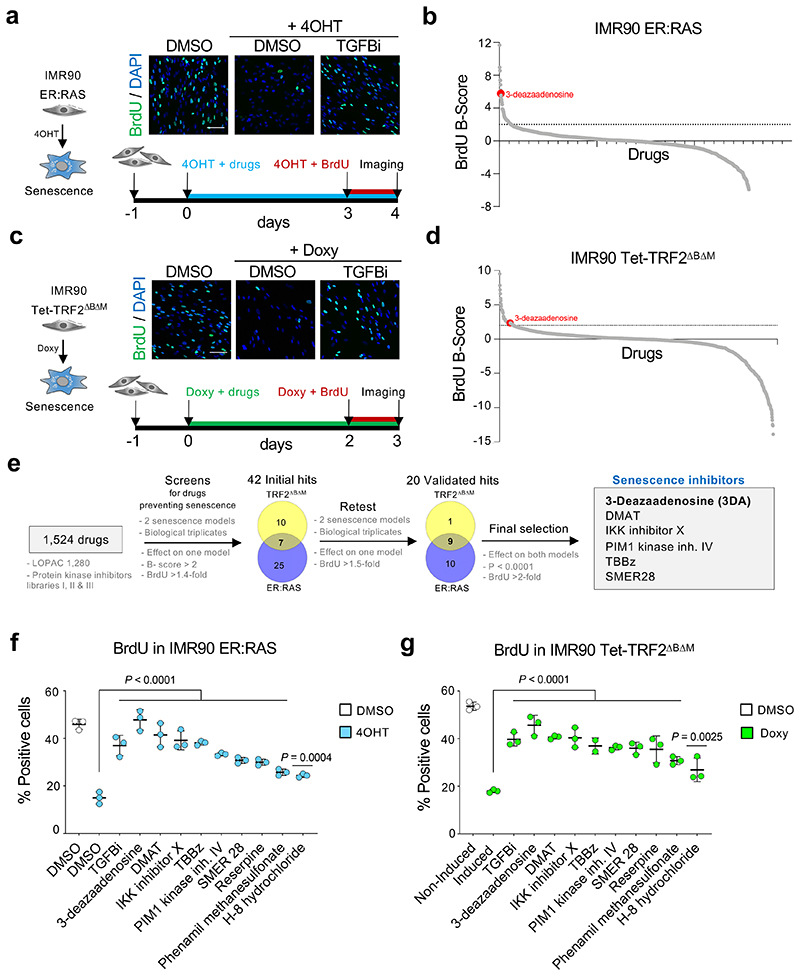
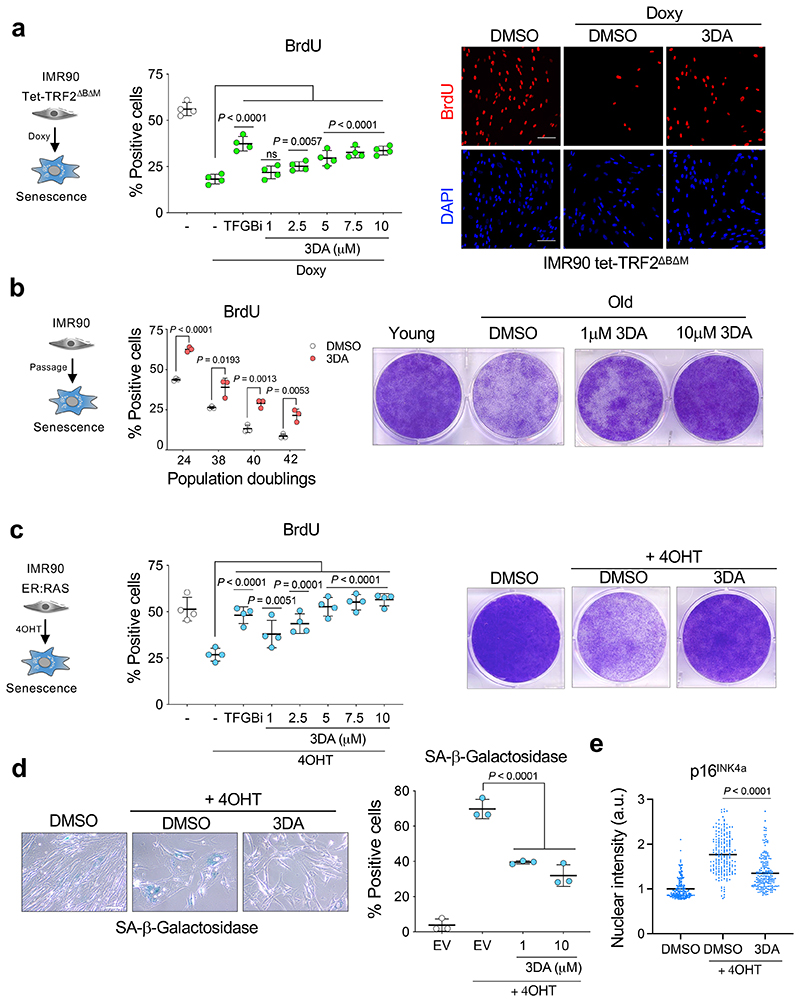
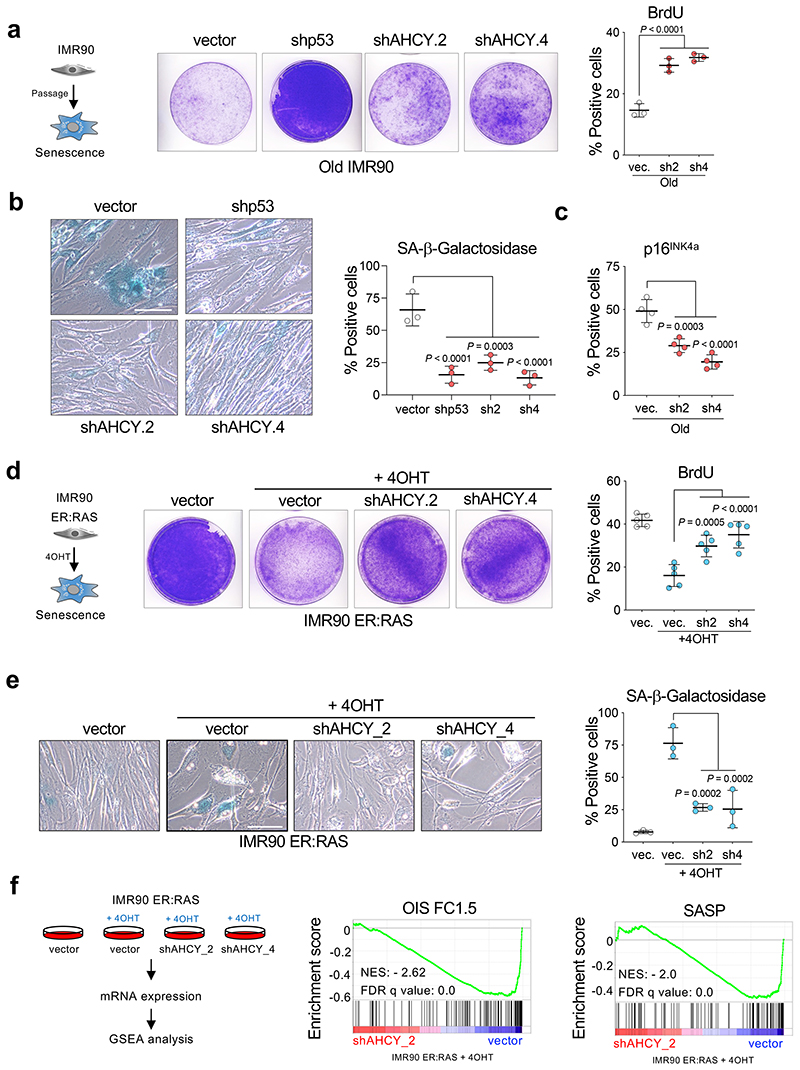
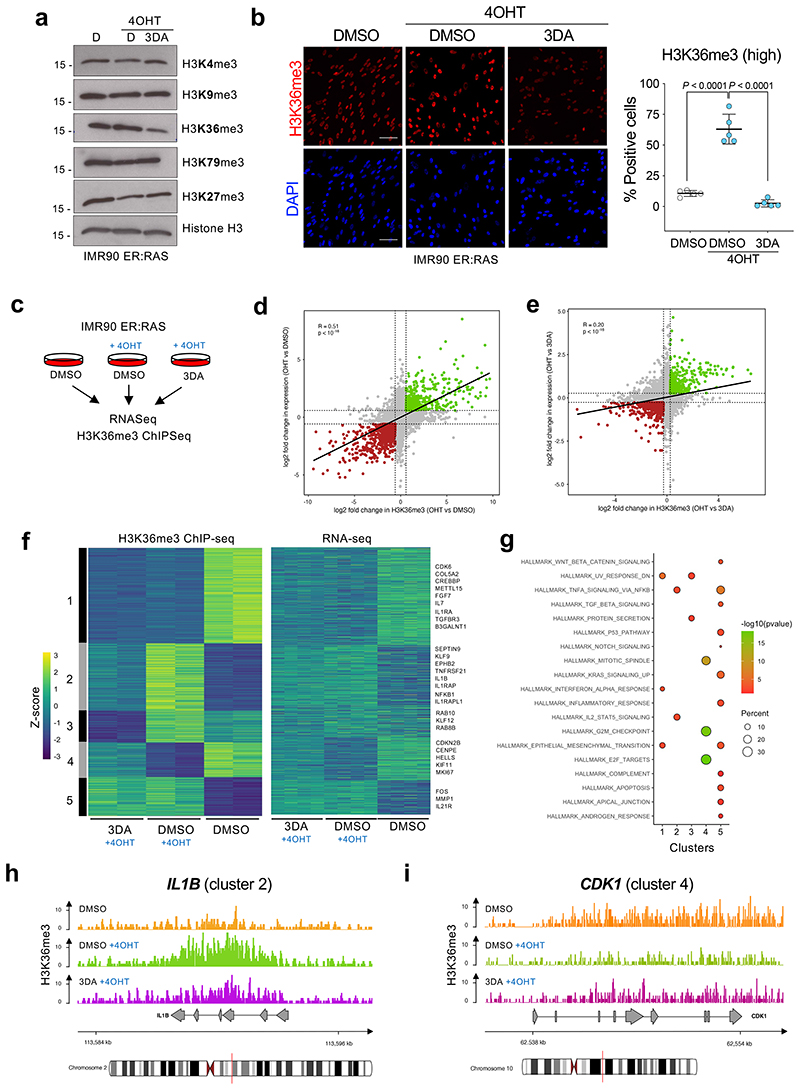
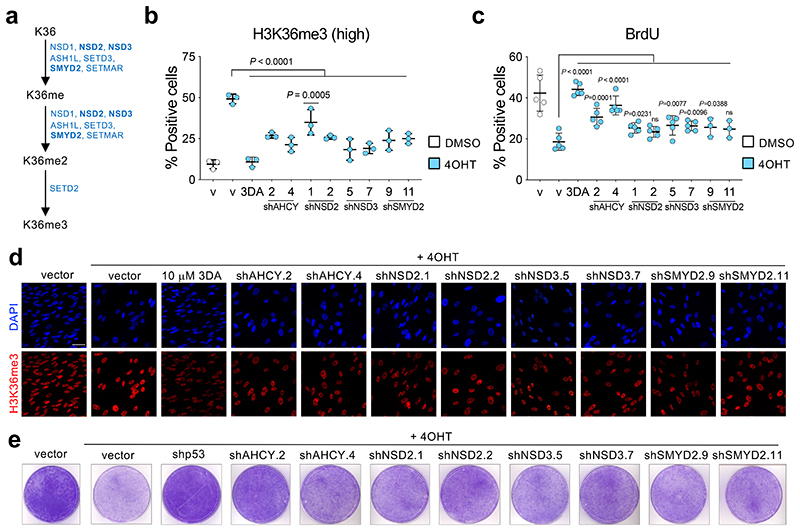
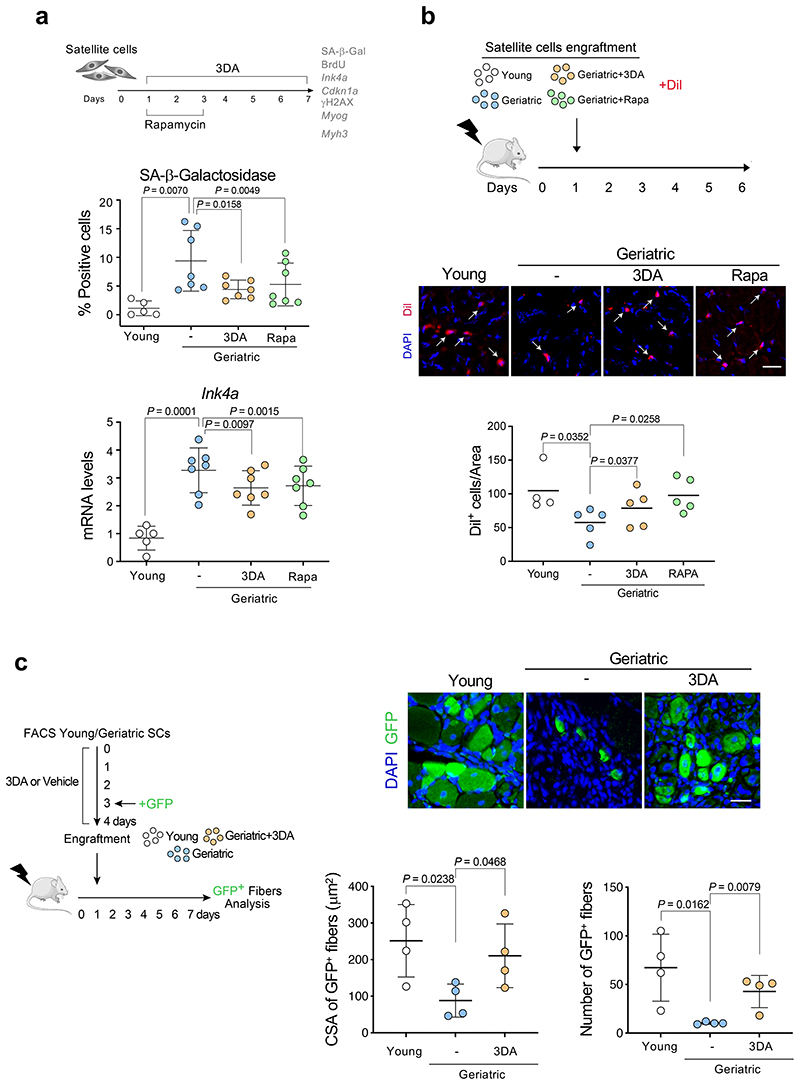
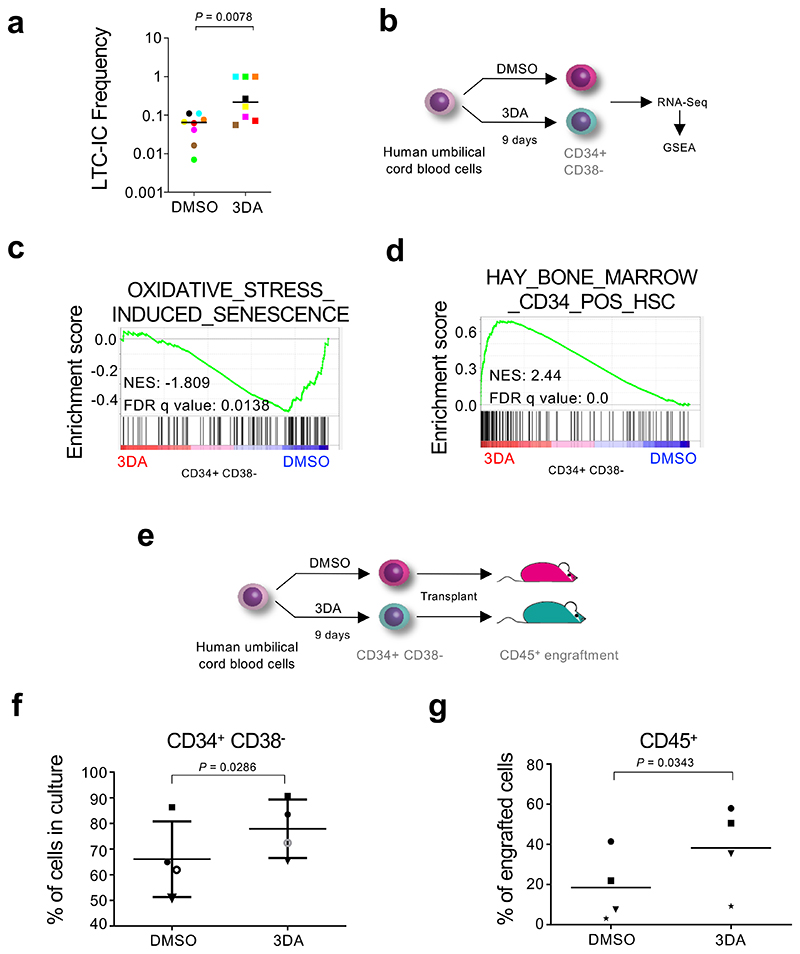
Cellular senescence is a stable type of cell cycle arrest triggered by different stresses. As such, senescence drives age-related diseases and curbs cellular replicative potential. Here, we show that 3-deazaadenosine (3DA), an S-adenosyl homocysteinase (AHCY) inhibitor, alleviates replicative and oncogene-induced senescence. 3DA-treated senescent cells showed reduced global Histone H3 Lysine 36 trimethylation (H3K36me3), an epigenetic modification that marks the bodies of actively transcribed genes. By integrating transcriptome and epigenome data, we demonstrate that 3DA treatment affects key factors of the senescence transcriptional program. Remarkably, 3DA treatment alleviated senescence and increased the proliferative and regenerative potential of muscle stem cells from very old mice in vitro and in vivo. Moreover, ex vivo 3DA treatment was sufficient to enhance the engraftment of human umbilical cord blood (UCB) cells in immunocompromised mice. Together, our results identify 3DA as a promising drug enhancing the efficiency of cellular therapies by restraining senescence.

Keywords: 3DA; AHCY; cord blood cells; muscle stem cells; senescence.


Conflict of interest statement

Competing Interests J.G. has acted as a consultant for Unity Biotechnology, Geras Bio, Myricx Pharma and Merck KGaA. Pfizer and Unity Biotechnology have funded research in J.G.’s lab (unrelated to the work presented here). J.G. owns equity in Geras Bio. J.G. and A.G. are named inventors in an MRC patent and J.G. is a named inventor in another Imperial College patents, both related to senolytic therapies (the patents are no related to the work presented here). T.W. is scientific co-founder of and holds stakes in Cargene Therapeutics, which develops nucleic-acid therapeutics for liver diseases (unrelated to the work presented here). The remaining authors declare no competing interests.

Figures

Extended Data Figure 1
Extended Data Figure 1. Cellular models of senescence induced by oncogene activation and telomere uncapping.
a, IMR90 ER:RAS as a model of OIS. Quantification of immunofluorescence staining for BrdU (left) and p16INK4a (right) of IMR90 ER:RAS cells 4 days after treatment with 4OHT or vehicle (DMSO) (n = 3). b, IMR90 tet-TRF2ΔBΔM as a model of telomere uncapping-induced senescence. c, Left, quantification of immunofluorescence staining for 53BP1 of IMR90 tet-TRF2ΔBΔM cells after treatment with doxycycline or vehicle (DMSO) (n = 3). Right, representative immunofluorescence images. Scale bar, 20 μm. d, Left, quantification of immunofluorescence staining for p21CIP1 (n = 3). Right, representative immunofluorescence images. Scale bar, 50 μm. e, Left, quantification of immunofluorescence staining for p16INK4a (day 7, n = 2). Right, representative immunofluorescence images. Scale bar, 100 μm. f, Left, quantification of immunofluorescence staining for BrdU (day 3, n = 3). Right, representative immunofluorescence images. Scale bar, 50 μm. All statistical significances were calculated using unpaired two-tailed t-tests. All error bars represent mean ± s.d; n represents independent experiments.
Extended Data Figure 2
Extended Data Figure 2. Treatment with 3DA alleviates oncogene-induced senescence.
a, Representative immunofluorescence images of p16INK4a (red) in IMR90 ER:RAS cells cells 4 days after treatment with 4OHT and 10 μM 3DA or vehicle (DMSO). Scale bar, 100 μm. b, Quantification (n = 3). The statistical significance was calculated using unpaired two-tailed t-test. c, p21CIP1 protein expression in IMR90 ER:RAS cells treated with DMSO or 4OHT to induce senescence or 4OHT and 10 μM 3DA. Normalized nuclear intensity values and mean values on day 3 (left), day 6 (middle), and day 9 (right panel) are shown (n = 200 cells per condition). The statistical significance was calculated using unpaired two-tailed t-tests. d, Timeline of the experiment (left) and crystal violet staining (right). IMR90 ER:RAS cells were treated with 4OHT continuously to induce senescence. On day 6, DMSO or 10 μM 3DA were added (change of media every 3 days). Cells were fixed on day 14. e, Timeline of the experiment (left) and quantification of immunofluorescence staining for p16INK4a (middle) and BrdU (right). IMR90 ER:RAS cells were treated with DMSO for 4 weeks, or 10 μM 3DA for 2 weeks followed by DMSO for 2 weeks, or 10 μM 3DA for 4 weeks. Media was changed every three days. Treatment was started when cells were at passage 14 and ended when cells were at passage 20. At the end of the experiment, p16INK4a protein expression and BrdU-positive cells were quantified. For p16INK4a, normalized nuclear single-cell intensity values and mean of 200 cells are shown. To assess proliferation, percentage of BrdU-positive cells was measured (n = 3). Statistical significances were calculated using one-way ANOVA. All error bars represent mean ± s.d; n represents independent experiments unless otherwise stated.
Extended Data Figure 3
Extended Data Figure 3. Genetic or chemical inhibition of AHCY alleviates oncogene-induced senescence.
a, Left, representative images of immunofluorescence staining for AHCY (red). Scale bar, 50 μm. Right, single-cell intensities for AHCY (n = 1000 cells per condition). The statistical significance was calculated using unpaired two-tailed t-test. b, Left, representative images of immunofluorescence staining for γH2AX (red). Right, quantification of immunofluorescence staining for γH2AX (n = 4). c, Quantification of immunofluorescence staining for BrdU of IMR90 ER:RAS cells four days after treatment with 4OHT or vehicle (DMSO) and 2.5 μM DZNep, 10 μM D-eritadenine, and 4 μM TGF-β RI kinase inhibitor II as positive control. d, Expression levels of AHCY (n = 4). e, Expression levels of INK4a (encoding for p16INK4a, n = 4). f, Principal component analysis (PCA) for the experiment described in Fig 3f. g-h, GSEA signatures from the same experiment. All statistical significances were calculated using one-way ANOVA. All error bars represent mean ± s.d; n represents independent experiments unless otherwise stated.
Extended Data Figure 4
Extended Data Figure 4. Contribution of histone methyltransferases and H3K36 methylation to senescence induction.
a, Quantification of immunofluorescence staining for BrdU of IMR90 ER:RAS cells 4 days after treatment with 4OHT or vehicle (DMSO) and increasing concentrations of GSK126 (an inhibitor of the H3 K27 methylase EZH2), BRD4770 (an inhibitor of the H3 K9 methylase EHMT2) or EPZ004777 (an inhibitor of the H3 K79 methylase DOT1L). T, 4 μM TGF-β RI kinase inhibitor II as positive control (n = 3). All error bars represent mean ± s.d; n represents independent experiments. b, Immunoblot of protein extracts of IMR90 ER:RAS cells after 4OHT induction and treatment with 10 μM 3DA or vehicle (DMSO). Immunoblot of Histone H3 is included as a sample processing control. Immunoblots are a representative experiment out of three. c, Single-cell nuclear intensity values for H3K36me3 in a representative experiment out of 5 (n= 1000 cells per condition). The threshold used to quantify the cells stained for H3K36me3 cells in Fig 4b, is shown as a red dashed line. d, Left, representative immunofluorescence images of histone H3 staining (red) 4 days after 4OHT induction and treatment with 10 μM 3DA or vehicle (DMSO). Scale bar, 100 μm. Right, single-cell nuclear intensity values for histone H3 in a representative experiment out of 3 (n= 1000 cells). e, Left, representative immunofluorescence images of H3K36me3 staining (red) 6 days after treatment with 4OHT and 10 μM 3DA or vehicle (DMSO). Scale bar, 100 μm. Right, quantification (n = 4 independent experiments). All statistical significances were calculated using one-way ANOVA. All error bars represent mean ± s.d.
Extended Data Figure 5
Extended Data Figure 5. Transcriptional profiling after chemical or genetic inhibition of AHCY.
a, Principal component analysis (PCA) for the RNASeq experiment described in Fig 4c. b, Principal component analysis (PCA) including data from the experiments in figure 3f and figure 4c. c, GSEA of RNA-Seq data using signatures for oncogene-induced senescence and SASP. d, GSEA of RNA-Seq data using a signature for Hallmark E2F targets. e, GSEA of H3K36me3 ChIP-Seq data using a signature for SASP. f-g, Representative genome browser snapshots showing H3K36me3 normalized signal at IL12RB2 (module 2, f) and CENPF (module 4, g) gene loci for DMSO (orange), DMSO + 4OHT (green) and 3DA + 4OHT (violet) conditions. Data are expressed as normalized counts per million reads (CPM) in 200bp non-overlapping windows.
Extended Data Figure 6
Extended Data Figure 6. H3K36 methylation is needed for establishing oncogene-induced senescence.
a, Expression levels of NSD2 (n = 4). b, Expression levels of NSD3 (n = 3). c, Expression levels of SMYD2 (n = 4). d, Single-cell nuclear intensity values for H3K36me3 staining 7 days after treatment with 4OHT or vehicle (DMSO) of IMR90 ER:RAS cells infected with different pGIPZ shRNAs against NSD2, NSD3, SMYD2, AHCY or the parental pGIPZ vector (n = 1000 cells per condition for a representative experiment out of 3). The threshold used to quantify the cells stained for H3K36me3 cells in Fig 5b, is shown as a red dashed line. All statistical significances were calculated using one-way ANOVA. All error bars represent mean ± s.d.
Extended Data Figure 7
Extended Data Figure 7. 3-deaazadenosine inhibits reprogramming-induced senescence.
a, Senescence induced in IMR90 cells upon expression of reprogramming factors (OSKM). b, crystal violet stained, IMR90 cells transduced with either and empty vector or OSKM (a vector expressing reprogramming factors OCT4, SOX2, KLF4, cMYC) were treated with 1 μM 3DA or vehicle (DMSO). Images are a representative experiment out of three.
Extended Data Figure 8
Extended Data Figure 8. 3DA rejuvenates geriatric satellite cells.
a-f, Analysis of the experiment described in Fig 6a. a, Expression levels for mouse Cdkn1a mRNA (encoding for p21) in young (2-3 months, n = 7) versus geriatric satellite cells (28-31 months, n = 8). b, Quantification of γH2Ax intensity (arbitrary units: a.u.; n = 75-91 cells). c, Representative images of γH2Ax. d, Quantification of BrdU staining of young (2-3 months, n = 5) versus geriatric satellite cells (28-31 months, n = 7). e-f, Expression levels for mouse Myog (e) and Myh3 mRNA (f) in young (2-3 months, n = 6) versus geriatric (28-31 months, n = 5) satellite cells after the indicated treatments. g, Experimental design. Tibialis anterior muscles were injected with cardiotoxin to induce damage and regeneration. Mice were treated with vehicle or 3DA daily (10 mg/kg, i.p.) and sacrificed at 4 days post muscle injury to assess SA-β-gal activity. h, Left, quantification of SA- β -gal+ cells in the damaged area (n = 4 mice per group). Right, representative images of SA- β -gal staining in cryosections of tibialis anterior muscle. Scale bars 10 μm in c and 50 μm in h. All error bars represent mean ± s.d; n represents number of mice unless otherwise stated. Statistical significances were calculated using two-tailed unpaired t test. This figure was partly generated using Servier Medical Art, provided by Servier, licensed under a Creative Commons Attribution 3.0 unported license.
Extended Data Figure 9
Extended Data Figure 9. 3DA treatment improves liver regeneration in aged mice.
a, Schematic representation of the experiment. Two-year old mice were treated 3 and 1 days before partial hepatectomy (PH) with 3DA or vehicle. The resected liver material was used for γH2AX staining and histopathology. 48h post PH, the rest of the liver was harvested and proliferation level was determined by Ki67 staining. b, Right side shows representative photographs of IF staining with antibody against ƴH2AX and fluorescent DNA stain (DAPI). The inlay shows a magnification of positive nuclei from the respective main photograph. Left side shows the quantification. A significantly higher amount (p<0.05) of γH2AX positive hepatocytes was detected in the control group (vehicle, n = 4) compared to experiment (3DA, n = 3), indicating a reduction in senescent cells. c, Right side shows representative photographs of IF staining with antibody against Ki67 and fluorescent DNA stain (DAPI). Left side shows the quantification. A significantly higher amount (p<0.05) of Ki67 positive hepatocytes were detected in experimental group (3DA, n = 3) compared to control (vehicle, n = 3), indicating that a reduction in senescent hepatocytes is associated with improved proliferation. Statistical significance was calculated using the unpaired two-tailed Student's t test. Error bars are represented as mean ± SEM; n represents number of mice. d-g, Pathological score (quantified blindly in a scale from 0-5) for the indicated parameters were assigned to H&E-stained liver sections from the experimental group (3DA, n = 4) and control group (vehicle, n = 4). Statistical significance was calculated using the unpaired two-tailed Student's t test. Error bars are represented as mean ± SEM; n represents number of mice. This figure was partly generated using Servier Medical Art, provided by Servier, licensed under a Creative Commons Attribution 3.0 unported license.
Extended Data Figure 10
Extended Data Figure 10. 3DA improves the engraftment of umbilical cord blood cells.
a-d, GSEA signatures for the cord blood RNA-seq experiment. e, Cord blood derived human hematopoietic stem and progenitor (CD34+) cells were treated at day 1, 4 and 7 with 10 μM 3DA or DMSO and analysed before xenotransplantation at day nine. Absolute cell numbers were determined by manual cell counting. Data are represented as mean ± SD, n = 4 independent experiments. Statistical significance was calculated using one-tailed Student's t test. f, 1.5x10⁶ Cells from the experiment described in a were transplanted into NSG mice. The engraftment of human (CD45+) cells and the percentage of primitive cells (CD34+CD38-) in the bone marrow was analysed by flow cytometry. For e and f, each shape (open cicle, closed circle, star, square or triangle) represents a different cord blood sample. Each shape is the average of 2-3 transplanted mice with that cord blood sample (n = 4 independent cord blood samples). Statistical significance was calculated using one-tailed Student's t test. g, Gating strategy for the experiment shown in Fig. 7f. h, Gating strategy for the experiment shown in Fig. 7g.
Figure 1
Figure 1. Screen for drugs alleviating senescence identifies 3-deazaadenosine (3DA).
a, Screen in a model of oncogene-induced senescence. Representative immunofluorescence images (top). BrdU incorporation, which indicates proliferation, is stained green. TGF-β RI kinase inhibitor II is included as a positive control. Scale bar, 100 μm. Experimental design for the screen in oncogene-induced senescence using inducible IMR90 ER:RAS cells (bottom). b, BrdU raw values for the screen were normalized using the B score method. 3DA is highlighted in red. c, Screen in a model of senescence induced by telomere uncapping. Representative immunofluorescence images (top). BrdU incorporation, which indicates proliferation, is stained green. Scale bar, 100 μm. Experimental design for the screen in IMR90 tet-TRF2ΔBΔM cells (bottom). d, BrdU raw values for the screen were normalized using the B score method. 3DA is highlighted in red. e, Summary of the screens for drugs alleviating senescence. Venn diagrams (not to scale) show number of drugs passing the filters and overlap between replicative and oncogene-induced senescence. f, Quantification of immunofluorescence staining for BrdU of IMR90 ER:RAS cells 4 days after treatment with 4OHT or vehicle (DMSO) and the 9 senescence inhibitors validated in the screen in both senescence models (n = 3). g, Quantification of immunofluorescence staining for BrdU of IMR90 tet-TRF2ΔBΔM cells 3 days after treatment with doxycycline or vehicle (DMSO) and the 9 senescence inhibitors validated in the screen in both senescence models (n = 3). All statistical significances were calculated using one-way ANOVA. All error bars represent mean ± s.d; n represents independent experiments.
Figure 2
Figure 2. Treatment with 3-deazaadenosine attenuates replicative and oncogene-induced senescence.
a, Left, quantification of immunofluorescence staining for BrdU of IMR90 tet-TRF2ΔBΔM cells 3 days after treatment with doxycycline or vehicle (DMSO) and increasing concentrations of 3DA (n = 4). The statistical significance was calculated using one-way ANOVA. Right, representative immunofluorescence images. BrdU incorporation, which indicates proliferation, is stained in red. Scale bar, 100 μm. b, Left, quantification of immunofluorescence staining for BrdU in young (population doubling (PD) 24) versus old (PD ~38-44) IMR90 cells after treatment with 10 μM 3DA or vehicle (DMSO) (n = 3). The statistical significance was calculated using unpaired two-tailed t-tests. Right, crystal violet-stained, young and old IMR90 cells treated with 3DA or vehicle (DMSO). Images are a representative experiment out of 3. c, Left, quantification of immunofluorescence staining for BrdU of IMR90 ER:RAS cells 4 days after treatment with 4OHT or vehicle (DMSO) and increasing concentrations of 3DA (n = 4). The statistical significance was calculated using one-way ANOVA. Right, crystal violet-stained, six-well dishes of IMR90 ER:RAS cells treated with 3DA or vehicle (DMSO). Images are a representative experiment out of 3. d, Left, representative images of SA-β-Galactosidase staining of IMR90 ER:RAS cells 8 days after treatment with 4OHT or vehicle (DMSO) and 3DA; right, quantification (n = 3). The statistical significance was calculated using one-way ANOVA. Scale bar, 100 μm. e, Single-cell nuclear intensity values for p16INK4a in control and senescent IMR90 ER:RAS cells treated with 10 μM 3DA or vehicle (DMSO) for 6 days in a representative experiment out of 4 (n = 200 cells per condition). The statistical significance was calculated using unpaired two-tailed t-test. All error bars represent mean ± s.d; n represents independent experiments.
Figure 3
Figure 3. AHCY knockdown attenuates replicative and oncogene-induced senescence.
a, Left, crystal violet-stained, old (PD ~40-44) IMR90 cells infected with different pGIPZ shRNAs against AHCY, TP53 or the parental pGIPZ vector. Images are from a representative experiment out of 3. Right, quantification of immunofluorescence staining for BrdU incorporation in cells from the same experiment (n = 3). b, Left, representative images of SA-β-Galactosidase staining. Scale bar, 100 μm; right, quantification (n = 3). c, Quantification of cells expressing p16INK4a as measured by IF (n = 4). d, Left, crystal violet-stained, cultures of IMR90 ER:RAS cells infected with different pGIPZ shRNAs against AHCY, TP53 or the parental pGIPZ vector. Images are a representative experiment out of 3. Right, quantification of immunofluorescence staining for BrdU of cells from the same experiment (n = 5). e, Left, representative images of SA-β-Galactosidase staining. Scale bar, 100 μm; right, quantification (n = 3). f, Left, experimental design for transcriptional profiling of IMR90 ER:RAS cells infected with two different pGIPZ shRNAs against AHCY or the parental pGIPZ vector. Right, GSEA signatures for oncogene-induced senescence and SASP. All statistical significances were calculated using one-way ANOVA. All error bars represent mean ± s.d; n represents independent experiments.
Figure 4
Figure 4. 3DA treatment affects histone H3 K36 methylation during OIS.
a, Immunoblots of histones extracted from IMR90 ER:RAS cells after 4OHT induction and treatment with 10 μM 3DA or vehicle (DMSO). Immunoblot of Histone H3 is included as a sample processing control. Immunoblots are a representative experiment out of three. b, Left, representative immunofluorescence images of H3K36me3 staining (red) in IMR90 ER:RAS cells 4 days after 4OHT induction. Cells were treated with 10 μM 3DA or vehicle (DMSO). Scale bar, 100 μm; right, quantification (n = 5). Statistical significances were calculated using one-way ANOVA. Error bars represent mean ± s.d; n represents independent experiments. c, Experimental design for transcriptional profiling of IMR90 ER:RAS cells 6 days after after 4OHT induction and treatment with 10 μM 3DA or vehicle (DMSO). d, Fold-fold plot comparing fold change in gene expression and ChIP-seq signal in 4OHT versus DMSO treatment. e, Fold-fold plot comparing fold change in gene expression and ChIP-seq signal in 3DA versus 4OHT treatment. The Pearson’s product-moment correlation R and the associated p-value are reported in d and e. f, Heatmap depicting the level of H3K36me3 ChIP-seq signal (Z-score) and the expression level of the closest / overlapping genes (Z-score) for peaks defined as differential between DMSO + OHT vs DMSO, or 3DA + OHT vs DMSO. ChIP-seq data were partitioned into five modules using k-mean clustering. Example genes are displayed on the right side for each module. g, Functional over-representation map depicting enriched hallmark genesets for each module. Circles are colour coded according to the FDR-corrected p-values based on the hypergeometric test. Size is proportional to the percentage of genes in the hallmark gene set belonging to the cluster. hi, Representative genome browser snapshots showing H3K36me3 normalized signal at IL1B (module 2, h) and CDK1 (module 4, i) gene loci for DMSO (orange), DMSO + 4OHT (green) and 3DA + 4OHT (violet) conditions. Data are expressed as normalized counts per million reads (CPM) in 200bp non-overlapping windows.
Figure 5
Figure 5. Interfering with H3K36 methyltransferases affects senescence induction.
a, Eight different methyltransferases - NSD1, NSD2, NSD3, ASH1L, SETD2, SETD3, SMYD2, SETMAR - are involved in the sequence leading to histone H3 tri-methylation at lysine 36. b, Quantification of immunofluorescence staining for H3K36me3 7 days after vehicle (DMSO) or 4OHT induction of IMR90 ER:RAS cells infected with different pGIPZ shRNAs against NSD2, NSD3, SMYD2, AHCY or the parental pGIPZ vector (n = 3). Treatment with 3DA was included as positive control. c, Quantification of immunofluorescence staining for BrdU 4 days after vehicle (DMSO) or 4OHT induction from the experiment described in b (n = 5 except for SMYD2 n = 3). d, Representative immunofluorescence images of H3K36me3 staining (red). Scale bar, 50 μm. Quantification is shown in b. e, Crystal violet-stained, 10 cm dishes of IMR90 ER:RAS from the experiment described in b. All statistical significances were calculated using one-way ANOVA. All error bars represent mean ± s.d; n represents independent experiments.
Figure 6
Figure 6. 3DA enhances the proliferative and engraftment potential of geriatric satellite cells in conditions of muscle damage.
a, Experimental design. Satellite cells isolated from muscles of young (2-3 months, n = 5) versus geriatric (28-31 months, n = 7) mice and were cultured for 7 days. Cells were treated with 10 μM 3DA during 6 days or with 100 ng/ml rapamycin for 2 days as indicated. Results from these experiments are shown in this figure and Extended Data Fig. 8a-d. Quantification of SA-β-Galactosidase staining and expression levels for mouse Ink4a mRNA (encoding for p16Ink4a) are shown. b, Experimental design. Equal numbers of satellite cells isolated from young and geriatric mice, previously treated with 3DA, rapamycin or vehicle, were stained with Dil, and transplanted into pre-injured muscle of recipient immunodeficient mice for 5 days. Representative images of Dil+ cells in cryosections of tibialis anterior muscle after 5 days of engraftment (arrows indicate Dil+ cells) and quantification of Dil+ cells (n = 4 for young; n=5 for geriatric) are shown. c, Experimental design. Equal numbers of satellite cells, freshly isolated from young and geriatric mice, were treated with 3DA or vehicle, transduced with GFP lentivirus, and transplanted into the pre-injured muscle of the recipient immunodeficient mice for 6 days. Representative images of GFP+ fibers in cryosections of tibialis anterior muscle after 6 days of engraftment and quantification of cross-sectional area (CSA) and the number of GFP+ fibers (n = 4 mice per group). Statistical significances were calculated using two-tailed paired t test for geriatric versus geriatric 3DA (Fig 6b) and two-tailed unpaired t test for the rest of the graphs. All error bars represent mean ± s.d; n represents number of mice. Scale bars 20 μm. This figure was partly generated using Servier Medical Art, provided by Servier, licensed under a Creative Commons Attribution 3.0 unported license.
Figure 7
Figure 7. 3-deaazadenosine improves the engraftment of umbilical cord blood cells.
a, Frequency of long-term culture initiating cells of cord blood-derived CD34+ cells upon treatment with 10 μM 3DA or the vehicle (DMSO). The number of cells that needed to be plated for one LTC-IC to develop is indicated. Identically coloured circles indicate paired experimental and control samples that originate from the same cord. Statistical significance was determined using two-tailed Wilcoxon matched-pairs signed rank test (n = 8 independent experiments). b, Experimental design for the cord blood RNA-seq experiment. c, GSEA signature for oxidative stress-induced senescence. d, GSEA signature for Hay bone marrow CD34+ hematopoietic stem cells (HSC). e, Experimental design for the cord blood transplant experiment. f, Cord blood derived human hematopoietic stem and progenitor (CD34+) cells were treated at day 1, 4 and 7 with 10 μM 3DA or DMSO and analysed before xenotransplantation at day nine. Changes in cell surface markers CD34 and CD38 were analyzed by flowcytometry. The percentage of CD34+CD38-cells is shown. Data are represented as mean ± SD. g, 1.5x10⁶ cells from the experiment described in c. were transplanted into NSG mice. The engraftment of human (CD45+) cells in peripheral blood is significantly higher in the 3DA treated group. Data are represented as mean. For f and g, each shape (open cicle, closed circle, star, square or triangle) represents a different cord blood sample. Each shape is the average of 2-3 mice transplanted with that cord blood sample (n = 4 independent cord blood samples). Statistical significance was determined using two-tailed pared t test.

References

    1. Gorgoulis V, et al. Cellular Senescence: Defining a Path Forward. Cell. 2019;179:813–827. - PubMed
    1. Salama R, Sadaie M, Hoare M, Narita M. Cellular senescence and its effector programs. Genes Dev. 2014;28:99–114. - PMC - PubMed
    1. Collado M, et al. Tumour biology: senescence in premalignant tumours. Nature. 2005;436:642. - PubMed
    1. Krizhanovsky V, et al. Senescence of activated stellate cells limits liver fibrosis. Cell. 2008;134:657–667. - PMC - PubMed
    1. Munoz-Espin D, Serrano M. Cellular senescence: from physiology to pathology. Nat Rev Mol Cell Biol. 2014;15:482–496. - PubMed

Publication types