. 2022 Nov 16:23:247-260.
doi: 10.1016/j.bioactmat.2022.10.019. eCollection 2023 May.

Delivery of coenzyme Q10 loaded micelle targets mitochondrial ROS and enhances efficiency of mesenchymal stem cell therapy in intervertebral disc degeneration

Affiliations

Delivery of coenzyme Q10 loaded micelle targets mitochondrial ROS and enhances efficiency of mesenchymal stem cell therapy in intervertebral disc degeneration

Junyuan Sun et al. Bioact Mater. .

Erratum in

Abstract

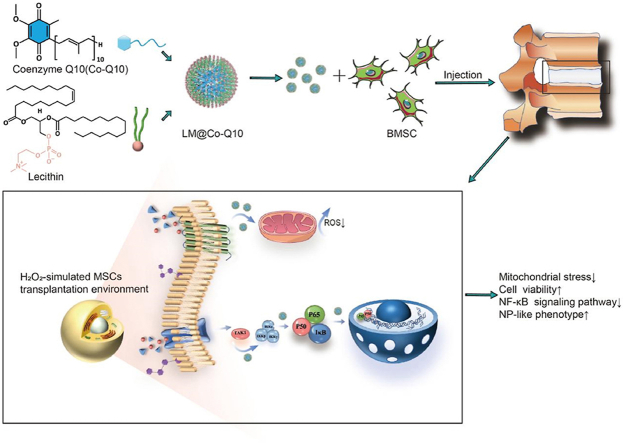
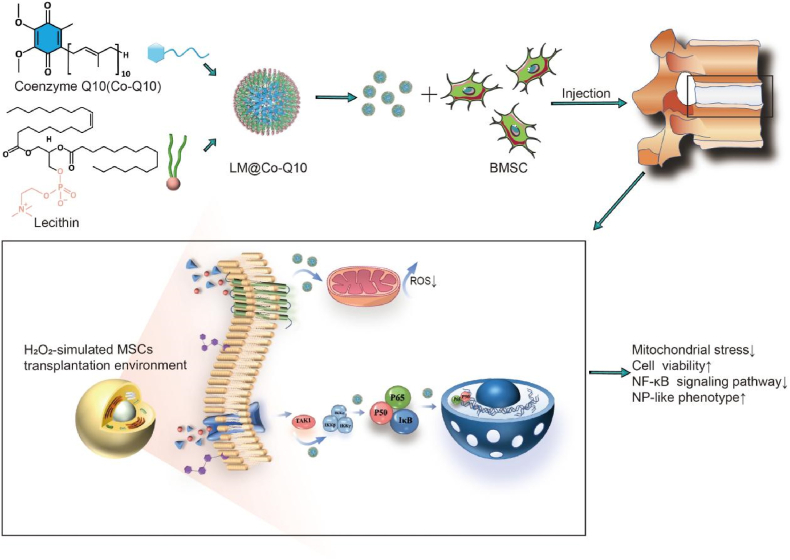
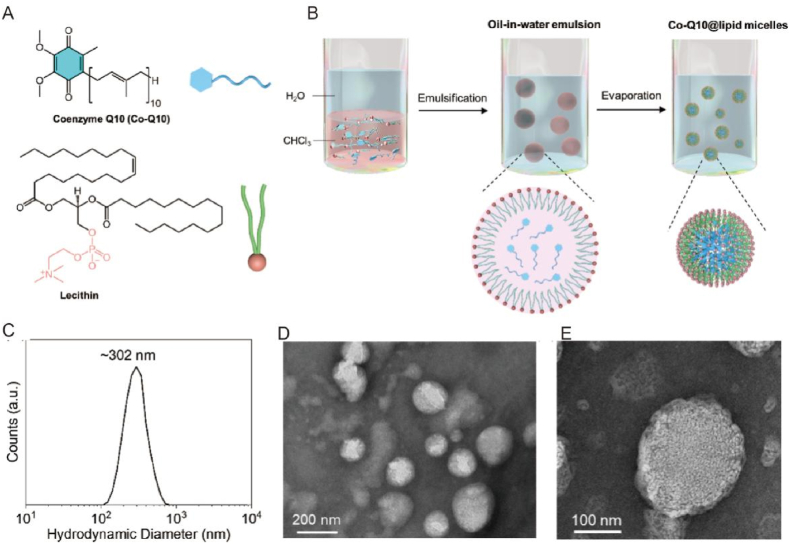
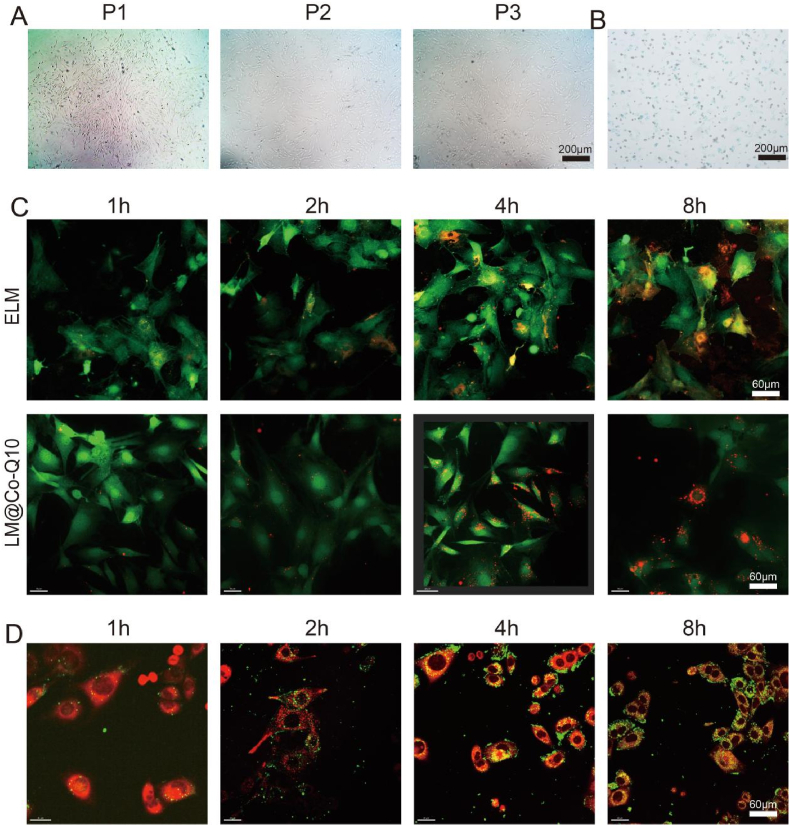
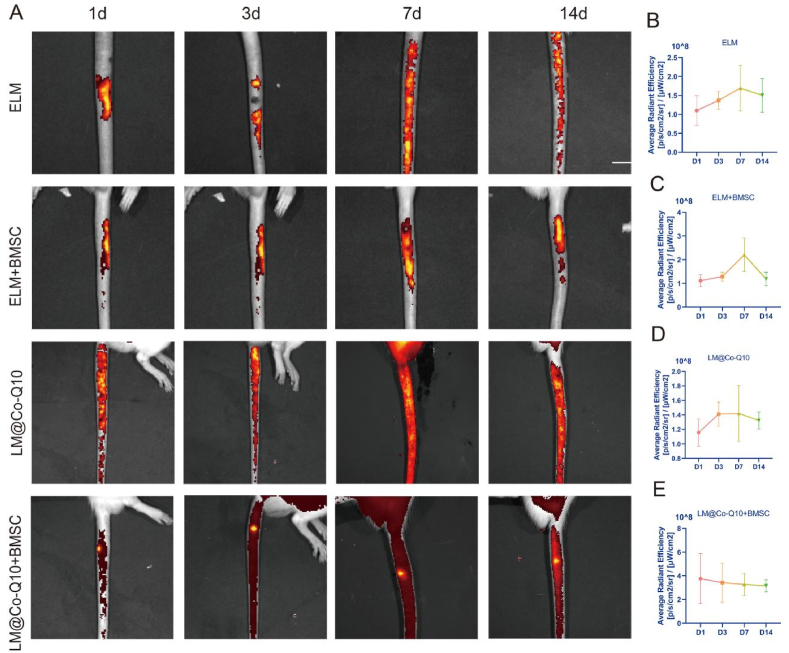
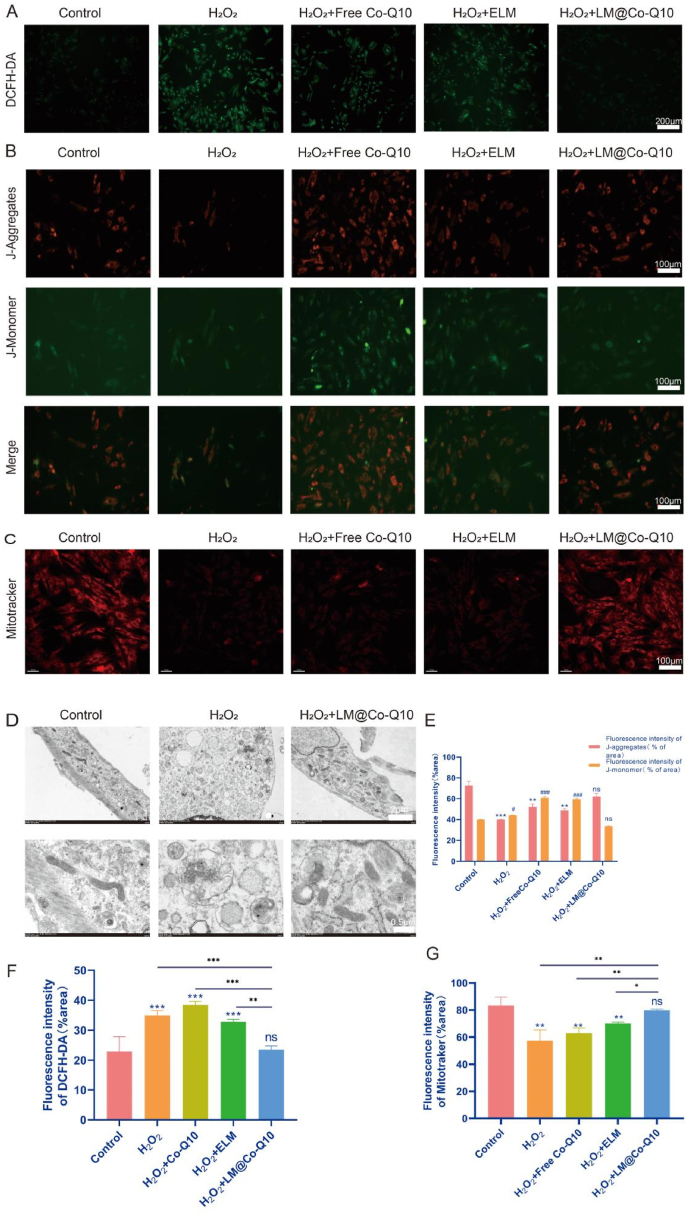
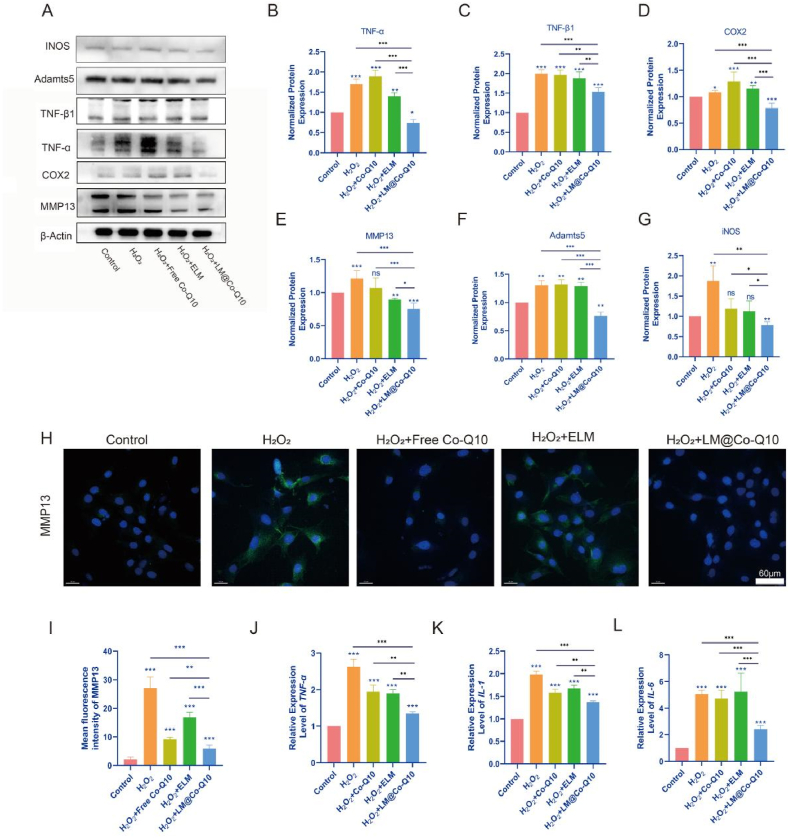
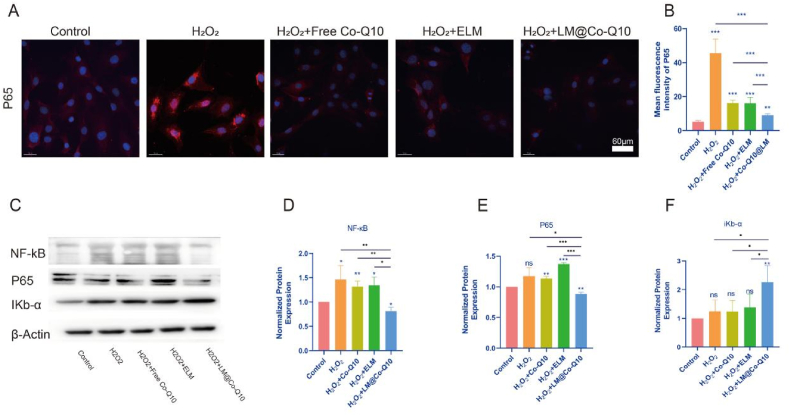
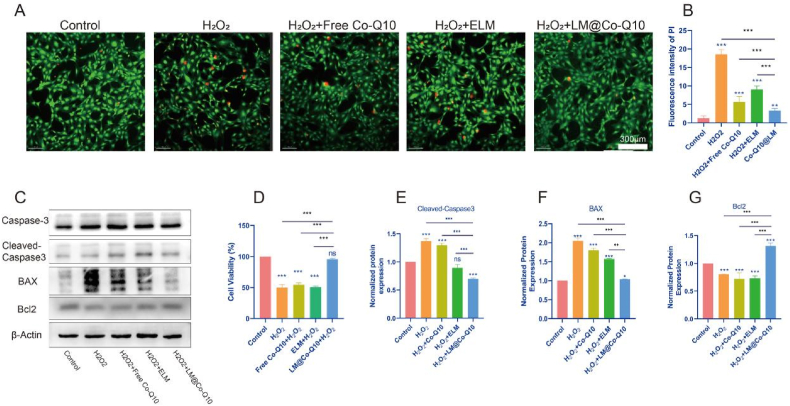
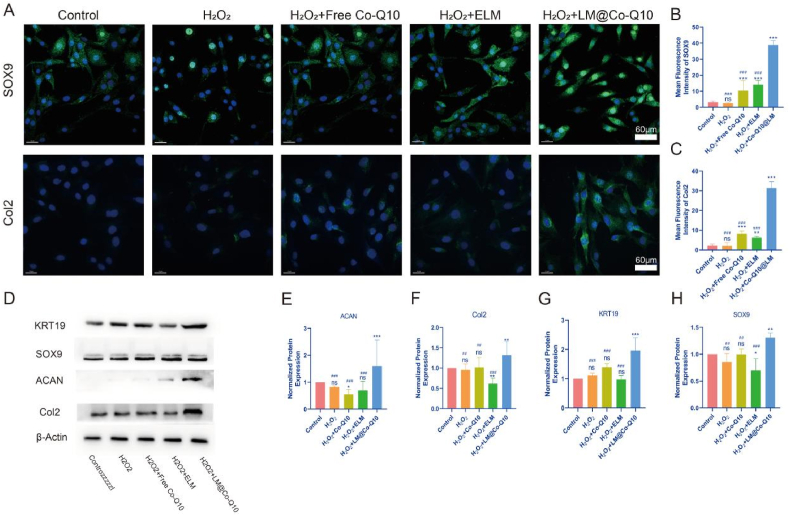
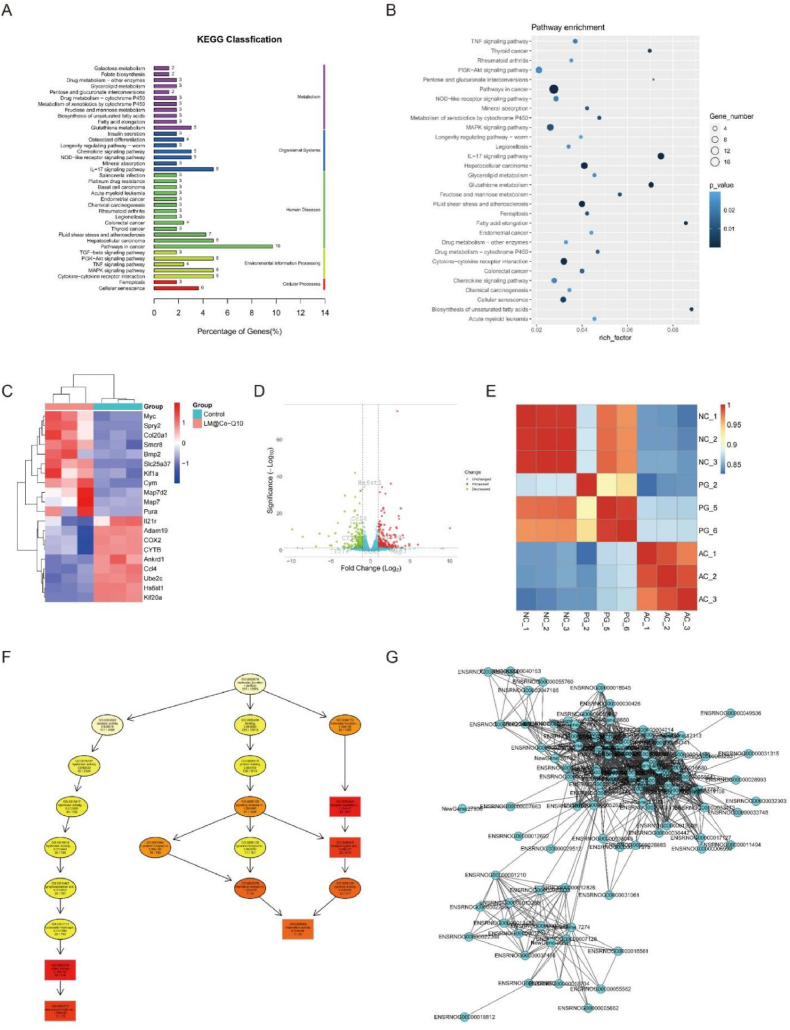
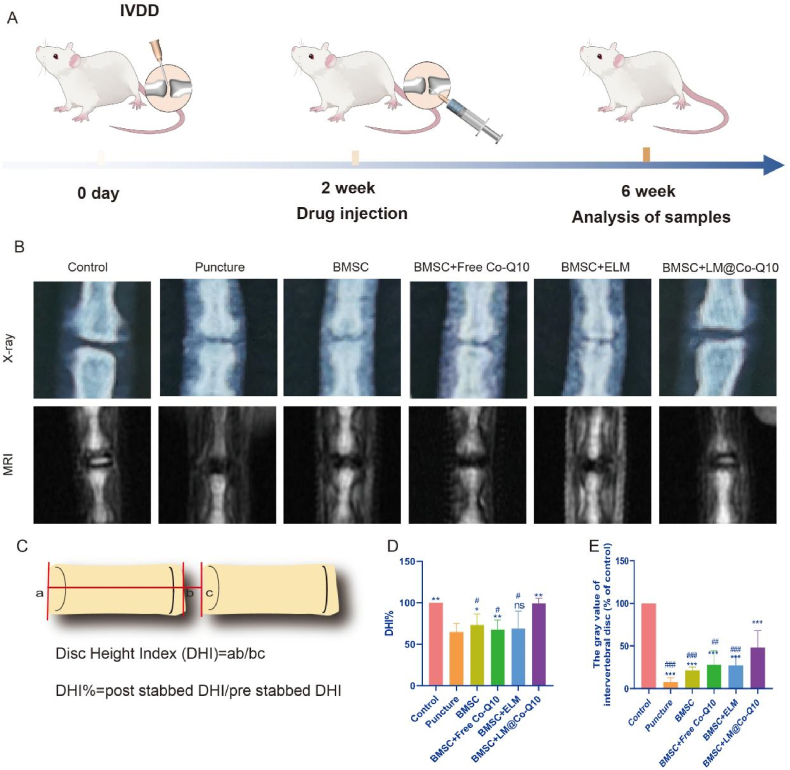
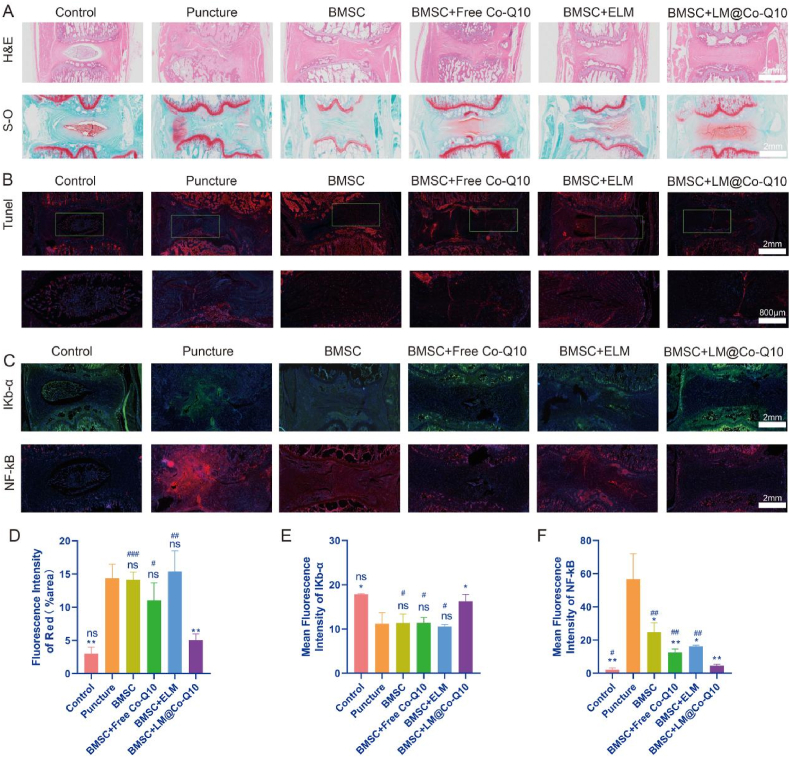
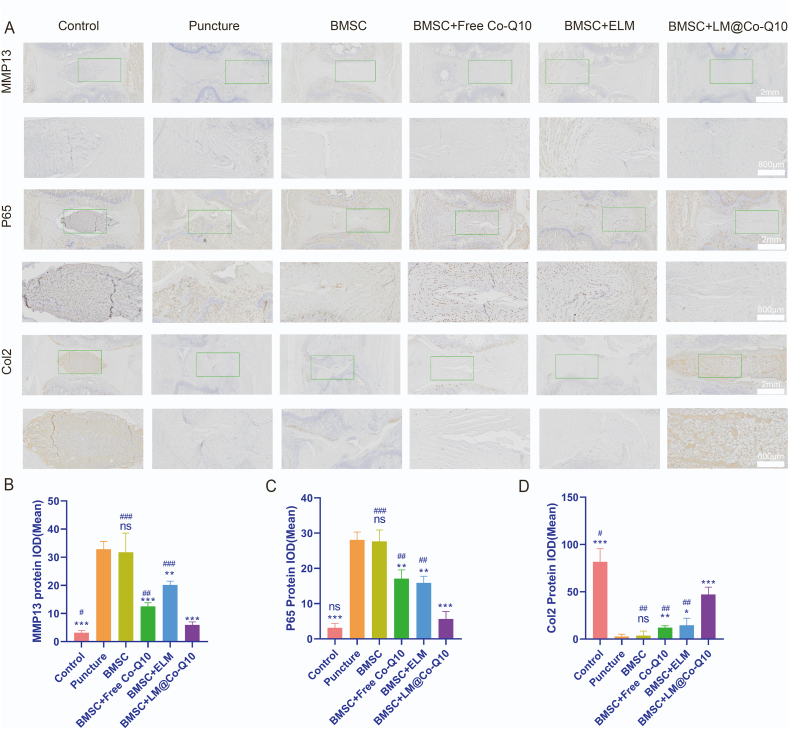
Stem cell transplantation has been proved a promising therapeutic instrument in intervertebral disc degeneration (IVDD). However, the elevation of oxidative stress in the degenerated region impairs the efficiency of mesenchymal stem cells (BMSCs) transplantation treatment via exaggeration of mitochondrial ROS and promotion of BMSCs apoptosis. Herein, we applied an emulsion-confined assembly method to encapsulate Coenzyme Q10 (Co-Q10), a promising hydrophobic antioxidant which targets mitochondria ROS, into the lecithin micelles, which renders the insoluble Co-Q10 dispersible in water as stable colloids. These micelles are injectable, which displayed efficient ability to facilitate Co-Q10 to get into BMSCs in vitro, and exhibited prolonged release of Co-Q10 in intervertebral disc tissue of animal models. Compared to mere use of Co-Q10, the Co-Q10 loaded micelle possessed better bioactivities, which elevated the viability, restored mitochondrial structure as well as function, and enhanced production of ECM components in rat BMSCs. Moreover, it is demonstrated that the injection of this micelle with BMSCs retained disc height and alleviated IVDD in a rat needle puncture model. Therefore, these Co-Q10 loaded micelles play a protective role in cell survival and differentiation through antagonizing mitochondrial ROS, and might be a potential therapeutic agent for IVDD.

Keywords: Coenzyme Q10; Intervertebral disc degeneration; Mesenchymal stem cell; Micelle; Reactive oxygen species.


Conflict of interest statement

The authors declare no competing financial interest.

Figures

Image 1
General schematic of synthesis of injectable Co-Q10-loaded micelle(LM@Co-Q10) as stem cell therapy for intervertebral disc degeneration.
Scheme 1
Scheme 1
General schematic of synthesis of injectable Co-Q10-loaded micelle(LM@Co-Q10) as stem cell therapy for intervertebral disc degeneration.
Fig. 1
Fig. 1
Preparation and characterization of the LM@Co-Q10. (A) Molecular structure of lipid and Co-Q10. (B) Scheme for the preparation procedure. (C) DLS plot of the LM@Co-Q10. (D–E) TEM images of the LM@Co-Q10 negatively stained by uranyl acetate. (Scale bar = 200 nm, 100 nm).
Fig. 2
Fig. 2
Morphology of BMSCs and intracellular uptake and distribution of lipid micelles. (A) The morphology of BMSCs with different algebra. (Scale bar = 200 μm). (B) The β-Galactosidase stain of BMSCs. (Scale bar = 200 μm) (C) Intracellular uptake of ELM and LM@Co-Q10. The ELM and LM@Co-Q10 labeled with DiI appeared red dots, and the cells transfected with GFP lentivirus were green. (Scale bar = 60 μm) (D) The colocalization of LM@Co-Q10 and mitochondrion. The LM@Co-Q10 labeled with DiO appeared green dots, and mitochondria stained red by Mitotraker. (Scale bar = 60 μm).
Fig. 3
Fig. 3
In vivo distribution of lipid micelles. (A) Biodistribution of Different groups. The intervertebral fluorescence signal of rats was shown by IVIS. (B–E) The fluorescence signal intensity for different groups at different time.
Fig. 4
Fig. 4
LM@Co-Q10 suppressed H2O2-induced mitochondrial ROS and oxidative stress in BMSCs. (A) Intracellular ROS detection by DCFH-DA. (Scale bar = 200 μm) (B) Mitochondrial membrane potential of BMSCs assessed through JC-1 assay. JC-1 monomer was stained green, and JC-1 aggregates was stained red. (Scale bar = 100 μm) (C) Mitochondrial function of BMSCs evaluated by Mitotracker. (Scale bar = 100 μm) (D) TEM images of BMSCs in control group, H2O2 group and H2O2+LM@Co-Q10 group. (Scale bar = 2 μm and 500 nm) (E) Relative quantification of JC-1 fluorescence. (F) Quantification of relative ROS level. (G) Relative quantification of Mitotracker fluorescence. The data discussed above were presented as mean ± SD. ns (no statistical significance), *p < 0.05, **p < 0.01 and ***p < 0.001 vs the control group; ns (no statistical significance), #p < 0.05, ##p < 0.01 and ###p < 0.001 vs the LM@Co-Q10 group. n = 3.
Fig. 5
Fig. 5
Attenuation of H2O2-induced inflammatory responses and metabolic disorders in BMSCs by LM@Co-Q10. (A) Expression level of inflammatory response-related proteins on BMSCs with different treatments. (B–G) Quantification of inflammatory response-related proteins was calculated from A by Image J. (H) Immunofluorescence images of MMP13 (green) in different groups of BMSCs. (Scale bar = 60 μm) (I) Quantification of green areas from H using Image J. (J–L) The semi-quantitative analysis of IL-1, IL-6 and TNF-α mRNA expressions. The data were presented as mean ± SD. ns (no statistical significance), *p < 0.05, **p < 0.01 and ***p < 0.001 vs the control group. n = 3.
Fig. 6
Fig. 6
LM@Co-Q10 antagonized the activation of the NF-κB signaling pathway. (A) Immunofluorescence images of P65 (red) in different groups of BMSCs. (Scale bar = 60 μm) (B) Quantification of red areas from A using Image J. (C) Expression level of NF-κB pathway-related proteins on BMSCs with different treatments. (D–F) Quantification of NF-κB pathway-related proteins was calculated from C by Image J. The data were presented as mean ± SD. ns (no statistical significance), *p < 0.05, **p < 0.01 and ***p < 0.001 vs the control group. n = 3.
Fig. 7
Fig. 7
LM@Co-Q10 reduced H2O2 induced-apoptosis of BMSCs. (A) Calcein-AM (green)/PI (red) staining of BMSCs after incubation with various treatments. (Scale bar = 300 μm) (B) Semiquantitative analysis of dead cells stained with PI (red) from A. (C) Expression level of apoptosis-related proteins on BMSCs with different treatments. (D) Cell viability of BMSCs after different treatments. (E–G) Quantification of apoptosis-related proteins was calculated from C by Image J. The data were presented as mean ± SD. ns (no statistical significance), *p < 0.05, **p < 0.01 and ***p < 0.001 vs the control group. n = 3.
Fig. 8
Fig. 8
The differentiation efficiency of BMSCs in the NP with LM@Co-Q10. (A) Representative fluorescence images of SOX9 (red) and Col2 (green) in the NPs under different treatments. (Scale bar = 40 μm, 60 μm) (B,C) Semiquantitative analysis of SOX9 and Col2 from A. (D) Expression level of differentiation-related proteins on BMSCs with different treatments. (E–H) Quantification of differentiation-related proteins was calculated from D by Image J. The data were presented as mean ± SD. ns (no statistical significance), *p < 0.05, **p < 0.01 and ***p < 0.001 vs the control group; #p < 0.05, ##p < 0.01 and ###p < 0.001 vs the LM@Co-Q10 group. n = 3.
Fig. 9
Fig. 9
Biobehavioral differences produced by LM@Co-Q10 treatment of BMSCs. (A) KEGG enrichment analysis of up-regulated pathways in BMSCs in the control and LM@Co-Q10 groups. (B) KEGG bubble plots of the pathways up-regulated in BMSCs in the control and LM@Co-Q10 groups. (C) Heat map of differentially expressed genes in BMSCs in the control group and LM@Co-Q10 group. (D) Volcano plot of differentially expressed genes in BMSCs in the control group and LM@Co-Q10 group. (E) Correlation heat map of gene expression of BMSCs in the control group, H2O2 group and LM@Co-Q10 group. (F) Results of GO enrichment analysis for the top 10 directed acyclic plots. (G) Different gene-gene interaction networks in the control group and LM@Co-Q10 groups. n = 3.
Fig. 10
Fig. 10
Radiological evaluation in vivo. (A) Schematic illustration of the puncture-induced IVDD model and LM@Co-Q10 injection for the treatment. (B) X-ray and MRI images of the caudal vertebrae of rats at 4 weeks after different treatments. (C) The measurement schematic and formulas of disc height index. (D) Changes in disc height at 4 weeks after different treatments on X-ray. (E) Changes in discs at 4 weeks after different treatments on MRI. The data were presented as mean ± SD. ns (no statistical significance), *p < 0.05, **p < 0.01 and ***p < 0.001 vs the puncture group; #p < 0.05, ##p < 0.01 and ###p < 0.001 vs the BMSCs + LM@Co-Q10 group. n = 3.
Fig. 11
Fig. 11
Histological images in vivo. (A) H&E and Safranin O-fast green staining of NP in different groups. (Scale bar = 2 mm) (B) Tunel staining of NP in different groups (TUNEL positive: red). (Scale bar = 2 mm, 800 μm) (C) In vivo immunofluorescence images of NF-κB and IKB-α in the NP in different groups. (Scale bar = 2 mm) (D) Quantification of red areas from B. (E, F) Mean fluorescence intensity of NF-κB and IKB-α. The data were presented as mean ± SD. ns (no statistical significance), *p < 0.05, **p < 0.01 and ***p < 0.001 vs the puncture group; ns (no statistical significance), #p < 0.05, ##p < 0.01 and ###p < 0.001 vs the BMSCs + LM@Co-Q10 group. n = 3.
Fig. 12
Fig. 12
Immunohistochemistry images in vivo. (A) IHC analysis of MMP13, P65 and Col2 in the NP in different groups (IHC positive: brown). (Scale bar = 2 mm, 800 μm) (B–D) Quantitative analysis of MMP13, P65 and Col2 in various treatments. The data were presented as mean ± SD. ns (no statistical significance), *p < 0.05, **p < 0.01 and ***p < 0.001 vs the puncture group; ns (no statistical significance), #p < 0.05, ##p < 0.01 and ###p < 0.001 vs the BMSCs + LM@Co-Q10 group. n = 3.

References

    1. GBD 2017 Disease and Injury Incidence and Prevalence Collaborators Global, regional, and national incidence, prevalence, and years lived with disability for 354 diseases and injuries for 195 countries and territories, 1990-2017: a systematic analysis for the Global Burden of Disease Study 2017. Lancet (London, England) 2018;392(10159):1789–1858. doi: 10.1016/S0140-6736(18)32279-7. - DOI - PMC - PubMed
    1. Stevans J.M., Delitto A., Khoja S.S., Patterson C.G., Smith C.N., Schneider M.J., Freburger J.K., Greco C.M., Freel J.A., Sowa G.A., Wasan A.D., Brennan G.P., Hunter S.J., Minick K.I., Wegener S.T., Ephraim P.L., Friedman M., Beneciuk J.M., George S.Z., Saper R.B. Risk factors associated with transition from acute to chronic low back pain in US patients seeking primary care. JAMA Netw. Open. 2021;4(2) doi: 10.1001/jamanetworkopen.2020.37371. - DOI - PMC - PubMed
    1. Sun B., Lian M., Han Y., Mo X., Jiang W., Qiao Z., Dai K. A 3D-Bioprinted dual growth factor-releasing intervertebral disc scaffold induces nucleus pulposus and annulus fibrosus reconstruction. Bioact. Mater. 2020;6(1):179–190. doi: 10.1016/j.bioactmat.2020.06.022. - DOI - PMC - PubMed
    1. Li J., Marmorat C., Vasilyev G., Jiang J., Koifman N., Guo Y., Talmon I., Zussman E., Gersappe D., Davis R., Rafailovich M. Flow induced stability of pluronic hydrogels: injectable and unencapsulated nucleus pulposus replacement. Acta Biomater. 2019;96:295–302. doi: 10.1016/j.actbio.2019.07.021. - DOI - PubMed
    1. Nadeau M., McLachlin S.D., Bailey S.I., Gurr K.R., Dunning C.E., Bailey C.S. A biomechanical assessment of soft-tissue damage in the cervical spine following a unilateral facet injury. J. Bone Jt. Surg. Am. Vol. 2012;94(21) doi: 10.2106/JBJS.K.00694. - DOI - PubMed

LinkOut - more resources