. 2022 Nov 11:13:1035532.
doi: 10.3389/fimmu.2022.1035532. eCollection 2022.

Type I interferon receptor (IFNAR2) deficiency reveals Zika virus cytopathicity in human macrophages and microglia

Affiliations

Type I interferon receptor (IFNAR2) deficiency reveals Zika virus cytopathicity in human macrophages and microglia

Aidan T Hanrath et al. Front Immunol. .

Abstract

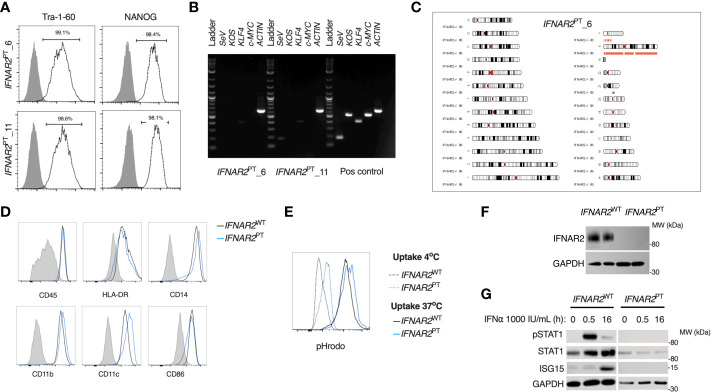
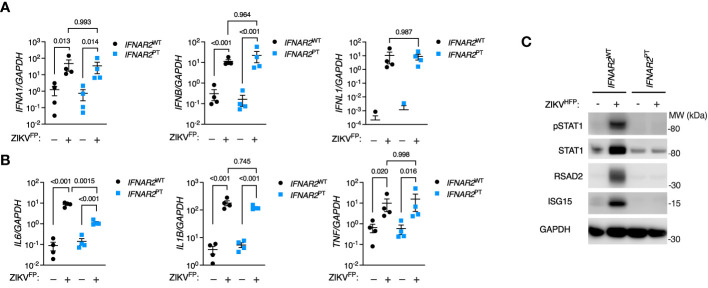
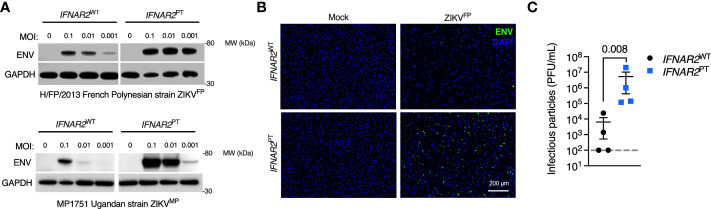
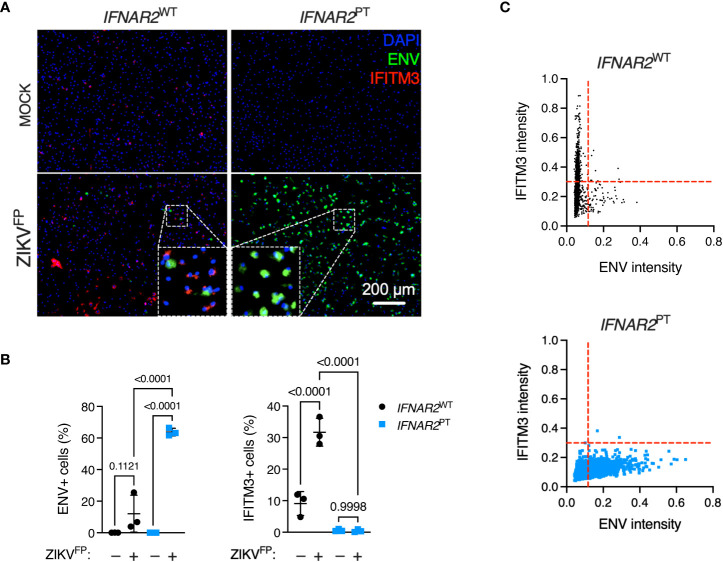
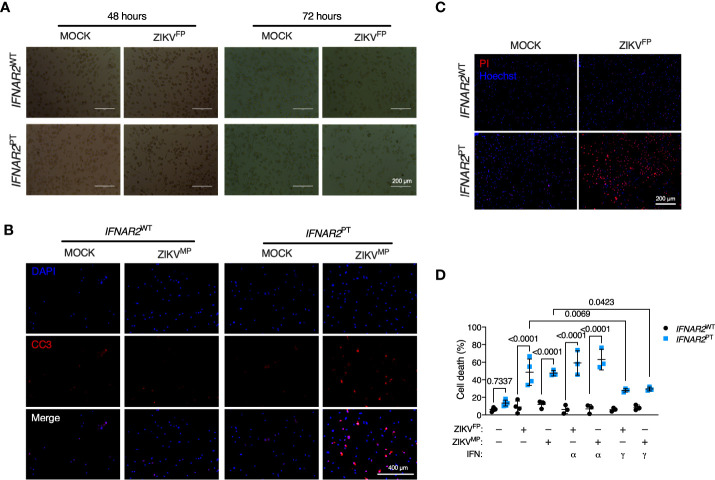
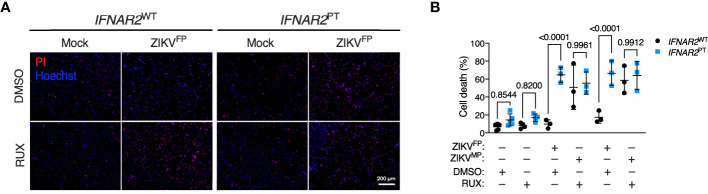
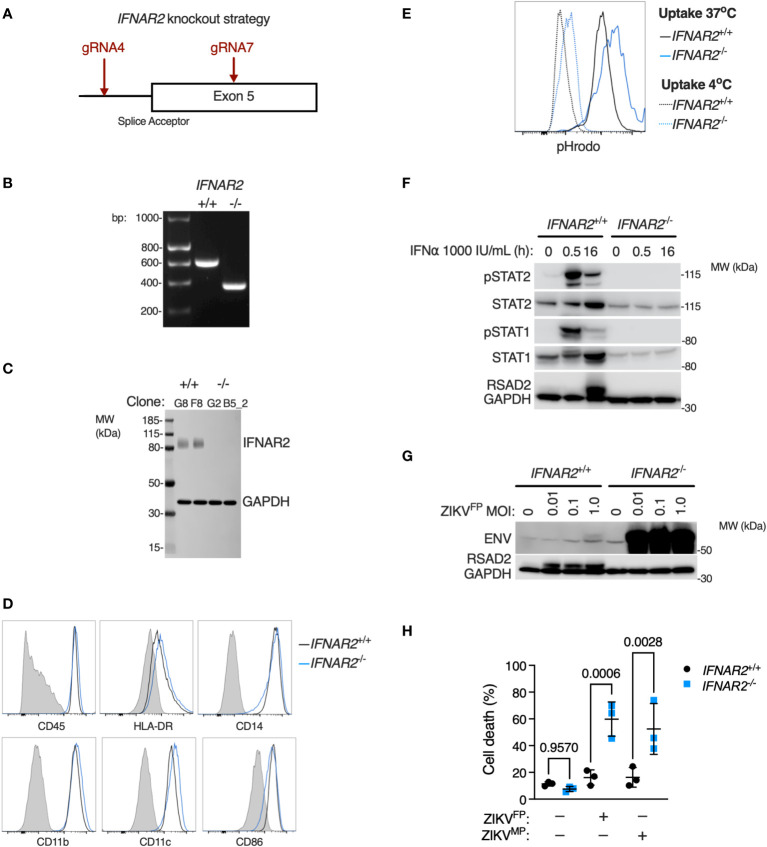
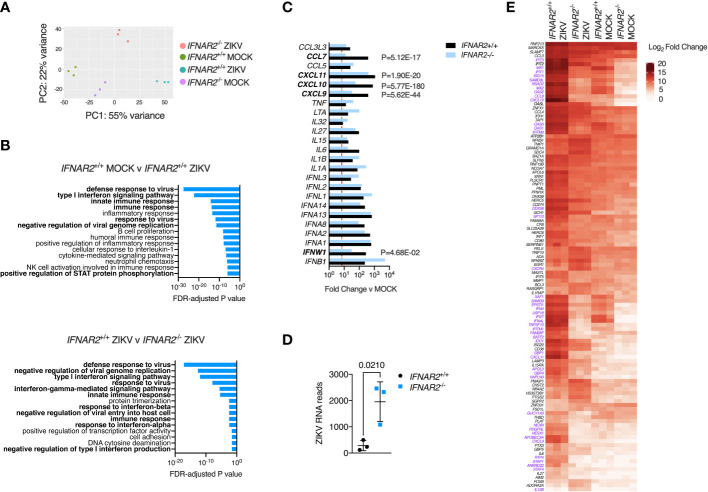
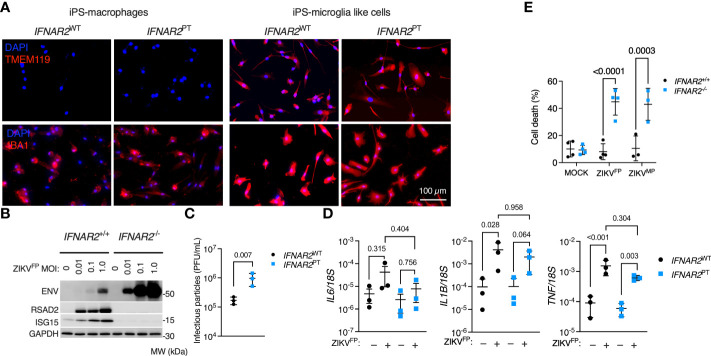
Macrophages are key target cells of Zika virus (ZIKV) infection, implicated as a viral reservoir seeding sanctuary sites such as the central nervous system and testes. This rests on the apparent ability of macrophages to sustain ZIKV replication without experiencing cytopathic effects. ZIKV infection of macrophages triggers an innate immune response involving type I interferons (IFN-I), key antiviral cytokines that play a complex role in ZIKV pathogenesis in animal models. To investigate the functional role of the IFN-I response we generated human induced pluripotent stem cell (iPSC)-derived macrophages from a patient with complete deficiency of IFNAR2, the high affinity IFN-I receptor subunit. Accompanying the profound defect of IFN-I signalling in IFNAR2 deficient iPS-macrophages we observed significantly enhanced ZIKV replication and cell death, revealing the inherent cytopathicity of ZIKV towards macrophages. These observations were recapitulated by genetic and pharmacological ablation of IFN-I signalling in control iPS-macrophages and extended to a model of iPS-microglia. Thus, the capacity of macrophages to support noncytolytic ZIKV replication depends on an equilibrium set by IFN-I, suggesting that innate antiviral responses might counterintuitively promote ZIKV persistence via the maintenance of tissue viral reservoirs relevant to pathogenesis.

Keywords: IFNAR2 deficiency; Zika virus; antiviral state; cell death; inborn errors of immunity; interferon-stimulated genes; macrophages; type I interferons.


Conflict of interest statement

SH declares honoraria from CSL Behring and Takeda for teaching and consultancy. The remaining authors declare that the research was conducted in the absence of any commercial or financial relationships that could be construed as a potential conflict of interest.

Figures

Figure 1
Figure 1
A model of IFNAR2 deficient human iPS-macrophages (IFNAR2 PT iPS-Mϕ). (A) Expression of pluripotency markers by IFNAR2 PT iPSC clones 6 and 11 by flow cytometry.(B) PCR showing clearance of Sendai virus vector from IFNAR2 PT iPSC clones 6 and 11. (C) Karyogram produced from SNP array showing no gross abnormalities in the previously unpublished IFNAR2 PT iPSC clone 6. Red bars indicate loss or single copy, grey indicates loss of heterozygosity on chromosome 21 in the region of IFNAR2 (representative of data in IFNAR2 PT clone 11). (D) Expression of macrophage surface markers in IFNAR2 PT (clone 6) and IFNAR2 WT (WT1) iPS-Mϕ by flow cytometry, representative of repeat experiments in IFNAR2 PT clone 11 and WT2. (E) Phagocytic uptake of Zymosan pHrodo particles in IFNAR2 PT (clone 6) and IFNAR2 WT (WT1) iPS-Mϕ, representative of repeat experiments in clone 11 and WT2. (F) Immunoblot of IFNAR2 and GAPDH in IFNAR2 WT (WT2) and IFNAR2 PT (clone 11) iPS-Mϕ, representative of repeat experiments in WT1 and clone 6. (G) Immunoblot of IFN-I signalling in IFNα2b (1000 IU/mL) treated IFNAR2 PT (clone 11) and IFNAR2 WT (WT1) iPS-Mϕ, representative of n = 3 independent experiments.
Figure 2
Figure 2
IPS-macrophages mount a robust IFN-I response to ZIKV infection. (A) RT-PCR quantification of IFNA1, IFNB and IFNL1 relative to GAPDH (24 h.p.i. ZIKVFP MOI = 10.0, n = 4 independent experiments in IFNAR2 WT [WT2] and IFNAR2 PT [clone 6]). Mean ± SD, ANOVA with Sidak’s test for multiple comparisons. (B) RT-PCR quantification of IL6, TNF and IL1B relative to GAPDH (24 h.p.i. ZIKVFP MOI=10.0, n = 4 independent experiments in IFNAR2 WT [WT2] and IFNAR2 PT [clone 6]). Mean ± SD, ANOVA with Sidak’s test for multiple comparisons. (C) Immunoblot of pSTAT1, STAT1, RSAD2, GAPDH and ISG15 in IFNAR2 WT (WT2) and IFNAR2 PT (clone 11) iPS-Mϕ (48 h.p.i. ZIKVFP MOI=1.0), representative of n = 3 independent experiments including IFNAR2 PT (clone 6) and IFNAR2 WT (WT1) iPS-Mϕ.
Figure 3
Figure 3
Enhanced ZIKV replication in IFNAR2 deficient iPS-macrophages. (A) Immunoblot of ENV and GAPDH expression in IFNAR2 WT (WT2) and IFNAR2 PT (clone 11) iPS-Mϕ, 72 h.p.i. with Asian lineage (ZIKVFP) and African lineage (ZIKVMP) at the MOI demonstrated, representative of n = 3 independent experiments. (B) Immunofluorescence analysis of ENV expression in IFNAR2 WT (WT2) and IFNAR2 PT (clone 11) iPS-Mϕ (24 h.p.i. with ZIKVFP MOI=1.0), representative of n = 3 independent experiments. (C) Plaque assay on Vero cells of ZIKV infectious particles in supernatants (48 h.p.i. ZIKVFP MOI = 0.001, n = 4 independent experiments in IFNAR2 WT [clones WT1 & WT2] and IFNAR2 PT [clones 6 & 11]). Mean ± SD, t test.
Figure 4
Figure 4
IFN-I mediates paracrine protection of iPS-macrophages. (A) Immunofluorescence analysis of ZIKV ENV and IFITM3 expression in IFNAR2 PT (clone 11) and IFNAR2 WT (WT2) iPS-Mϕ (24 h.p.i. ZIKVFP MOI = 10.0). Representative images from one of three independent experiments are shown. Scale bar = 200 μm. (B) CellProfiler quantification of images in (A) showing proportion of cells expressing ZIKV ENV (left panel) or the ISG IFITM3 (right panel). Mean ± SD of n = 3 independent experiments, ANOVA with Sidak’s test for multiple comparisons. (C) CellProfiler analysis of single cell expression of ENV and IFITM3 in IFNAR2 WT and IFNAR2 PT iPS-Mϕ from images in (A), n = 2,434 (WT) cells and n = 2,202 (PT) cells respectively. Red dotted lines represent gating. Representative data from one of three independent experiments.
Figure 5
Figure 5
IFNAR2-deficient iPS-macrophages are vulnerable to ZIKV cytopathic effects. (A) Progressive cytopathicity in IFNAR2 PT (clone 6) but not IFNAR2 WT (WT2) iPS-Mϕ following infection with ZIKVFP MOI = 1.0, showing morphological features of cell shrinkage, membrane blebbing and cell fragmentation. Scale bar, 200 μm. (B) Immunofluorescence analysis of cleaved caspase 3 (CC3) at 48 h.p.i. ZIKVMP MOI = 1.0. Representative images of two independent experiments. Scale bar, 400 μm. (C) Immunofluorescence analysis of cell viability showing representative images of cell death at 72 h.p.i. ZIKVFP MOI = 1.0 in IFNAR2 PT (clone 11) but not IFNAR2 WT (WT2) iPS-Mϕ, representative of n = 4 independent experiments. Scale bar, 200 μm. (D) CellProfiler quantification of cell viability assay in IFNAR2 PT (clone 11) and IFNAR2 WT (WT1 and WT2) iPS-Mϕ with or without recombinant IFNα2b or IFNγ (1000 IU/mL) pretreatment. 72 h.p.i. ZIKVFP MOI = 1.0 (n = 4 independent experiments) or ZIKVMP MOI = 1.0 (n = 3 independent experiments). Mean ± SD, ANOVA with Sidak’s test for multiple comparisons.
Figure 6
Figure 6
JAK inhibition recapitulates ZIKV cytopathicity in wild-type iPS-macrophages. (A) Immunofluorescence analysis of cell viability showing representative images of cell death at 72 h.p.i. in IFNAR2 WT (WT1) and IFNAR2 PT (clone 11) iPS-Mϕ treated with RUX (10 uM) or DMSO control (ZIKVFP MOI = 1.0, representative images of n = 4 independent experiments). Scale bar = 200 μm. PI = propidium iodide. (B) CellProfiler quantification of cell viability assay in IFNAR2 PT (clone 11) and IFNAR2 WT (WT1 and WT2) iPS-Mϕ treated with RUX (10 uM) or DMSO control (72 h.p.i. ZIKVFP MOI = 1.0, n = 4 independent experiments and ZIKVMP MOI = 1.0, n = 3 independent experiments). Mean ± SD, ANOVA with Sidak’s test for multiple comparisons. .
Figure 7
Figure 7
IFNAR2 knockout in wild-type iPS-macrophages recapitulates heightened ZIKV replication and cytopathicity. (A) CRISPR/Cas9 guide design. (B) PCR of IFNAR2 amplicon demonstrating exon 5 splice acceptor site excision in iPSC clones (G8 and G2). Representative of experiments in clones F8 and B5_2. (C) Immunoblot of IFNAR2 and GAPDH expression, demonstrating IFNAR2 ablation in iPS-Mϕ clones (G8, F8, G2, B5_2). Representative of n=2 independent experiments. (D) Expression of macrophage surface markers in IFNAR2 -/- (B5_2) and IFNAR2 +/+ (F8) iPS-Mϕ by flow cytometry, representative of repeat experiments in F8/B5_2. (E) Phagocytic uptake of Zymosan pHrodo particles in IFNAR2 -/- (B5_2) and IFNAR2 +/+ (F8) iPS-Mϕ by flow cytometry, representative of repeat experiments in F8/B5_2. (F) Immunoblot of IFN-I signalling in IFNα2b (1000 IU/mL) treated IFNAR2 -/- (B5_2) and IFNAR2 +/+ (F8) iPS-Mϕ, representative of n = 3 independent experiments. (G) Immunoblot of ENV, RSAD2 and GAPDH expression in IFNAR2 -/- (B5_2) and IFNAR2 +/+ (F8) iPS-Mϕ, 72 h.p.i. post infection, representative of n=3 independent experiments. (H) CellProfiler quantification of cell viability assay in IFNAR2 -/- (G2, B5_2) and isogenic IFNAR2 +/+ (G8, F8) iPS-Mϕ (72 h.p.i. ZIKVFP or ZIKVMP MOI = 1.0, n = 3 independent experiments). Mean ± SD, ANOVA with Sidak’s test for multiple comparisons.
Figure 8
Figure 8
IFN-I signalling dominates the transcriptional response to ZIKV infection. (A) Principal component analysis of RNA-seq data (24 h.p.i. ZIKVFP MOI = 1.0, n=3 biological replicates in isogenic IFNAR2 -/- [B5_2] and IFNAR2 +/+ [F8] iPS-Mϕ). (B) Gene ontology analysis (FDR<5%) of RNA-seq data, comparing mock v infected IFNAR2 +/+ iPS-Mϕ (top) and IFNAR2 -/- v IFNAR2 +/+ iPS-Mϕ (bottom). Selected pathways highlighted in bold. (C) Significantly differentially expressed DE IFN, chemokine and cytokine genes, comparing mock v ZIKV exposed conditions for IFNAR2 +/+ (black bars) or IFNAR2 -/- genotype (blue bars). Genes not reaching the DE threshold (Log2 FC ≥ 3, FDR < 5%) in both genotypes are not displayed. Red dotted line represents FC threshold (Log2 FC ≥ 3). FDR-adjusted P values are also included for significantly DE genes (in bold) comparing IFNAR2 -/- and IFNAR2 +/+ ZIKV exposed datasets. (D) Aligned ZIKV reads from data in (A), mean ± SD, t test. (E) Heatmap displaying expression of annotated macrophage-specific ISGs. Colour intensity reflects Log2 FC. Significantly DE genes (Log2 FC ≥ 3, FDR < 5%) are shown in purple text for the comparison of IFNAR2 -/- and IFNAR2 +/+ ZIKV exposed datasets.
Figure 9
Figure 9
Enhanced ZIKV infection and CPE in IFNAR2-deficient iPS-microglia-like cells. (A) Immunofluorescence analysis of microglial markers IBA1 and TMEM119 in IFNAR2 PT (PT clone 11) and IFNAR2 WT (WT2) iPS-Mϕ and iPS-microglia-like cells (iPS-MGLs), representative of repeat experiments in G2, B5_2, G8 and F8 lines. Scale bar = 100 μm. (B) Immunoblot of ENV, RSAD2, ISG15, GAPDH in ZIKVFP-infected IFNAR2 +/+ (F8) and IFNAR2 -/- (B5_2) iPS-MGLs at 72 h.p.i., representative of n = 3 independent experiments in IFNAR2 PT [clones 6 and 11] and IFNAR2 WT [WT2]). (C) Plaque assay on Vero cells of ZIKV infectious particles in supernatants (48 h.p.i. ZIKVFP MOI = 1, n = 3 independent experiments in IFNAR2 WT (WT2) and IFNAR2 PT (clone 6) iPS-microglia-like cells. Mean ± SD, t test. (D) RT-PCR quantification of IL6, IL1B and TNF relative to 18S (24 h.p.i. ZIKVFP MOI = 1, n = 3 independent experiments in IFNAR2 WT [WT2] and IFNAR2 PT [clones 6 and 11]) microglia-like cells. Mean ± SD, ANOVA with Sidak’s test for multiple comparisons. (E) Cell viability assay (72 h.p.i. ZIKVFP MOI = 1.0 [n = 4 independent experiments] or ZIKVMP MOI = 1.0 [n = 3 independent experiments]) in IFNAR2 -/- (B5_2), IFNAR2 PT (clone 6), IFNAR2 +/+ (F8) and IFNAR2 PT (WT2) iPS-MGLs. Mean ± SD, ANOVA with Sidak’s test for multiple comparisons.

References

    1. Pannu J, Barry M. Global health security as it pertains to zika, Ebola, and COVID-19. Curr Opin Infect Dis (2021) 34:401–8. doi: 10.1097/QCO.0000000000000775 - DOI - PubMed
    1. Pierson TC, Diamond MS. The emergence of zika virus and its new clinical syndromes. Nature (2018) 560:573–81. doi: 10.1038/s41586-018-0446-y - DOI - PubMed
    1. Russell K, Hills SL, Oster AM, Porse CC, Danyluk G, Cone M, et al. . Male-to-Female sexual transmission of zika virus-united states, January-April 2016. Clin Infect Dis (2017) 64:211–3. doi: 10.1093/cid/ciw692 - DOI - PubMed
    1. Pardy RD, Valbon SF, Richer MJ. Running interference: Interplay between zika virus and the host interferon response. Cytokine (2019) 119:7–15. doi: 10.1016/j.cyto.2019.02.009 - DOI - PubMed
    1. Nikitina E, Larionova I, Choinzonov E, Kzhyshkowska J. Monocytes and macrophages as viral targets and reservoirs. Int J Mol Sci (2018) 19:2821. doi: 10.3390/ijms19092821 - DOI - PMC - PubMed

Publication types