. 2022 Nov 11:13:1044662.
doi: 10.3389/fimmu.2022.1044662. eCollection 2022.

MyD88-dependent signaling drives toll-like receptor-induced trained immunity in macrophages

Affiliations

MyD88-dependent signaling drives toll-like receptor-induced trained immunity in macrophages

Allison M Owen et al. Front Immunol. .

Abstract

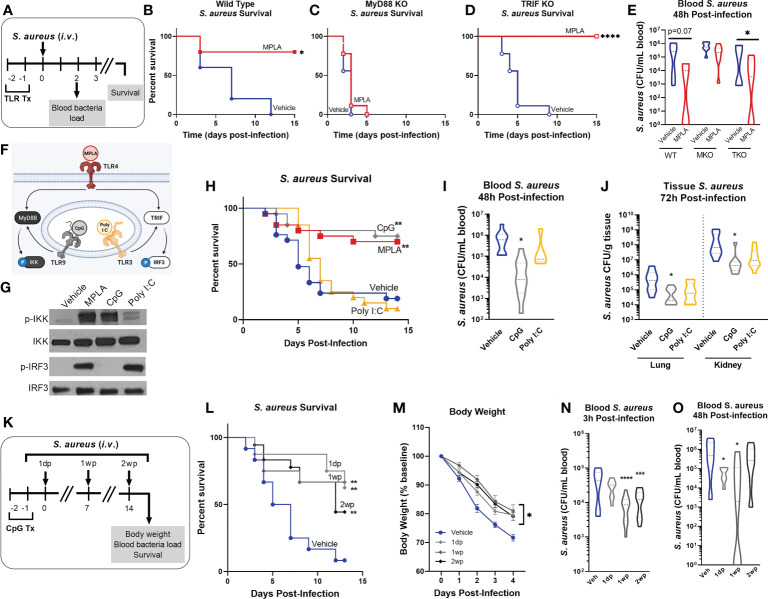
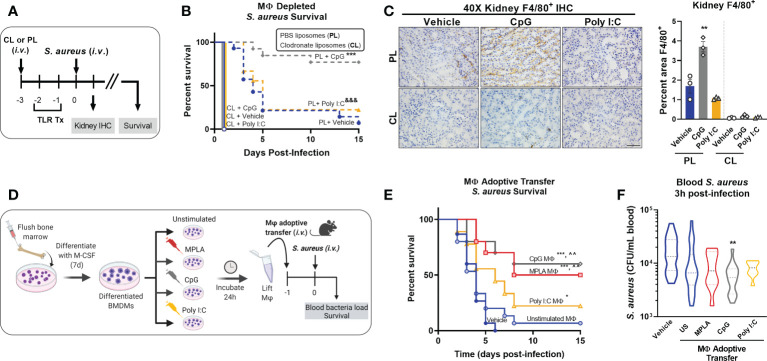
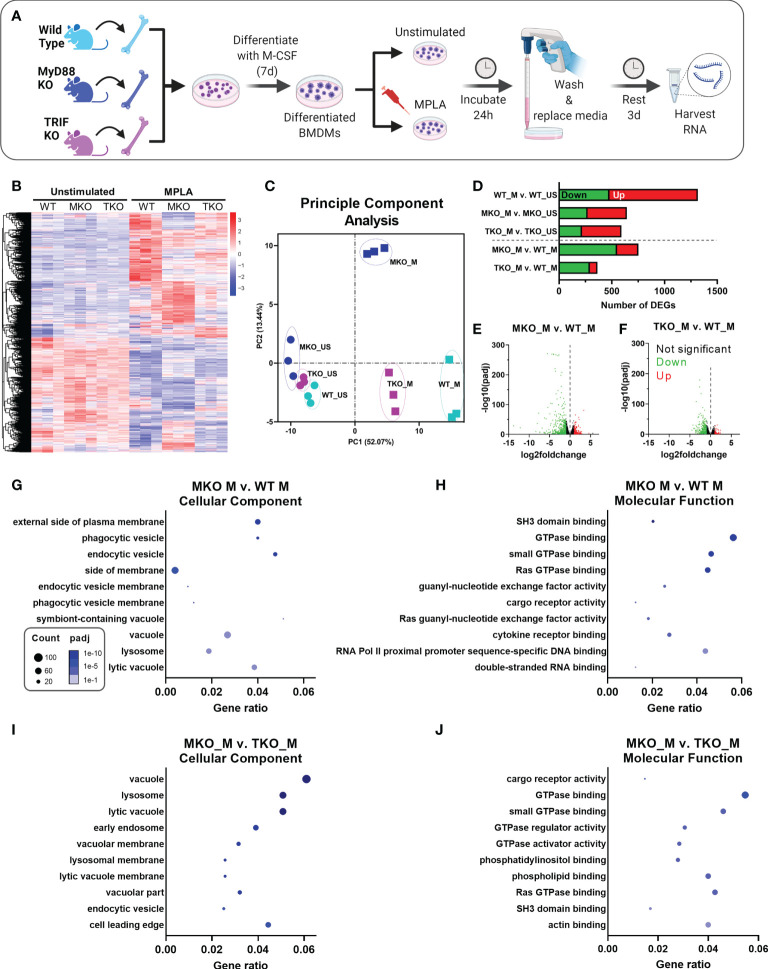
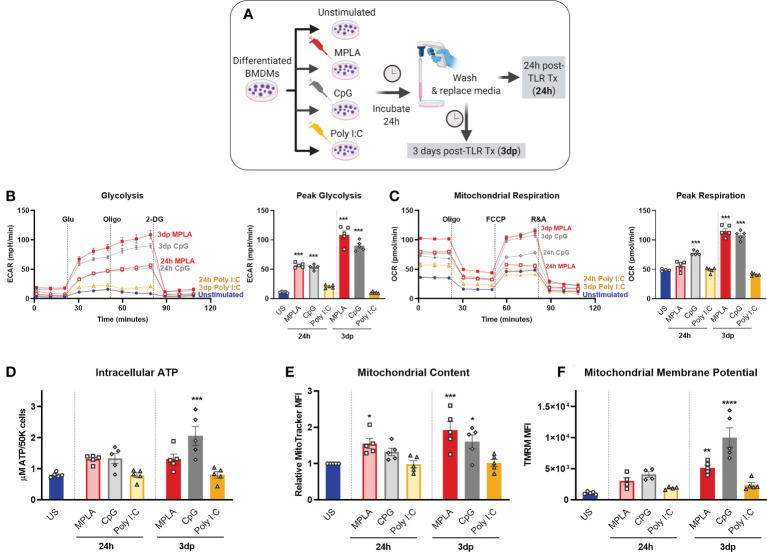
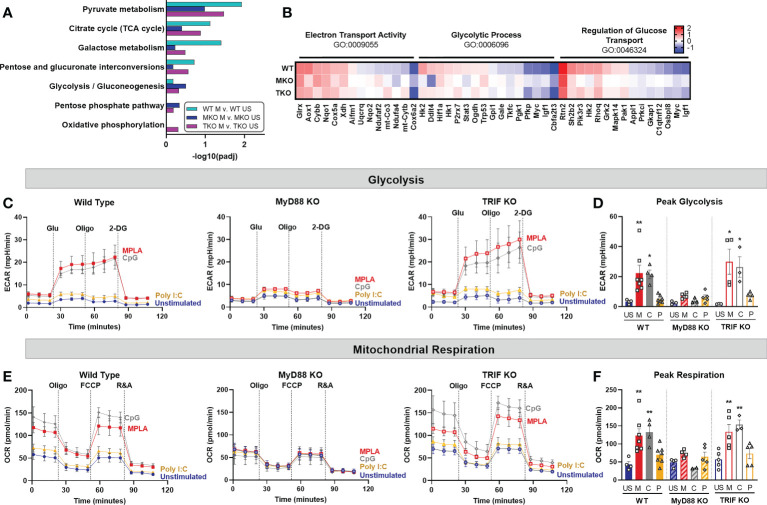
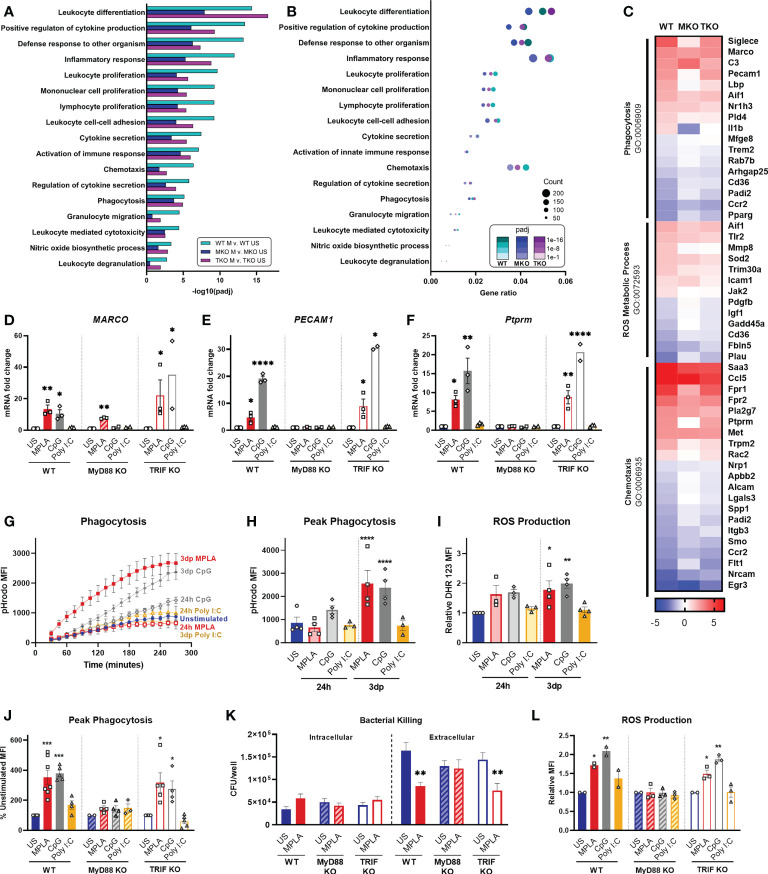
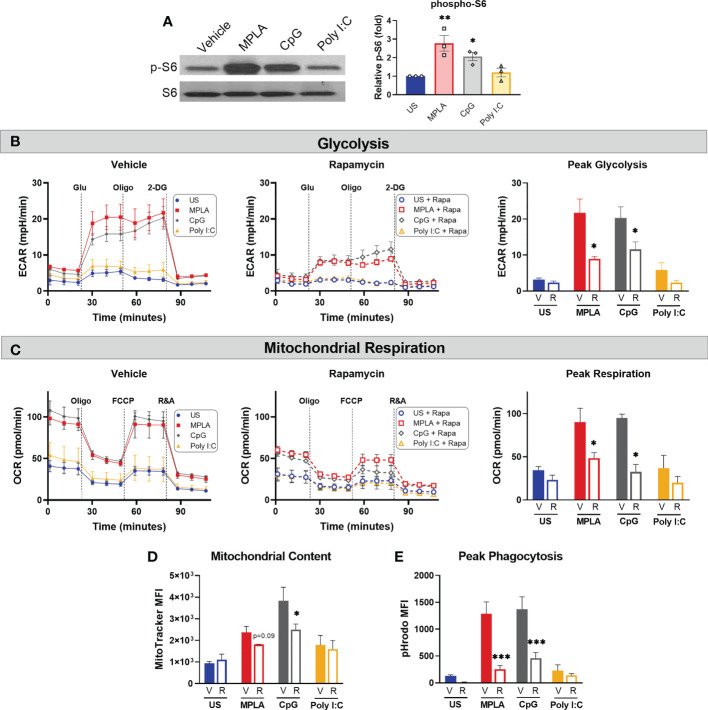
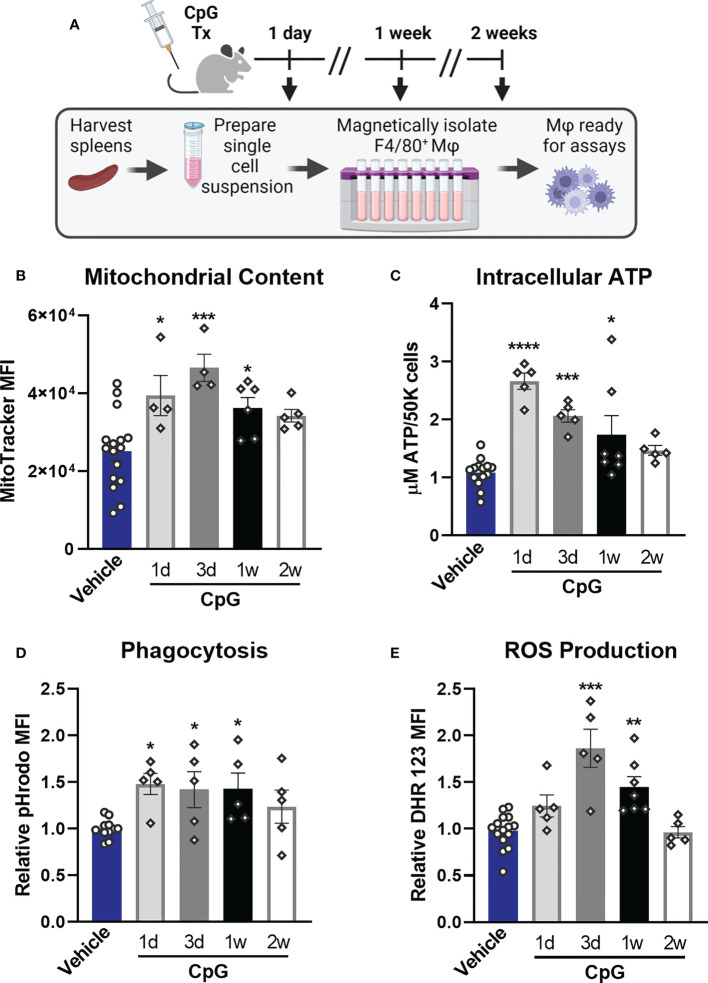
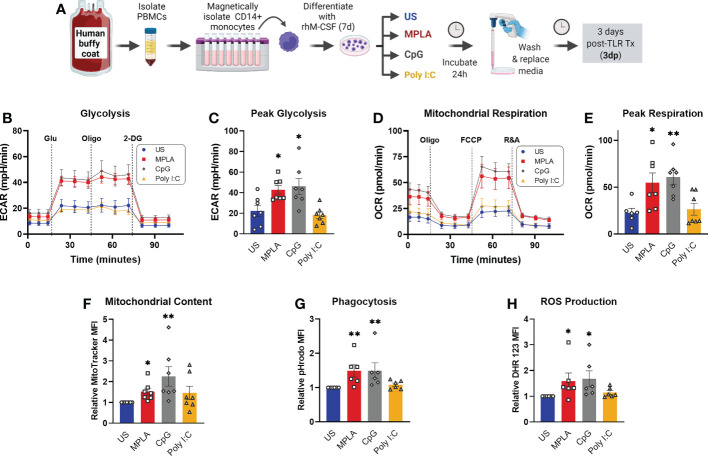
Immunocompromised populations are highly vulnerable to developing life-threatening infections. Strategies to protect patients with weak immune responses are urgently needed. Employing trained immunity, whereby innate leukocytes undergo reprogramming upon exposure to a microbial product and respond more robustly to subsequent infection, is a promising approach. Previously, we demonstrated that the TLR4 agonist monophosphoryl lipid A (MPLA) induces trained immunity and confers broad resistance to infection. TLR4 signals through both MyD88- and TRIF-dependent cascades, but the relative contribution of each pathway to induction of trained immunity is unknown. Here, we show that MPLA-induced resistance to Staphylococcus aureus infection is lost in MyD88-KO, but not TRIF-KO, mice. The MyD88-activating agonist CpG (TLR9 agonist), but not TRIF-activating Poly I:C (TLR3 agonist), protects against infection in a macrophage-dependent manner. MPLA- and CpG-induced augmentation of macrophage metabolism and antimicrobial functions is blunted in MyD88-, but not TRIF-KO, macrophages. Augmentation of antimicrobial functions occurs in parallel to metabolic reprogramming and is dependent, in part, on mTOR activation. Splenic macrophages from CpG-treated mice confirmed that TLR/MyD88-induced reprogramming occurs in vivo. TLR/MyD88-triggered metabolic and functional reprogramming was reproduced in human monocyte-derived macrophages. These data show that MyD88-dependent signaling is critical in TLR-mediated trained immunity.

Keywords: MyD88; TLR4; innate immune memory; innate immunity; macrophage; metabolic reprogramming; toll-like receptor (TLR); trained immunity.


Conflict of interest statement

The authors declare that the research was conducted in the absence of any commercial or financial relationships that could be construed as a potential conflict of interest.

Figures

Figure 1
Figure 1
MYD88-activating CpG, but not TRIF-activating Poly I:C, confers resistance to S. aureus infection. (A) Mice were injected with TLR agonists (20 µg i.v.), or vehicle (Lactated Ringers) for two consecutive days prior to systemic challenge with S. aureus (i.v.). (B-D) Wild type (B), MyD88-KO (C), and TRIF-KO mice (D) were challenged with S. aureus and survival was monitored for 15 days (n=5-9/group). (E) Bacteremia was assessed 48h after infection. (F) Schematic of TLR agonist pathway specificity and downstream signaling. (G) Pathway specificity of MPLA, CpG, and Poly I:C were determined by Western blotting of protein isolated from wild type BMDMs treated for 24h with TLR agonists compared to unstimulated negative controls. (H) Survival was monitored for 15 days post-S. aureus inoculation (n = 20-21/group). (I) Bacteremia was assessed 48h after infection (n = 5-10). (J) Tissue bacterial load (CFU/gram) of lung and kidney was quantified at 72h post-infection (n = 8-10/group). (K) Mice were infected with 108 CFU S. aureus (i.v.) 1 day-post (1dp), 1 week-post (1wp) or 2 weeks-post (2wp) CpG treatment alongside vehicle-treated controls. (L) Survival was monitored for 15 days post-infection (n = 10-18/group). (M) Body weights were measured at baseline and after infection. (N, O) Bacteremia was assessed at 3h (N) and 48h (O) post-infection. Mean ± SEM are shown for body weight (M). *p < 0.05, **p < 0.01, ***p < 0.001, ****p < 0.0001 by a log-rank Mantel–Cox test for Kaplan–Meier survival plots or otherwise determined by ANOVA followed by Dunnett’s post-hoc multiple comparison test.
Figure 2
Figure 2
Macrophages are critical for CpG-mediated host resistance to S. aureus infection. (A) Mice were injected (i.v.) with clodronate liposomes (CL) or control PBS liposomes (PL) 24h prior to the first injection of TLR agonist or vehicle. Mice were administered CpG, Poly I:C, or vehicle for two consecutive days (i.v.), and challenged with 108 CFU S. aureus (i.v.) the following day. (B) Survival was monitored for 15 days. (C) Representative images of F4/80 IHC staining of kidney samples harvested 1-day post-infection of macrophage-depleted (CL) or control (PL) mice are shown (scale bar represents 50 μm); F4/80 IHC was (right, n = 3/group). (D) Bone marrow-derived macrophages (BMDMs; MΦ) were treated with MPLA (1 µg/mL), CpG (1 µg/mL), or Poly I:C (10 µg/mL) for 24h or left unstimulated (US), washed, and transferred (5X10⁵ i.v.) to otherwise naïve mice 24h prior to systemic challenge with 108 CFU S. aureus. (E) Survival after S. aureus infection in macrophage recipient mice alongside vehicle-treated controls (n=9-15/group) was monitored for 15 days. (F) Bacteremia was assessed 3h post-infection. Bars represent mean ± SEM. ***p < 0.001 compared to CL + Vehicle and &&& p < 0.001 compared to CL + Poly I:C (B), *p < 0.05 and ***p < 0.001 compared to vehicle or ^^compared to unstimulated macrophages (E) by a log-rank Mantel–Cox test for Kaplan–Meier survival plots; ** p < 0.01 compared to vehicle controls determined by ANOVA followed by Dunnett’s post-hoc multiple comparison test.
Figure 3
Figure 3
MPLA-induced transcription is blunted in TRIF-KO and MyD88-KO macrophages. (A) Bone marrow-derived macrophages (BMDMs) were cultured from WT, MyD88-KO (MKO) and TRIF-KO (TKO) mice. BMDMs were treated with MPLA (1 μg/mL) or left unstimulated (US) as controls. After 24h incubation, media was changed and cells were rested for 3 days before harvesting RNA for RNAseq analysis. (B) Differential gene expression analysis of unstimulated control or MPLA-treated WT, MKO, and TKO BMDMs as shown by heatmap of all samples represented by columns (n=3/group) and rows corresponding to different genes. (C) Principal component analysis of MPLA-treated (_M) or unstimulated (_US) WT, MKO, and TKO BMDMs was conducted. (D) The number of MPLA-induced differentially expressed genes (DEGs) compared to genotype unstimulated controls (above dotted line) or compared to MPLA-treated WT cells (below dotted line) were quantified. (E, F) Down-regulated (green) and up-regulated (red) DEGs were visualized by volcano plots for MPLA-treated MKO cells (E) or MPLA-treated TKO cells (F) compared to MPLA-treated WT cells. (G-J) Gene ontology (GO) functional enrichment analysis was conducted for the 10 most downregulated pathways in the cellular component and molecular function classes in MPLA-treated MKO compared to MPLA-treated WT macrophages (G, H), or compared to MPLA-treated TKO macrophages (I, J). The number of genes differentially regulated in each respective pathway (i.e. “count”) are indicated by dot size and degree of significance (padj) by intensity of color. n=3 biological replicates/group. Log2foldchange >1 and adjusted p value < 0.05 were considered differentially expressed.
Figure 4
Figure 4
MyD88-selective CpG, but not TRIF-selective Poly I:C, triggers macrophage metabolic reprogramming. (A) Differentiated BMDMs were treated with MPLA (1 µg/mL), CpG (1 µg/mL), Poly I:C (10 µg/mL) or left unstimulated as controls for 24h. BMDMs were either washed and immediately assayed (24h) or rested for 3 days prior to assay (3dp). (B) Glycolysis stress test was performed and extracellular acidification rate (ECAR) was measured by Seahorse Xfe96 (left); peak glycolysis was analyzed (right). (C) Mitochondrial stress test of BMDMs was performed and oxygen consumption rate (OCR) was measured (left); peak respiration was analyzed (right). (D) BMDMs (5X10⁴) were washed, lysed, and ATP content was measured. (E) Mitochondrial content was assessed using MitoTracker Green staining and (F) mitochondrial membrane potential was assessed using TMRM staining. Data are shown as mean ± SEM, n = 4-5/group *p < 0.05, **p < 0.01, ***p < 0.001, ****p < 0.0001 by ANOVA followed by Dunnett’s post-hoc multiple comparison test.
Figure 5
Figure 5
TLR-induced metabolic rewiring is lost in MyD88-deficient macrophages. (A, B) Gene Ontology (GO) functional enrichment analysis was conducted on MPLA-treated WT, MyD88-KO (MKO), and TRIF-KO (TKO) bone marrow-derived macrophages (BMDMs) for metabolism-related pathways and displayed by significance of pathway induction (A). Differential expression of genes in metabolism-related GO pathways are shown by heatmap (B). (C, D) Glycolysis stress test was performed using Seahorse Xfe96 which measured extracellular acidification rate (ECAR) of TLR agonist-treated (MPLA, M; CpG, C; Poly I:C, P) or unstimulated (US) WT (left) MKO (middle), and TKO (right) BMDMs (C). Peak glycolysis was measured (D). (E, F) Mitochondrial stress test was performed under the same experimental parameters and oxygen consumption rate (OCR) is presented for WT (left), MKO (middle), and TKO (right) BMDMs (E). Peak respiration was measured (F). Data are shown as mean ± SEM, n = 3-5/group *p < 0.05, **p < 0.01 by ANOVA followed by Dunnett’s post-hoc multiple comparison test.
Figure 6
Figure 6
TLR agonist-induced augmentation of antimicrobial capacity is blocked in MyD88-KO, but not TRIF-KO, macrophages. (A, B) Gene ontology (GO) functional enrichment analysis was conducted for immunology-related pathways and displayed by significance of pathway induction (A) and by dot plot which shows number of genes differentially regulated in each respective pathway (i.e. “count”) by dot size and degree of significance (padj) by intensity of color (B). (C) Immune function-related GO pathways were evaluated by heat map comparing MPLA-trained WT, MyD88-KO (MKO), and TRIF-KO (TKO) BMDMs to unstimulated (US) genotype controls. (D-F) Relative gene expression of MARCO (D), PECAM1 (E) and Ptprm (F) of unstimulated control, MPLA, CpG, and Poly I:C-treated WT, MKO, and TKO BMDMs 3 days post-treatment (n=2-3 biological replicates/group). (G, H) The fluorescence emitted upon phagocytosis of pHrodo-tagged S. aureus bioparticles was measured over 4 hours (G) and peak phagocytosis was analyzed (H). (I) ROS production was assessed by flow cytometry. (J) Phagocytic capacity of MPLA-, CpG-, and Poly I:C-treated WT, MyD88-KO, and TRIF-KO were assessed alongside unstimulated (US) genotype controls. (K) Bacterial killing (S. aureus MOI 10) of MPLA-treated WT, MyD88-KO, and TRIF-KO BMDMs compared to US controls. (L) ROS production capacity was assessed. Data are shown as mean ± SEM, *p < 0.05, **p < 0.01, ***p < 0.001, ***p < 0.0001, ****p < 0.0001 by ANOVA followed by Dunnett’s post-hoc multiple comparison test.
Figure 7
Figure 7
mTOR is a key mediator of TLR/MyD88-induced macrophage metabolic and functional reprogramming. (A) Western blotting of phosphorylated S6 kinase (p-S6) and total S6K (S6) on protein lysates from BMDMs treated for 24h with the TLR agonists (1 µg/mL for MPLA and CpG, 10 µg/mL for Poly I:C) compared to unstimulated negative controls (left). Blots are representative of three repeated experiments which were quantified by densitometry analysis (right). (B-E) BMDMs were treated with 100 nM Rapamycin (R) or vehicle (V) 1h prior to the addition of TLR agonists which remained in culture until washed off 24h later and cells were rested for 3 days prior to assays. (B) Glycolysis stress test was performed using Seahorse Xfe96 which measured extracellular acidification rate (ECAR) for vehicle-treated (left) and rapamycin-treated (middle) BMDMs, and peak glycolysis was analyzed (right). (C) Mitochondrial stress test was performed under the same experimental parameters as glycolysis stress test, and oxygen consumption rate (OCR) is presented for vehicle-treated (left), rapamycin-treated (middle), and peak respiration was measured (right). (D) Mitochondrial content was assessed using MitoTracker Green staining. (E) Phagocytic capacity was indicated by fluorescence emitted upon phagocytosis of pHrodo-tagged S. aureus bioparticles and analyzed at peak activity. Data are shown as mean ± SEM, n = 2-3/group *p < 0.05, **p < 0.01, ***p < 0.001 by ANOVA followed by Dunnett’s post-hoc multiple comparison test.
Figure 8
Figure 8
CpG induces macrophage metabolic and functional rewiring in vivo. (A) Mice were treated for two consecutive days with CpG (20 µg i.v.) or vehicle (Lactated Ringers) and spleens were harvested 1-day (1d), 3-days (3d), 1-week (1w), or 2-weeks (2w) later. Spleens were processed for magnetic isolation of F4/80+ macrophages which were used immediately for respective assays. (B) Mitochondrial content was assessed by MitoTracker Green staining. (C) Intracellular ATP content was measured. (D) Relative phagocytic activity was assessed by emitted fluorescence upon phagocytosis of pHrodo-tagged S. aureus bioparticles and measured by flow cytometry. (E) ROS production was determined by relative dihydrorhodamine 123 (DHR 123) fluorescence. Data are shown as mean ± SEM, n = 5-16/group *p < 0.05, **p < 0.01, ***p < 0.001, ****p < 0.0001 by ANOVA followed by Dunnett’s post-hoc multiple comparison test.
Figure 9
Figure 9
Activation of TLR/MyD88 signaling induces training in human monocyte-derived macrophages. (A) PBMCs were enriched from human buffy coat samples and monocytes were isolated using immunomagnetic CD14+ positive selection. Monocytes were differentiated for 7d with recombinant human M-CSF (rhM-CSF) resulting in human monocyte-derived macrophages (hMDMs). hMDMs were treated for 24h with MPLA (10 µg/mL), CpG (10 µg/mL), or Poly I:C (100 µg/mL) or left unstimulated (US) as negative controls. Agonist-treated hMDMs were washed, media was replaced, and cells were rested for 3 days prior to assays (i.e. 3 days post-treatment; 3dp). (B) Extracellular acidification rate (ECAR) was measured as an indicator of glycolytic capacity and (C) Peak glycolysis was analyzed. (D) Oxygen Consumption Rate (OCR) was measured and (E) peak mitochondrial respiration were analyzed. (F) Mitochondrial content was assessed by MitoTracker staining. (G) Phagocytic capacity was measured by fluorescence of pHrodo-labeled S. aureus. (H) ROS production was determined by relative dihydrorhodamine 123 (DHR 123) fluorescence. N=6-7/group, *p < 0.05 and **p < 0.01 by ANOVA followed by Dunnett’s post-hoc multiple comparison test. .

References

    1. Liang W, Liang H, Ou L, Chen B, Chen A, Li C, et al. . Development and validation of a clinical risk score to predict the occurrence of critical illness in hospitalized patients with COVID-19. JAMA Intern Med (2020) 180:1081–9. doi: 10.1001/jamainternmed.2020.2033 - DOI - PMC - PubMed
    1. Grasselli G, Greco M, Zanella A, Albano G, Antonelli M, Bellani G, et al. . Risk factors associated with mortality among patients with COVID-19 in intensive care units in Lombardy, Italy. JAMA Intern Med (2020) 180:1345–55. doi: 10.1001/jamainternmed.2020.3539 - DOI - PMC - PubMed
    1. Haque M, Sartelli M, McKimm J, Abu Bakar M. Health care-associated infections - an overview. Infect Drug Resist (2018) 11:2321–33. doi: 10.2147/IDR.S177247 - DOI - PMC - PubMed
    1. CDC . Antibiotic resistance threats in the united states, 2019. Atlanta, GA: U.S. Department of Health and Human Services; (2019).
    1. Owen AM, Fults JB, Patil NK, Hernandez A, Bohannon JK. TLR agonists as mediators of trained immunity: Mechanistic insight and immunotherapeutic potential to combat infection. Front Immunol (2020) 11:622614. doi: 10.3389/fimmu.2020.622614 - DOI - PMC - PubMed

Publication types

MeSH terms

Substances